- Stocks to rise, especially early in the week
- Dollar decline likely, but perhaps only back to 50 DMA
- Gold to rebound strongly, but below recent highs
- Crude oil to move higher, perhaps above $76
- Stocks to rise, especially early in the week
- Dollar decline likely, but perhaps only back to 50 DMA
- Gold to rebound strongly, but below recent highs
- Crude oil to move higher, perhaps above $76
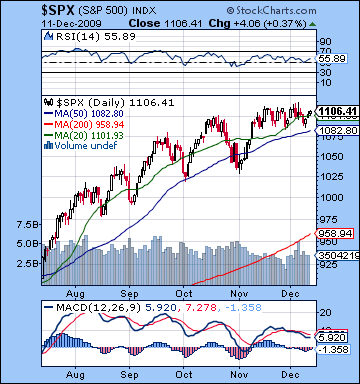 Stocks went mostly nowhere last week as the distant rumbling of potential global defaults in Dubai and Greece were largely balanced by some positive consumer retail numbers. After some early weakness, the key indexes came back yet again as the Dow closed at 10,471 and the S&P at 1106. I had hoped for a deeper decline to 1080 or below on the Mercury-Saturn-Pluto pattern early in the week but as usual, the market resisted the worst of it and then popped up once again. Monday and Tuesday were negative but nowhere near as bad as forecast as the positive energy from the Jupiter-Neptune conjunction appears to be counteracting the worst of the bearish aspects. This has been a recurring theme of late as very negative patterns see only modest declines, or sometimes no declines at all. Aside from the obvious interpretive error on my part, these mitigated declines are evidence that medium term aspects are exercising an important supporting influence on prices. Until some of these clearly negative aspects start to deliver, we cannot expect the market to correct significantly. In any event, Wednesday was the day of the intraweek low and the reversal as the Moon-Saturn-Pluto pattern did deliver more caution but sentiment changed swung back to the positive by the close. As expected, Thursday was the most positive day of the week as the Sun-Mars aspect lit a fire under the bulls as prices went higher. I had been a little unsure about Friday, although I did expect some buying in the morning. As it happened, prices stayed mostly higher throughout the day and finished the week off on a positive note.
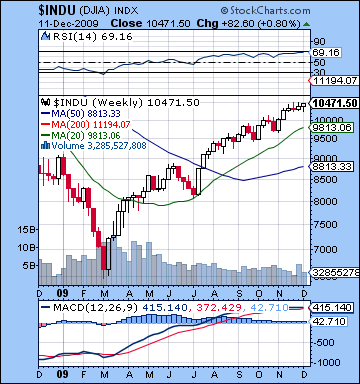
The market seems stuck in a fairly narrow trading range in the rising wedge pattern, perhaps between 1080 and 1120 on the SPX. While previous weeks have seen testing of the upside with repeated failures to move above 1120, last week was the opportunity for bears to test support. With economic news avoiding any extremes, there wasn’t a good enough reason to break down below 1080 and so up we went again, perhaps ahead of another test of resistance this week. The technicals remain largely unchanged from last week as the S&P is trading close to its 20 DMA and is well above its 50 DMA which is also very close to its rising support trendline. Volume is still not a significant factor and RSI at 55 is bullish and rising. It is still in a bearish divergence with a series of progressively falling peaks, however. We should watch carefully to see if any gains next week can break this downward pattern. The November high corresponded with an RSI around 65-68 so any RSI reading above that level should be seen as very bullish. If the market fails to equal that RSI level, then the bearish divergence will still be in place. Even though we should expect some gains this seek, I am skeptical that the RSI can go above this level. MACD is still in a negative crossover with the bearish divergence is still very much intact. A gain this week might end the bearish crossover but it is unlikely to break the series of progressively lower peaks. We also see continuing evidence of a narrowing of the breadth of the rally as the Dow added 1% this week, while the S&P was unchanged and the broader NYSE Composite lost 1%. The weekly Dow chart shows that the rally is still a going concern with continued to post positive, if tiny, MACD histograms. While this MACD chart is as a flat as pancake, it does not show any obvious signs of breaking down. Maybe it needs to finally hit RSI 70 before it’s truly overbought. Since it’s at 69 now, one more rally week might be enough. With some positive aspects due this week, it seems inevitable the S&P will again test 1120. The larger question is: to what extent can it break above that level? With the chance of at least two positive days, probably occurring early this week, I would not rule out a close above 1120 or even 1130. If that happens, it will likely trigger a wave of shorting which will push prices lower again.
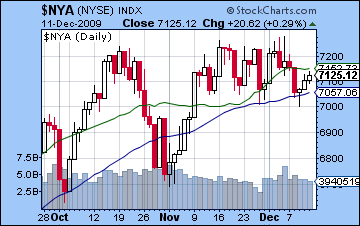 While we may be in for a short term spike here, the endgame to this rally is never too far away. The long awaited draining of liquidity from the system began last week as the Fed undertook some reverse repos. These should be seen as necessary measure to avoid the temptation of creating yet another asset bubble (too late, Ben, we’re already in one) and is a first step that will precede any rate hike. We also saw a long term treasury auction attract higher yields last week, which indicates a growing concern over ballooning government deficits and the expectation of higher interest rates down the road. Together, these are indications that some fundamental changes in recent prevailing market patterns may be at hand. The recent resuscitation of the US Dollar is another critical ingredient to any significant shift in the investment climate and that trend continues apace. For the past year, the value of the Dollar has varied inversely with stocks as the falling Dollar has sparked increased risk appetite and promoted the carry trade speculation in equities. As the Dollar continues to rise back towards more "normal" levels, however, it will put more pressure on carry trade speculation. In fact, the market rally owes so much to the carry trade in the Dollar, that more signs of economic recovery may not actually be net positive for stocks. While we have seen gains for both stocks and the Dollar at times over the past two weeks, this relationship will likely be unsustainable for the medium term as the Dollar’s appreciation will soon begin to eat into any appetite for stocks. In that sense, stocks may be caught in a trap: bad economic news will be bad for stocks and good for the Dollar as safe haven, but good economic news may be Dollar positive but only provide temporary positive results for stocks as investors long in equities mull over their choices. At some point, the inverse relationship between the Dollar and stocks will likely reassert itself with the stock market and commodities suffering most of the consequences. That is the view that makes the most sense to me at the moment.
 So we appear to be heading higher this week, at least temporarily. There is a multi-planet alignment involving the Sun, Jupiter, Uranus and Neptune on Monday and Tuesday that would strongly incline the market towards gains. As noted above, this could take us to key resistance levels and perhaps even a bit beyond. Monday seems to be the better of the two days as the Sun is still applying to its aspect with Jupiter. On Tuesday the aspect has already passed, so it’s conceivable that we could see a decline or, at least, a choppy day. That said, we can still make a bullish case for Tuesday since it has a nice Sun-Neptune sextile and a Moon-Venus conjunction that comes exact near the close of trading. Wednesday’s New Moon in the first degree of Sagittarius is perhaps a better candidate for a reversal down since it follows on the heels of these positive aspects and may correspond to an exhaustion of optimism that sees prices fall. Thursday and Friday both appear to lack any obvious positive influences so it may be more difficult for the market to rally. It’s not clear to me if both these days are negative, but there is a good chance that at least one will be. I would lean towards Thursday being the more negative of the two. Overall then, we should move higher in the early going — perhaps above 1120 — and then gradually fall back with possible intraweek lows approaching the support levels of 1080. Probably we finish somewhere above support, although perhaps below where we are now.
Next week (Dec 21-25) is holiday-shortened for Christmas with accompanying reduced volumes but we could see some significant moves as Mercury approaches its conjunction with unpredictable Rahu (North Lunar Node) in partial aspect with Mars. While Venus is at the tail-end of a positive aspect with Jupiter, Uranus and Neptune, it seems unlikely that the positive Venus effect can squeeze out more than one positive day, if that. In fact, Monday the 21st may be a significant down day given all the tight aspects in play. We should also mention two very important celestial measurements for the market that week: the Mars retrograde on December 20 and the Jupiter-Neptune conjunction on December 21. Both may turn out to be big negatives for the market going forward. Mars represents action and assertiveness and when it is retrograde it can indicate timidity or an inability to act with clarity. It can also symbolize a misapplication of energy or action or sudden acts of violence. Historically, the Mars retrograde period has a significant correlation with market corrections. The Jupiter-Neptune conjunction represents the apex of hope and idealism so it’s conceivable that it could correspond with the market top, although I tend to think it will occur closer to December 14th. It’s perhaps not coincidental that Obama will address the Copenhagen climate conference on December 18, just two days before the exact conjunction. With the various pie-in-sky proposals for emissions cuts and the ground thick with good intentions, it doesn’t get more idealistic or hopeful than that! Once the conjunction has passed, however, we could see a vacuum of optimism that is soon replaced by pessimism and fear. It’s not clear exactly when the positive effects of this conjunction will fade, but it will be something to watch out for. The following week (Dec 27-Jan 1) also looks quite bearish as we will be in the aftermath of the Sun-Pluto conjunction. This is another aspect that could have geopolitical implications that could be negative for the market. There is a reasonable chance that we could see an interim low formed in early January, perhaps around the 8th.
5-day outlook — bearish-neutral SPX 1090-1110
30-day outlook — bearish SPX 950-1000
90-day outlook — bearish-neutral SPX 1000-1100
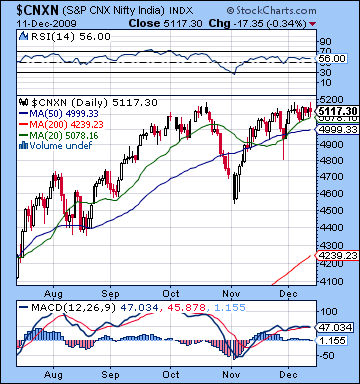 Stocks in Mumbai were mostly unchanged last week as positive factory output data wasn’t enough to take the market to significant new highs. With overhead resistance weighing on most traders’ minds, the Nifty ended Friday at 5117 while the Sensex closed at 17,119. I had been more bearish on the early week Mercury affliction so this stalemate was a little disappointing. Monday was down as forecast but the move was much more modest than forecast as the worst of the Mercury-Saturn-Pluto never really took hold. This was likely due to offsetting from the approaching Jupiter-Neptune conjunction which has exercised a positive influence over the market of late. Tuesday’s open was similarly lacking in bearishness but we did see a recovery by the close as I thought we might with the separation of Mercury away from Pluto’s malefic influence. I had been uncertain about Wednesday, but it turned out to be mildly negative as the Leo Moon came under Rahu’s aspect. The latter part of the week was mostly flat as Thursday’s shallow rise was followed by Friday’s afternoon slump. I had thought Thursday might be the more negative of the two days on the Moon-Saturn-Pluto pattern but this aspect was not as powerful since it was past exactitude. Friday’s weakness seems to have come on the Moon moving into an exact harmonic aspect thus activating the fiery Sun-Mars trine. Overall, the market is still the beneficiary of the Jupiter-Neptune conjunction, now just two degrees from exactitude which occurs on 21 December. The failure of the Mercury-Saturn-Pluto alignment to break support is testimony to the enduring bullishness of this aspect which has directly or indirectly supported prices since March.
And yet for all the bullishness inherent in the Jupiter-Neptune conjunction, the market remains trapped in a narrow trading range, seemingly unable to break above Nifty 5200 or break below 4900 on the downside. The tug-of-war is intensifying here as the market shows continued signs of topping as the past three weeks have seen repeated attempts to break above October highs but has little to show for it. Momentum is still somewhat positive as both indices are trading above their 20 DMA. After a recent bearish crossover, the 20 DMA has rebounded and is now above the 50 DMA, a bullish signal. MACD is also slightly positive, although it may not give much medium term comfort to bulls owing to its ongoing bearish divergence of progressively lower peaks. The ebbing of enthusiasm is also seen in the RSI which now stands at 56. Although bullish enough, its level is now lower than it was for previous market highs and hence is a possible signal of eventual breakdown of the rally. Bulls may need this indicator to turn sharply higher (above 65) in order to break the pattern of falling peaks. While we are likely to see some upward movement this week, it may not be sufficient to move the RSI to this level. As we have been documenting, the underlying weakness of the Indian market is perhaps best seen in the weekly Sensex chart. While the chart itself shows considerable flattening, MACD has been negative since late October. This is a sign that momentum is slackening. While it does not preclude a breakout higher, it is an important medium term indicator that the market is on the verge of a more significant correction before any future move higher can be undertaken. The chart of ICICI on the NY exchange (See IBN chart) also reveals the possible break down of leading financials which does not bode well for the rally in the near term. Therefore, any rally attempts in the near term will still have to confront the 5200 level on the Nifty and beyond that, perhaps 5350. While a significant breakout above 5200 would encourage bulls and bring more money in the market in the short term, I would want to see the market hold above 5200 for several days before being convinced of any new leg up. I don’t expect anything major up move to happen at this point, but it is something to consider. Support will likely be found around the 50 DMA at 5000, and below that the 4800 level which corresponds to the previous low. If the market should correct further, 4500 would be the next level where we could see buyers move in.
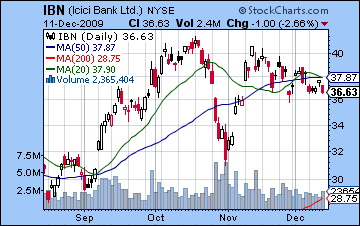 This week should begin quite bullishly as Monday and Tuesday will see a nice Sun-Jupiter aspect which could further harness extra positive energy from Uranus and Neptune. Monday may begin somewhat weakly as the Moon is debilitated in early Scorpio but there is a good chance of strengthening by the close. Overall it should be up, perhaps by a lot. Tuesday may see an opposite dynamic with some strength at the open but weakness towards the close. We could well see another up day here since the Sun is in aspect with Neptune, but the difficulty here is that it will have left the Jupiter influence behind. In any event, Monday and Tuesday should yield a positive outcome overall to the market and I would not rule out a close (or two) above 5200 here. Wednesday features a New Moon in the first degree of Sagittarius and this could be seen as a possible indication of a reversal. The lunation cycle noted in previous newsletters has been interrupted of late so its unclear how much weight to attribute to this factor. Wednesday also has a Moon-Venus conjunction in late Scorpio which could offer some support for prices, especially early on. Watch for deterioration as the day progresses, however. Thursday’s open looks quite bearish as the Moon conjoins Pluto and sets off the Saturn-Pluto energy. Some recovery or tempering of the negative sentiment is possible by the afternoon. By contrast, Friday’s open looks more positive as the Moon conjoins Mercury. If Wednesday and Thursday have been weaker, the Friday could well be higher as Venus is within striking range of its minor aspect with Jupiter. Overall, it looks like early week strength followed by retracement later on which could put stocks at roughly the same level, although the possibility for an up week here is very real.
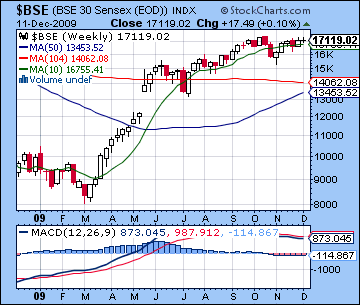 Next week (Dec 21-25) will be shortened for Christmas holiday on Friday and there is another opportunity for the bears to take control. Mercury approaches its conjunction with Rahu while slowing down in advance of its retrograde station. At the same time, Mercury will be in tense aspect with Mars. Together, these influences are not at all positive. Moreover, Mars turns retrograde on 20 December and this should be seen as another bearish indicator. Mars symbolizes action and assertiveness and its backward motion can correlate with either timidity or false bravado, both of which do not result in positive outcomes. Mars is also the significator of violence and conflict of all kinds so its retrograde period opens the door to potential geopolitical events that may be relevant for the market. In addition, the Jupiter-Neptune conjunction occurs on 21 December and while supportive of the market leading into that date, the period afterwards is increasingly vulnerable to declines as Jupiter moves away from Neptune for the last time. With Venus in aspect to Neptune on the 21st, we could see a gain but it is likely to be short-lived as sellers will likely move in after that. The following week (Dec 28-Jan 1) also looks quite negative as both the Sun and Venus conjoin Pluto and could trigger more negative energy from the Saturn-Pluto aspect. January looks mixed at best, with more bearishness likely in the first part of the month.
5-day outlook — neutral NIFTY 5000-5200
30-day outlook — bearish NIFTY 4300-4700
90-day outlook — bearish-neutral NIFTY 4800-5100
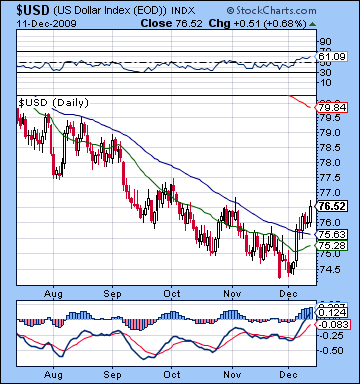 At long last the US Dollar broke above its key resistance level of the 50 DMA and finished more than 1% higher for the week. Marking its second straight week of gains, positive retail numbers breathed life in the greenback as the USDX finished at 76.5. This outcome was welcome news indeed as my bullish forecast correctly noted the early week gains that would come from the Mercury-Pluto conjunction. This was a familiar flight to quality story as stocks got hit with poor earnings news and along with whispers of possible defaults in Dubai and Greece. What is more surprising perhaps is that the biggest gain of the week occurred on Friday on optimism for a quick and lasting US economic recovery. I thought we might see more of retracement on the Sun-Mars aspect but if anything, the Mars influence on the Sun seemed to invigorate the Dollar further as it crossed over the ascendant in the natal DX chart. Everything is coming up roses here, as the Dollar now seems to be the beneficiary of both positive and negative economic news. This is the first time the Dollar has traded above its 50 DMA since the heady days of March when it stood at 86. While it is long way from that level, the technicals continue to improve and now can also boast momentum bullishness. Besides trading above its key moving averages, the 20 DMA has turned higher for the first time since April. MACD features a strong bullish crossover and while the Dollar has merely matched its previous late October high, the MACD peak at 0.124 is substantially above its October high. It should also be noted that MACD has finally entered positive territory, another sign that a long term reversal is at hand. RSI at 61 is climbing and has broken above resistance around 50-55 that characterized previous rally attempts over the previous six months. It’s been a long time coming, but it looks like we’ve put in a solid bottom in the Dollar upon which it will mount a significant rally in the months to come.
This week could see more upside early in the week with Venus conjoining the ascendant in the DX chart. While the Sun-Jupiter aspect should be good for stocks, this Venus influence ought to generate some upside in the early week also, perhaps suggesting that there will some positive US economic news that lifts both. Tuesday could be the better of the two days as the Moon joins Venus in close proximity to the ascendant. Wednesday and Thursday may be weaker, however, as transiting Mercury comes under the troublesome natal aspect of Mars although I doubt if both days will be lower. Friday may be another bearish day as the Moon joins Mercury around 23 Sagittarius and create problems. The more bearish scenario here would suggest a 1% decline back to 75.5 for the week but I think we could still finish up approaching current levels all things considered. Next week looks more bullish as the Mars retrograde may enhance the Dollar’s safe haven status. Assuming we stay around 76 this week, the Dollar could well reach 80 by year’s end with an interim January high of 82. If we somehow end up positive this week — an admittedly unlikely prospect — then the more bullish scenario of 85 in January could be possible.
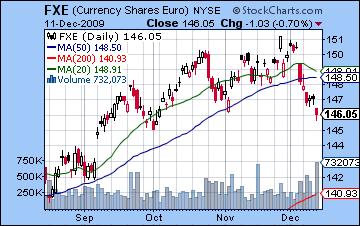 The Euro slipped over 1% last week as it closed just above 1.46. This negative outcome was in keeping with expectations as the Euro broke below its support level of 1.48. The Mercury-Pluto conjuction in the early week produced anxiety which drove more investors back to the dollar. The mid to late week Sun-Mars aspect helped stabilize the Euro but it never managed any significant gains. Friday’s sharp sell-off was surprising although now that Uranus is moving forward and away from the natal Jupiter in the Euro chart, this may be a sign of things to come as the default trend for the Euro may now be down. This week looks somewhat better for the Euro with Monday looking to be the best day on the Sun-Jupiter square aspect. The rest of the week may still see a day or two of gains but Thursday stands out as more negative as the Moon-Pluto conjunction occurs during trading in Europe. This week has the best chance for a bounce, perhaps back to the 50 DMA at 1.48. In that case, it would be a classic instance of support becoming resistance in a reversal pattern. After that, the Euro looks more negative as the Sun and Venus move through the 4th house of the Euro natal chart which should trigger the worst of the Saturn-Pluto aspect, which is situated on the natal angles. The 200 DMA is around 1.41 and that may be a good target for the Euro by January. As expected, the Rupee edged lower last week closing at 46.7 amidst continued Dollar strength. Some bounce is possible this week, perhaps back to 46, but it looks to be short-lived as a series of difficult aspects in late December will likely lessen risk appetite and send investors back to the Dollar.
Dollar
5-day outlook — bearish-neutral
30-day outlook — bullish
90-day outlook — bullish
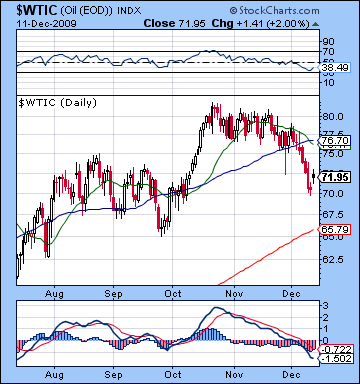 As expected, crude oil continued its slide last week as the emerging Dollar rebound pushed speculators towards the exits. After trading below $70 late in the week, crude finished just under $72 on the continuous futures contract, although the monthly futures closed at $70. The early week Mercury-Pluto conjunction moved money out of commodities but the decline was more muted than expected as crude slipped back under $73. I had expected deeper declines here with some recovery later on, perhaps Thursday. As it turned out, Friday was the better day with bearishness predominating before that time. Even there, oil ETFs such as USO fell on all five trading days, a very bearish signal. The technicals go from bad to worse here, as the 20 DMA has now crossed below the 50 DMA. Crude has now fallen decisively below its 50 DMA at $76.50 and that level should now be seen as possible resistance. Previous breakdowns below the 50 DMA as happened in late October saw rallies back over the 50 DMA in short order. We shall see if crude is as ebullient this time around given the surfeit of negative planetary energy in late December. MACD is still in a very deep negative bearish crossover and is now in negative territory. RSI at 38 is bearish and has broken below 40 which corresponded with the October low. The 200 DMA stands at $66 so that should bring in more buyers if and when crude falls to that level. Below that $60 would seem to provide some support also.
This week is likely to see a significant rebound in crude as the Sun aspect will trigger the approaching Jupiter-Neptune conjunction which is well placed in the Futures chart. Monday and Tuesday both look positive so we could well see a gain back towards $76 and the 50 DMA. After that, the picture becomes more mixed with Wednesday leaning towards a decline and Thursday’s Venus-Mars trine aspect also not terribly bullish. We are likely to see one up day in the latter part of the week with Friday perhaps looking a little better than Thursday. Overall, there is a good chance that crude is higher for this week. Next week begins with a number of close aspects on Monday including a very bullish a Venus-Jupiter aspect and a very bearish Mercury-Mars aspect. It’s possible we could see a strong open followed by a sell-off in the afternoon that sends crude down for the week. It may also just correspond with a bearish Monday which will set the tone for the week. Overall, this is likely to take crude down to $70 again by the Christmas break with further declines likely in the last week of December. January is shaping up as fairly bearish so we could see $60 at that time.
5-day outlook — neutral-bullish
30-day outlook — bearish
90-day outlook — bearish-neutral
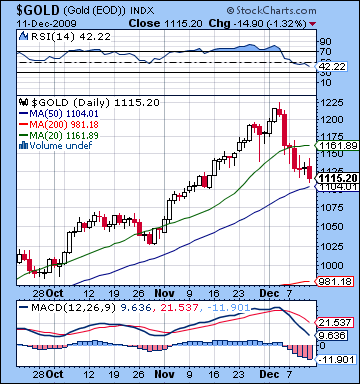 As the Dollar continued its comeback, gold was indiscriminately dumped as prices fell through the week before closing at $1115 on the continuous contract. This outcome was in line with expectations as the early week Mercury-Pluto conjunction created the anxiety necessary for investors to reduce their gold exposure. It was a little disappointing that we didn’t see any panic selling but the downward trend was nonetheless reinforced. I was correct in identifying Thursday as the most bullish day on the Sun-Mars aspect although prices barely budged as the continuous contact gained a whole dollar. Wednesday and Friday saw more losses despite the relative absence of any tight malefic planetary aspects. This is perhaps more evidence that the gold market is on much shakier foundation now that Jupiter has taken its leave from the natal Moon. Without this form of Jupiter price "insurance", gold is unprotected and may be more vulnerable to declines even without clear aspects. Gold’s technicals have understandably worsened since last week as MACD is solidly negative. RSI at 42 has plunged into negative territory and has returned to levels last seen in August. Gold is now trading below its 20 DMA but still above its 50 DMA at $1104. Gold has yet to enter uber-bear territory inferred by the bearish crossover of the 20 and 50 DMA but this day may not be far off as current trends are likely to continue in coming weeks. With the Dollar getting a boost from both negative and positive economic news these days, it is likely to extend its rebound well into 2010. This will be very negative for gold. The 200 DMA at $980 may be tested sooner than many people think.
This week is likely to see some kind of bounce as the Sun-Jupiter aspect Monday and Tuesday should push gold higher for at least one day. This rise could be quite strong and would not rule out $1150 this week or perhaps even higher. Wednesday’s New Moon may also see some buying as the natal Venus (1 Libra) in the ETF chart should be positive triggered by the Sun-Neptune aspect in the first degree of Sagittarius. Thursday and Friday will likely be weaker overall, although they may divide into one up and one down day. Overall, there is a very good chance for a significant rebound here, although it may only constitute a 50% retracement from the highs. This would be equal to $1170. Gold is likely to resume its downward spiral next week as Mars turns retrograde on December 20 and Venus perfects its aspect with Jupiter and Neptune. This looks like it could be another plunge that could take prices below $1100. The situation in gold is unlikely to pick up anytime soon as both Venus and Sun will be afflicted by the Saturn-Pluto aspect at the end of December. I would not be surprised to see gold trading near $1000 in early January. While we should see some strong rallies in January and February, they may only punctuate a wider weakness in gold. I am expecting some kind interim bottom in March around the time that Mars ends its retrograde period on the 9th of that month. At this point, it’s anyone’s guess where gold will be trading then.
5-day outlook — bullish
30-day outlook — bearish
90-day outlook — bearish

