- Wild card Monday will likely mark the beginning of bounce; markets remain vulnerable through summer
- Dollar likely trending lower this week; bullish trend through summer to continue
- Gold likely to consolidate through the week
- Crude oil moving higher into mid-June
- Wild card Monday will likely mark the beginning of bounce; markets remain vulnerable through summer
- Dollar likely trending lower this week; bullish trend through summer to continue
- Gold likely to consolidate through the week
- Crude oil moving higher into mid-June
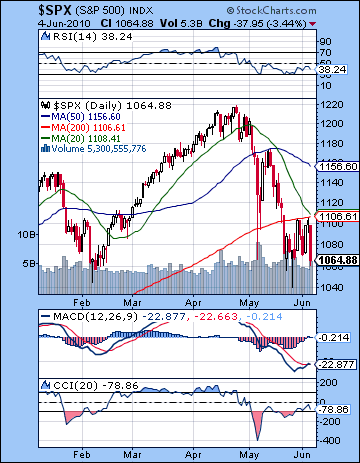 A poor employment report sent stocks tumbling yet again Friday wiping out the modest gains for the week. After closing over 1100 on Thursday, the S&P ended the week more than 2% lower at 1064 as the Dow finished below the 10,000 mark at 9931. It was another week of jitters as the bad news piled up all around the earnest rally attempts. The anemic jobs report, a possible default by Hungary that sent the Euro below 1.20 for the first time since 2006, and the ongoing nightmare of the oil spill in the Gulf proved too much for the bulls to bear. (!) While I wasn’t hugely surprised where we ended up, I was expecting a little more upside thrust at the end of the week. Alas, Friday’s drubbing came just as Mars was only a few minutes of arc past its opposition to Neptune. In last week’s newsletter, I thought this negative influence was more likely to manifest Thursday as we set the stage for some kind of more significant recovery next week on the Jupiter-Uranus conjunction that comes exact Tuesday June 8. Nonetheless, the week did feature some aspects that delivered the goods as Tuesday’s Mars-Saturn aspect coincided with a decline that took the S&P down to 1070. It wasn’t a clear retest of the May low of 1040-1050 but it did offer the market some encouragement to take a run at the 200 DMA around 1105. The bulls did well enough to achieve this but were stopped dead in their tracks at 1100-1105 on two consecutive days. A positive jobs number might have been enough to take it over the top, but Friday’s bad news meant that the 200 DMA becomes even more important resistance down the road. As the planets might suggest, we’re still very much in the soup here. After its direction station on May 30, Saturn is moving forward once again and will oppose Uranus for the final time on July 21. This is an unsettling influence that will likely have a limiting effect on rallies and could spark more selling. We should also note that Saturn will form another exact quincunx (150 degree) aspect with Neptune on June 27 — just one day after a lunar eclipse. The Saturn-Neptune is also a bearish combination and while it may be less pivotal that Saturn-Uranus, it is not to be ignored. The simultaneous lunar eclipse puts an additional emphasis on this aspect and increases the likelihood that the market will make another major move down over the summer. As if that wasn’t enough, Uranus will turn retrograde on July 5. Since this will occur just one degree from Saturn, it increases the available planetary torque and further darkens the financial horizon for the coming weeks. Readers may recall that a previous Uranus station occurred on December 1 when we had a significant shift in the trends in currency markets. At that time, the Dollar ended its decline and started climbing against the Euro. I would not be surprised to see markets reverse again around that station again, although perhaps it will mark a high in the Dollar this time. We shall see. But generally speaking, markets are up to their knees in quicksand here and sinking quickly. I would think that any rallies we see here should be regarded as heaven sent gifts to exit long positions.
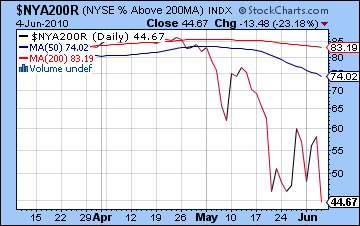
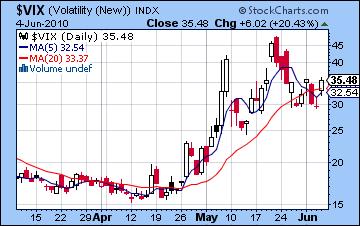
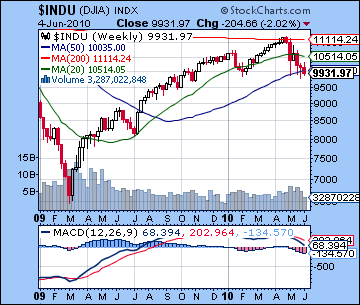 With the failed break above 1105 last week, the technical situation remains cloudy at best. The bulls had a fair shot to take prices higher but could not do so and now the market is perched on a precipice overlooking a deep canyon that lies below 1040. There is still 24 points to go before its white-knuckle time on the S&P and bulls will likely step in with significant buying if prices fall below 1050. Bulls may also point to the beginnings of a bullish crossover in the daily MACD chart, although this really could go either way at this point. CCI (-78) is falling again and did not make it past the 50 line this week, underlining the tentative quality to the rally. RSI (38) is attempting to build a base off its recent lows. This hints at higher highs and higher lows over the past two weeks which would be bullish. And yet Friday’s close was the lowest yet during this correction. Previous tests of the February lows all occurred intraday and finished higher than 1064. That’s a bearish signal that could open the possibility for more downside probing early next week. Volume was higher for Friday’s loss than for Wednesday’s solid gain, so this is another hallmark of a market that is running on fear. The VIX volatility index made a small increase last week and indicates more volatility for the medium term. Our little VIX 5/20 DMA crossover indicator shows an indeterminate reading as we can discern only the slightest of bullish crossovers by the 5 DMA over the 20 DMA. This is perhaps another appropriately cloudy indicator for the short term. Breadth appears to be weakening, however, as the number of NYSE stocks trading below their 200 DMA made a new high for the year at 44%. Given the proximity of the indexes to the 200 DMA this is perhaps unsurprising as small fluctuations in prices can greatly magnify this reading. If we do see another move lower this week, some support is likely to be found around 1040-1050. If this does not hold, then it’s really a "bombs away" scenario with possible support at 1020 or perhaps 980. A 50 % retracement between the March 2009 lows of 666 and the April highs of 1220 is 944, so that may well enter into investor calculations going forward as a downside target. I don’t quite see us breaking below 1040 this week, but the planetary climate is nonetheless dangerous and I would not rule anything out. The Mars-Jupiter-Uranus combination early in the week is very powerful and while it suggests speculative bullishness, it is not inconceivable that the prevailing Saturn-Neptune-Uranus background energy could end up reversing the polarity of the whole thing. If we did see a big down move below 1000 early in the week, then 1040 would become significant new resistance. But from where we are now, major resistance is still at the 200 DMA at 1106, although now the market would have to face down 1070-1075 first. Above that, 1130 is another significant level of resistance as it constitutes a 50% retracement from the April high to the May intraday low. This also roughly corresponds to the falling trendline from the May highs. If the bulls manage to take the market back over the 200 DMA at 1106 it will force a significant short squeeze which may see the S&P climb to 1130 in no time at all, perhaps higher towards the 50 DMA and 1150 which would constitute the proverbial right shoulder of the head and shoulders pattern dating back to January. If this does happen, it will not significantly change the outlook for stocks this summer as the medium term indicators still look quite bearish.
 This week begins with a bang as Mars moves into aspect with the Jupiter-Uranus conjunction. Jupiter and Uranus are by themselves positive influences which have the capacity to move prices by a large amount in a short time. The Mars dimension here will energize this pairing even more so we should look forward to heavy volume and volatility on Monday and into Tuesday. I would also expect a significant price move although I am unsure of the ultimate direction it will take. I am generally bullish for the week and on the face of it this trio should bring buyers back. Perhaps we get a surprise announcement from the G20 over the weekend. So that would be my favored scenario: a gain Monday but with a possible negative open. Another very real possibility would be a major gain right from the opening bell that erases Friday’s loss. At the same time, I do not want to rule out a down day, and maybe a big one. Anything is possible here. If Monday is higher, then Tuesday perhaps has a greater chance of a decline on profit taking as Mercury forms an aspect with Saturn. Wednesday looks more positive again as Venus enters Cancer and Mercury approaches its aspect with Jupiter-Uranus. Thursday also has the potential for gains, especially in the afternoon as the Moon conjoins Mercury in Taurus. Friday looks more bearish, however, as Mercury will form a lesser square aspect with Mars. Aside from Monday’s ambiguous outcome, Friday appears to be the most negative day of the week. Assuming the bottom doesn’t drop out of the market on Monday, we should finish higher for the week.
 Next week (June 14-18) is likely to begin positively on the Venus aspect to the Jupiter-Uranus conjunction. This is another powerful trio and one that seems more unambiguously bullish than Monday’s similar alignment with Mars. The possible problem here is that the aspect could complete a little too soon for US markets to enjoy the benefit. So we could see the positive effects of this alignment fade very quickly, however, even on an intraday basis. Sentiment will likely turn sour by the close or at the latest Tuesday. As if to underline the danger lurking here, Mars aspects Pluto on the same day so we should not rule out a major move down early in the week. On Tuesday, the Sun also enters Gemini and hence sets up its potentially damaging aspect with Saturn. This Sun-Saturn square comes closest on Friday the 18th but it is nonetheless going to act as a drag on the market mood throughout the week. Overall, this week looks bearish. So in the near term, we could see an interim high formed sometime between the 10th and the 14th with declines more likely after that. The following week (June 21-25) looks more mixed although with Mercury squaring Saturn on the 23-24, it is hard to be optimistic about the outcome. Then the end of June and early July look more clearly bearish as the Sun conjoins Ketu in minor aspect with Mars. With the lunar eclipse happening on the 26th, this is a bad configuration and could send stocks down sharply again. It seems very likely that the market will have broken below 1040 by this time, and it could well be closer to 980. Let’s first see what Monday’s super-charged Mars-Jupiter-Uranus pattern brings. It could spark a major relief rally back to 1130-1150 or it could single-handedly create a new range between 980 and 1040.
5-day outlook — bullish SPX 1100-1130
30-day outlook — bearish SPX 980-1040
90-day outlook — bearish SPX 850-950
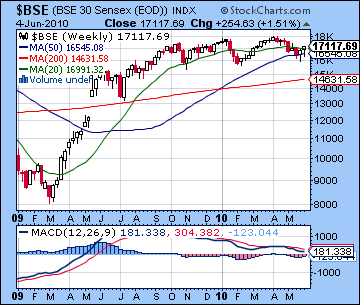 Stocks in Mumbai gained more than 1% last week as positive economic prospects outweighed ongoing Eurozone worries. After closing below 5000 on Tuesday, the Nifty rallied to close at 5135 on Friday with the Sensex finishing the week at 17,117. I had been more bearish here on the expectation that the Mars-Saturn aspect might trigger a deeper pullback early in the week. While I was correct is highlighting Monday-Tuesday as negative, the decline was not huge although we did close below the 200 DMA. I was also mostly on the money in anticipating late week strength as prices rose from Wednesday to Friday. This was perhaps a lesson in the greater resiliency of the Indian market compared with other equity markets around the world. India continues to outperform most other markets during this correction no doubt related to its superior growth prospects going forward. That said, the current planetary alignment remains troublesome and investors need to exercise caution. Saturn is still just two degrees away from its opposition aspect with Uranus and that will be a continuing source of instability in global markets until at least late July. Saturn will also form a tense aspect with Neptune on 27 June — just one day after a lunar eclipse. Eclipses can be disruptive events and the close proximity of this Saturn aspect is not especially supportive of economic confidence and higher prices. The last eclipse pairing occurred in January at the time of a significant correction and the fact that the two eclipses fall in the middle of a series of very tense planetary aspects greatly increases the likelihood of declines over the coming weeks. Adding to the tension will be the Uranus retrograde station on 5 July. Uranus is a planet of energy and sudden change and its reversal in direction can often correlate with changes in trend. Readers will recall that the previous Uranus direct station on 1 December coincided exactly with the beginning of the current rally in the US Dollar and the swan song of the Euro. Given this reversal of Uranus occurs opposite Saturn, we should expect similarly fundamental shifts in the financial terrain. If markets are falling up to that time, then it could well mark the beginning of a relief rally.
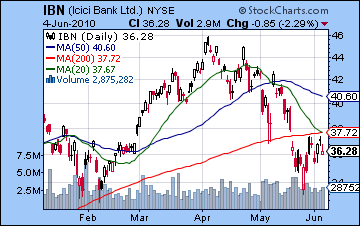
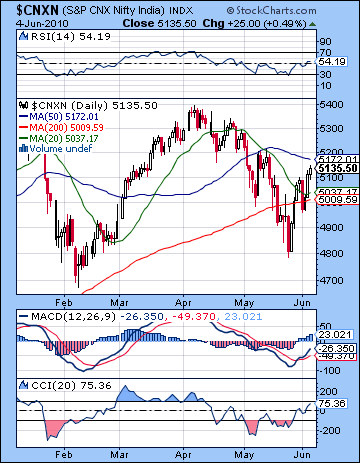 The technical picture has improved considerably over the past week. Despite one close below the 200 DMA, prices nonetheless rose back above that level and closed near the 50 DMA (5172). This was an important display by the bulls as they made a convincing case for higher prices in the near term. Other factors support the notion of improving technicals. Daily MACD is in a bullish crossover although it is still below zero. CCI (-75) is now climbing out of the negative area and may be moving into the bullish zone above 100. Moreover, it is in a positive divergence with respect to a previous peak formed on 26 April. Prices are currently lower than they were on that date but the CCI is actually at a higher level. And after forming a bullish double bottom, RSI (54) is climbing in the bullish area. Volume was also strong on up days as Wednesday’s advance came on 29,000 with Thursday’s follow through gain occurred on a decent volume of 22,000. These indicators generally point to continued strength in the short term. However, the medium term view remains decidedly bearish. The weekly MACD on the Sensex chart remains in a bearish crossover and is stuck in a negative divergence. The chart of ICICI (IBN) is also looking quite fragile and since it is a financial stock it may provide a clue for the future direction of the markets as a whole. While Friday’s down day in New York made this chart worse than India-based stocks, it is nonetheless under performing here as it trades below its 200 DMA. Volume was iffy here, however, as that tell tale bearish sign is evident here again as up days tend to come on lower volume and down days see a spike, as on Friday. In the event of further advances, resistance is likely around the 50 DMA at 5172. This roughly coincides with the downward trend line from the previous tops in April and May which sits at approximately 5200-5250. Interestingly, this also matches the bottom of the rising wedge that connects the July 2009 and January lows. With these three indicators converging here, this level will likely be a very significant resistance level. Above that, we can see that 5300 may also bring in more sellers as that would complete the bearish head-and-shoulders pattern dating back to January 2010. While the lows are not exactly equal, they are still close enough so we should see how the right shoulder may complete itself in the days and weeks ahead. Support remains around the 200 DMA (5009), although as we’ve already seen, breaches of that line do not spell immediate doom. Below that, the previous low of 4800 will be important in terms of limiting any possible downside damage. If 4800 is broken, then we could see 4500 quite soon thereafter. I don’t expect this for another few weeks, but it is something to be aware of.
This week is likely to see swings in both directions with a bullish bias. The overall tone of the week may be set on Monday and Tuesday as Mars aspects the Jupiter-Uranus conjunction. Jupiter and Uranus are normally bullish planets that would tend to encourage speculation and risk-taking but Mars’ influence here creates more uncertainty. A big move in either (or both!) directions is therefore possible. Certainly, there is a possibility that Asian markets may play catch up on Monday with the selloff in the US and Europe and head sharply lower. Still, there is still some reason to think this could lead to gains, even significant ones. We could see a move of greater than 2% on the upside. Tuesday looks less positive as Mercury aspects Saturn. This bearish outcome is somewhat more likely if Monday has been an up day. Venus enters Cancer on Wednesday and therefore comes under the growing influence of Jupiter. This may also be supportive of buyers in a modest way. Thursday seems more clearly positive as Mercury will form an aspect to the Jupiter-Uranus conjunction. Friday may run into troubles, however, as Mercury enters a minor aspect with Mars. I doubt this will see a major decline but it may be as large as 1-2%. If we exclude Monday, the week looks quite bullish with perhaps only one down day. Monday therefore will determine the week as a whole and to what extent the market can reach the 50 DMA. If Monday is higher, then there is a very good chance we will reach 5172 and probably 5250. But I have my doubts that Monday will be positive so it is best treated as a wild card. We could almost as easily be down 3-4% with the market spending the rest of the week trying to eat away at those losses.
 Next week (June 14 -18) is likely to begin positively as Venus forms a nice alignment with Jupiter and Uranus. This could be strong enough for a decent gain of 1-2%. Tuesday may well see a sharp reversal lower, however, as once past exact, these benefic planets often leave a hangover. It is also noteworthy that the Sun enters Gemini on Tuesday. This will thereby create a difficult configuration of crisscrossing square aspects with Saturn, Uranus, and Jupiter. It will also form an opposition with Pluto. The Sun-Saturn aspect may well be the most significant aspect here and that will begin to form on Friday the 18th. Overall, this looks like a bearish influence that may erase some or all of the gains that might occur in the previous week. The following week (June 21-25) seems mixed as we will see a positive Sun-Jupiter aspect midweek and then Mercury joins Saturn once again and sets off the larger alignment. We could see some consolidation at the end of June and early July as the Sun and Mercury conjoin Ketu in quick succession. July may see another rally attempt but this is unlikely to last too long, perhaps two to three weeks. Watch for sentiment to head south once again by late July and into August. This is where we are likely to see the biggest declines of the year. No matter how high we may climb in June — whether to the 50 DMA or higher — August and September are likely to take the Nifty back down sharply, perhaps down to 4000.
5-day outlook — neutral-bullish NIFTY 5100-5250
30-day outlook — bearish NIFTY 4900-5100
90-day outlook — bearish NIFTY 4300-4600
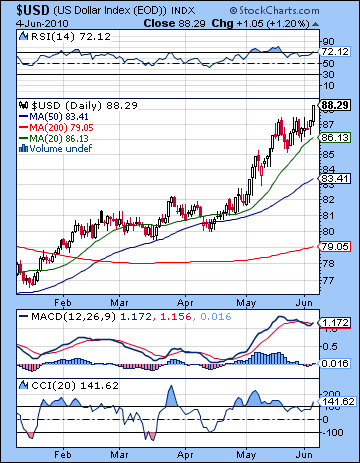 As Hungary filled out its application for Club Med, the US Dollar continued to have its way with the Euro rising to over 88. I jumped the gun with my forecast for a Dollar pullback last week expecting that the Euro might stabilize with the coming of the Jupiter-Uranus conjunction. As it turned out, Mars had more of a say in the proceedings through its aspects with Saturn and then Neptune as the Dollar became a safe haven play especially on Friday. I had thought we would only see 88 in the second half of June but it seems as if the Dollar has gone parabolic amidst the financial turmoil that is settling in for the medium term. The technicals got a boost from the late week surge but there is still reason to expect some weakness going forward. Daily MACD is in the beginning of a crossover, but it is showing a negative divergence. CCI (141) is again clearly bullish and points to higher prices although there, too, we can spot a negative divergence with the series of falling peaks. RSI (72) is bullish but again its lower peak here does not match its previous peak and therefore reveals a vulnerability. Support is likely first encountered near the 20 DMA at 86. Even if we happen to see some financial disaster unfold on Monday that sends traders to the Dollar, I would expect a pullback to that line in the next week. If Monday is positive for equities, then we could see this support tested that much quicker. The 50 DMA may provide the next level of support around 83-84. Resistance is likely close to current levels since they match the highs we saw near the periods of greatest turmoil in March 2009 and October 2008. Monday could see a brief test of those highs followed by a sharp reversal down.
This week looks mostly bearish for the Dollar as Monday’s Mars aspect to natal Saturn in the USDX chart is more likely to correspond with losses. This is not a certainty, however, and so we should allow for other outcomes on that day. Tuesday looks positive on Mercury’s aspect to the natal Sun so that could offset much of any negativity we see Monday. Wednesday and perhaps Thursday look bearish again as Mercury aspects natal Saturn so some kind of pullback to the 20 DMA seems more likely here. Friday may well be positive as Venus approaches an aspect with the natal Sun. I am expecting the Dollar to rally again next week as the Sun enters Gemini although it may not climb back to its current level. Transiting Saturn (4 Virgo) is aspecting the natal Sun (4 Scorpio) over the next two weeks so that may act as a drag on sentiment. The Dollar may trade mostly sideways between 84 and 89 between now and July 23. After that, it will likely start another significant up trend into September that could well exceed its 2008 highs and then some. I would not be surprised to see it rise above 100. Watch for a swan dive as we move into November and December.
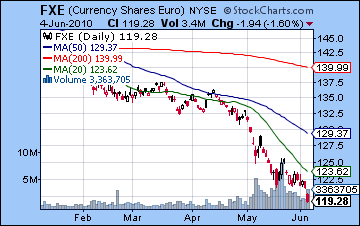 The Euro remained persona non grata in the currency markets last week as new fears surrounding Hungary’s debt forced it below 1.20 for the first time since 2006. While I thought we could see 1.20 breached, I thought it would occur earlier in the week on the Mars-Saturn aspect. The Euro was bearish early but it was also bearish late with the biggest decline coming Friday as Mars was still sitting on the 12th house cusp representing loss. While the technicals are bad, there are still signs of a rebound as negative momentum may be abating. Daily MACD is in a slight bearish crossover but there is nonetheless evidence for a positive divergence. CCI (-162) is very bearish here as is RSI (27). But we can see that RSI is making a higher low than the previous low so this may augur more positively in the future. Friday’s volume was quite high so that’s a clear bearish sign, but it’s worth noting that it was still lower than the up volume in the relief rally in May. Even if some of these daily indicators might point to some kind of bounce, the weekly indicators are still awful and suggest the Euro will stay in pretty bad shape for weeks, if not months, to come. But a bounce, dead cat or otherwise, could take it up to the 20 DMA around 1.23 very quickly given the extensive shorting going on and the likelihood of a squeeze. I would not be surprised to see that this week. After we have a rebound ending perhaps around June 14, there will likely be more selling towards the end of June. The lows we’ve seen here may well hold for a while but the Mars-Saturn conjunction at the end of July is likely to mark another major move down going into the fall. The Rupee lost ground in this uncertain currency climate as it closed at 47.3. Strength should return this week with a move back below 47 possible.
Dollar
5-day outlook — bearish-neutral
30-day outlook — bullish
90-day outlook — bullish
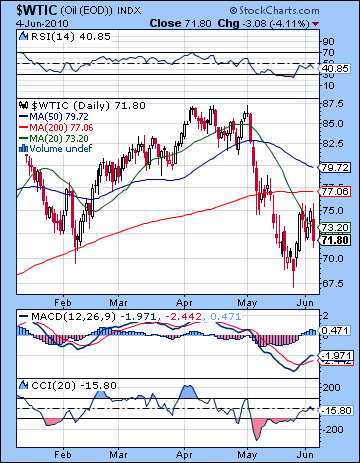 After some bullish moves midweek, crude oil fell back down to earth on Friday as it closed below $72 on the continuous contract. I had expected a little more staying power from the midweek up move but neglected to give proper consideration to the bearish effect of the Mars transit (4 Leo) to natal Ketu (4 Sagittarius) late Friday. Certainly, Tuesday saw the expected pullback on the Mars-Saturn aspect and then crude moved to $75 after Thursday’s close. This still did not seriously challenge the 200 DMA at $77 and when there was an opportunity to sell on bad economic news, crude sold off big. The technicals are basically short term bullish but medium term bearish here. Daily MACD remains in a longer term negative divergence with its lower low in late May and this suggests that crude will go lower in the coming months. But we can also see a bullish crossover here which augurs more positively for crude in the short term. CCI (-15) is also trending higher while RSI (40) is slowly improving. RSI is still trapped in a medium term series of lower peaks which does indicate higher prices through the summer but it does not preclude a rally in the coming days. Not surprisingly, the weekly chart looks quite weak as major indicators all point to the probability of lower prices. It’s worth noting that volume on Friday’s selloff for the USO ETF was actually quite muted and less than the volume for the preceding up day suggesting that we may be past the panic selling we saw earlier. Support is likely still around the $70 level with backup provided by the previous low of $68. Beneath that, $60 might figure into any deeper corrections we may see down the road. Resistance is still formidable near the 200 DMA at $77. Since crude has yet to properly test this line, there is a reasonable chance this will occur before bulls throw in the towel. Above that, the 50 DMA at $79 would likely induce more sellers to escape the market in the event of any short lived move higher.
This week crude may move higher as benefic Venus enters the 2nd house of wealth in the natal chart. While Monday remains a question mark with a possibility of a big move in either direction given the Mars-Jupiter-Uranus combination, the placement of Venus (28 Gemini) very close to this favourable house cusp (29 Gemini) is one reason to tilt towards a bullish outcome. The Moon is also transiting Pisces in the 11th house of gains, so that is another positive, if minor, indication. On the bearish side, transiting Mercury (2 Taurus) forms a minor aspect with natal Mars (2 Aries), so that may introduce some measure of difficulty and selling, at least on an intraday basis. Tuesday could be negative as the Sun forms a 135 degree aspect with the Moon-Saturn conjunction. If we see a significant gain Monday, then Tuesday will be a day of profit taking. Wednesday and Thursday look more bullish although there may be weakness entering into the equation late Thursday and building for Friday as Venus will come under the malefic aspect of natal Mars. Next week looks more mixed with a possible gain Monday the 14th but selling more likely after that. So we are likely to see a move higher before prices move below support into late June and early July.
5-day outlook — bullish
30-day outlook — bearish
90-day outlook — bearish
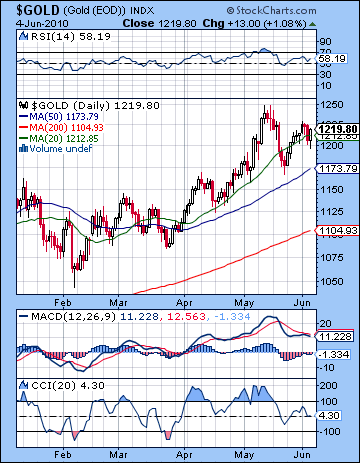 As the financial world increasingly resembled a bad disaster movie last week, gold retained its safe haven status as prices edged higher closing at $1219. I had been more bearish here as I thought any down move might hold and pave the way for a greater correction and perhaps a retest of the May low and the 50 DMA. While we did see a two-day decline midweek as I thought we might, it wasn’t as deep as I had hoped. Then Friday’s rally came along and provided a boost back up to the old 2009 high of $1220. As maddeningly bullish as gold has been, all of this is part and parcel of the long term bull trend in gold that we’ve seen since 2008. It is hard to argue with the bullish stacking of all three rising moving averages. And yet we can still discern signs of weakness. Daily MACD remains in a bearish crossover despite this recent run-up while it has been essentially flat. CCI (4) is stuck in the middle range now after spending a long time in a bullish zone. RSI (58) may be moving higher but from a medium term perspective remains in what looks like a falling trend. After closing slightly below the 20 DMA on Thursday, Friday’s rally pushed prices back over the 20 DMA. I would think that unless gold can break above its June 1 high of $1225 in the near term, it will be ripe for correction. We can see that while Friday’s rally was strong, it did not quite match Thursday’s opening price. This may be a clue that buyers may be having more second thoughts. Any pullback we might see will likely retest the 50 DMA at $1173.
This week looks mixed to bearish for gold as the probable stock market rally may make it less attractive as a safe haven play. Monday itself looks mixed as the Sun sets up in a tense aspect with natal Ketu in the GLD chart while Mercury makes a more positive aspect with natal Venus. The Sun opposes natal Mercury on Tuesday so that may be somewhat positive. On Wednesday, Venus enters Cancer so this could conceivably change the prevailing short term trend. With transiting Mars coming under the aspect of natal Rahu at the end of the week, any early gains will likely disappear by Thursday or Friday. Depending on what kind of volatility we might see Monday, look for weakness to accrue through the week. We could see a test of $1173 this week or perhaps next week at the latest when the Sun enters Gemini and receives Saturn’s aspect. The Sun’s transit of sidereal Gemini from June 15 to July 15 is likely to correspond with a significant correction in gold that may well break below the 50 DMA. We should note that Venus enters Leo on July 5, so that could mitigate the down trend and indeed initiate a rally for a few weeks. This is unlikely to be very strong and may only make a partial retrace from the May high. The next move down in gold will likely commence in August when Venus has entered Virgo with Saturn. This appears to be a steeper correction than anything we might see over the next three weeks. September and October look highly volatile for gold with large moves possible in both directions. My guess is that it will start to trend higher towards the end of this period as it prepares to move significantly higher for 2011.
5-day outlook — bearish
30-day outlook — bearish
90-day outlook — bearish

