- US Stocks look mixed this week with bearishness increasing by early August; Indian stocks more bearish this week with major correction looming by early August
- Dollar unlikely to rally until July 23; strength returns in August and September
- Gold negative to start the week but recovery later; steep decline likely by early August
- Crude mixed this week with uncertain outlook for August
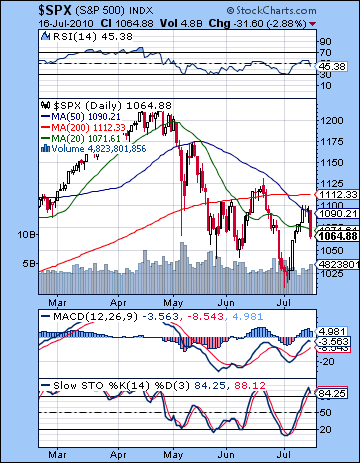 Despite some early enthusiasm for Q2 earnings from Intel, stocks stumbled into Friday’s close as the earnings from several big names came in lower than expected. Bulls tried three times to move above resistance levels of 1100 (Dow 10400) but failed each time. The S&P finished Friday down 1% for the week at 1064 while the Dow closed at 10,097. My more bearish scenario came to pass here as the early week Venus-Jupiter-Pluto alignment yielded predicted gains that took the market up to resistance of 1100, very close to the 200 DMA at 1112. I had thought the best day of the week might be Monday on the Moon-Mercury pairing but it turned out to be Tuesday. Nonetheless my expectation for net positive near 1100 by midweek was on the money. I had been uncertain if Wednesday was going to see any follow through on the upside since the nice Venus influence was ebbing although the Moon was offering to act as a temporary jumper cable. As it happened, we got another EOD ramp job that took us back towards resistance. Things started to turn south after Thursday’s Mercury-Ketu aspect that produced a lower low intraday, although with yet another EOD-induced doji, thus setting up Friday’s belly flop. The most pressing question concerns whether all the bullish payload of the Jupiter-Pluto square has already been delivered or whether we could see some more upside ahead of the precise aspect on July 25. Certainly, this aspect combines two positive energies so we need to allow for more rally days but whether 1100 can hold seems less clear. What is required is a fast moving trigger planet, as Venus was last week. The Sun may serve that purpose here as it approaches its trine aspect with Jupiter late this week and early next week (exact Monday July 26). But the good vibes from this combination may be short-circuited by the approaching Mars-Saturn conjunction which may be strong enough to trump all other concerns. Recall also that the exact Saturn-Uranus opposition also occurs on July 26 and that is unlikely to be kind to the bulls. Perhaps the last gasp for Jupiter’s optimism will lie ahead of its retrograde station in the early morning hours of Friday July 23. In any event, this upcoming alignment of Jupiter, Saturn, Uranus, Neptune and Pluto is not to be taken lightly and represents a significant crash opportunity. The market technicals are sufficiently vulnerable to make a crash more plausible and the astrology likewise sees a greater than normal chance for a major swan dive. A lower low (below SPX 1010) could well spark a rush to the exits in the coming days that could provoke the market to blow through technical support targets such as 975 or even 920. Please note that I am not saying a crash is likely, but that the chances of it happening now are much higher than normal. Even if we don’t crash in the next two weeks, the down trend is likely to continue well into September at least.
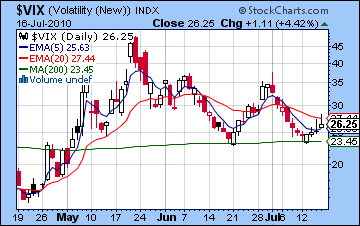
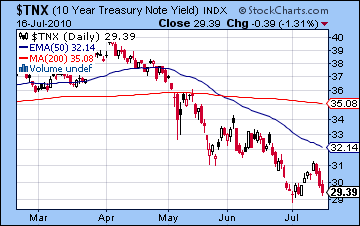
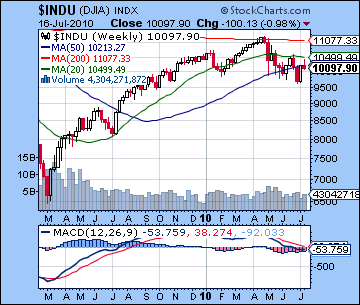 With the bears successful defense of 1100 last week, the bullish case looks to be in deep trouble. The inability to close above 1100 and the falling trend line off the April high revealed an unwillingness to take prices higher. Volume in this 8-day rally was weak suggesting a lack of conviction and skittishness while Friday’s decline corresponded with a bearish rise in volume. Bulls may therefore be quick to push the eject button in the event of a breakdown of previous lows. The bulls can at least point to a bullish divergence on the daily MACD with respect to the June 21 high. RSI (45) also shows a bullish divergence although it has now slipped into bearish territory. The 50-day EMA is now actually rising which might signal a rising trend. The irony there is that a rising 50 day EMA actually qualifies as a Hindenburg omen that foretells an imminent crash. According to historical studies of the market, a crash or large decline required a rising 50-day EMA within 120 days of the start of the decline. More immediately worrying, however, is the Stochastics (84) are now overbought and pointing lower. A new move lower is therefore indicated with lots of room to run. The $VIX (26) is still at fairly low levels here and we still do not yet have a 5/20 crossover that would correspond to a deeper move lower in equities. That is something to watch for this week. Meanwhile, treasury yields resumed their downward direction as the 10-yr again closed below the crucial 3.10% level. The fact that yields starting falling on Wednesday two days ahead of equities is an indication of rising fear in financial markets and points towards a larger move lower. The weekly MACD is still in a bearish crossover on the Dow chart. Resistance seems fairly strong at 1100 as 1130 looks increasingly unlikely here. I would not rule out another test of 1100 this week although much will depend on Monday. If it closes higher, then a midweek rally could well take the S&P back to last week’s highs. This is perhaps the more bullish scenario. If Monday is lower, then support may come in around 1040-1050. With the market looking fairly precarious here, however, support levels are perhaps more elastic and undefined. Certainly a break below 1040 might hasten a retest of the July 2 low at 1010 but I doubt we will see that this week.
 This week looks mixed as we can see both bullish and bearish influences over the coming days. Mercury forms a minor aspect with Pluto on Monday which may be initially bearish but an intraday reversal higher is also possible. I would nonetheless think that we will begin the day on more weakness. Tuesday will feature the entry of Mars into Virgo. This is a key ingredient in the next down leg since Mars will occupy the same sign as pessimistic Saturn. With Virgo suffering from this double affliction for the next few weeks, we can expect increase stresses on analytical systems in general. Virgo is a sign that represents analysis and rules so Mars and Saturn may act to subvert attempts at rational understanding. Information and knowledge will be increasingly disrupted under these transits. More immediately, this transit makes a decline on Tuesday is more likely although I would not say it is probable. The midweek looks more favorable as Venus is aspected by Rahu. This could correspond with a rally higher as speculation is more likely. Sellers may return later in the week as the Sun enters into alignment with Saturn. If Monday closes much lower, then the week may end near flat. But if we get a reversal higher on Monday, there is a good chance that the midweek rally (which could even begin Tuesday) could take us back up to 1100. The Thursday-Friday selloff would then take the S&P back down into the 1060-1080 range. I should point out, however, that the high density of planetary aspects here make the intraweek trends a little tougher to discern. Given the entry of Mars into Virgo, a bearish stance is probably the most prudent although one that is fully prepared to accept another run to 1100. If anything, rallies at this late stage are just another opportunity to exit long positions and enter new short positions.
 Next week (July 26-30) is really "show and tell" time as Mars conjoins Saturn on Saturday the 31st. The final Saturn-Uranus aspect occurs on Monday the 26th and that could set the tone for the next big move down. Monday should therefore be lower. Again due to high aspect density, I do not want to cut this too fine as declines are possible on any day. That said, I think larger declines are more likely later in the week, especially Friday. How low we go is impossible to say. I would be very surprised if we didn’t break below 1040 here and even 1010 looks like a fairly bullish scenario. If we break through 1010, then 975 will arrive quite soon, as might 920. Since we’re in a potential crash mode here, most of the damage could occur over two days, say perhaps 10-15%. Friday the 30th and Monday, August 2nd stand out as the more likely times when we could see a large move down. Some bounce is likely the following week and into mid-August but likely nothing very large — perhaps on the order of recent bounces — 5-10%. Then mid to late August looks like another significant move lower going into Labor Day. September looks quite bearish with selling likely accelerating into the end of the month. We could make a significant interim low anytime between September 7 and October 7, although I would tend to think October will be lower. So a more bullish scenario would be a retest of 1010-1040 by early August and then a bounce back towards 1100 by mid-August followed by a sharp decline below 1000 by Labor Day and then 920 by October. A more bearish (and more likely) scenario follows the same rough pattern but at levels that are perhaps 10% lower. As markets move sharply lower, this will increase the chances of intervention by the Fed. Bernanke has already noted they are considering possible QE2 plans in the event of another slowdown and bears need to be prepared in case this is deployed. In all likelihood, markets would have to be severely broken before panic sets in and the economy falters further. Another infusion of Fed money may occur shortly before or after the midterm elections, depending on what the market is doing and how the Democrats are doing. At this point, I think November is the most likely time when we might see QE2 although I would not rule out October either. QE2 will likely boost stocks in the anticipation of more inflation and thus weaken the Dollar and Treasuries.
5-day outlook — neutral SPX 1040-1080
30-day outlook — bearish SPX 1000-1040
90-day outlook — bearish SPX 800-900
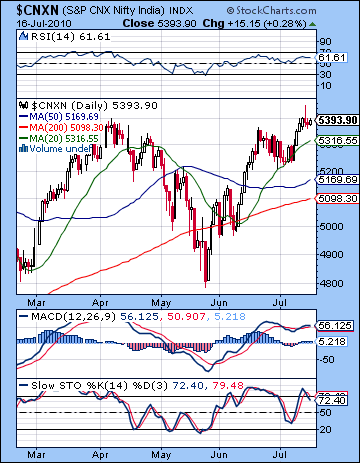 Stocks in Mumbai edged higher last week as positive earnings continued to trump worries over the global financial environment. After briefly climbing above 18k midweek, the Sensex closed Friday at 17,955 while the Nifty finished at 5393. This bullish result was largely in accordance with expectations as the early week Venus-Jupiter aspect provided the necessary lift to make new highs for the year. Admittedly, these did not last long as Wednesday’s spike above resistance levels was wiped away by the close. Nonetheless, we did see the Nifty make its highest close for 2010. I had expected at least two up days with a question mark about Wednesday given the weakening effect of Venus and we saw stocks rise 0.6% Monday and another 0.3% Tuesday. Wednesday’s spike was perhaps further evidence of Venus-Jupiter although it failed to hold. As predicted, stocks were generally weaker later in the week on Mercury’s aspect with Rahu although Friday eked out another gain. All told, the Jupiter-Pluto aspect is offering comfort to bulls thus far in July in establishing a safe harbour around the more troublesome Saturn influences that lurk in the shadows. Jupiter (wealth, optimism) is therefore currently interacting with Pluto (power, large organizations) so we may see further attempts by major financial institutions to address ongoing concerns about the viability of the current economic regime. This aspect becomes exact on 24 July so we should expect this mostly positive energy to prompt more rallies attempts between now and then. That said, the skies are rapidly darkening here with the Saturn-Uranus opposition due on 26 July so any gains may be increasingly limited and short-lived. This latter aspect is one of the key sources of bearishness for the second half of 2010. And while I think there is a good chance of declines to occur very near if not actually on July 26, it’s important to also note that this aspect may act as a trend marker so that it will usher in a new mood in the market. Saturn inclines towards caution and pessimism while Uranus symbolizes risk taking and freedom. As previously noted, this is like mixing oil and water. The results are rarely positive as Saturn usually wins this battle and takes prices lower. This is perhaps more likely on this occasion due to afflictions in the Indian independence chart. In the coming days, transiting Saturn (6 Virgo) and Uranus (6 Pisces) will form a tight t-square aspect on Mars (7 Gemini) in the 2nd house of wealth in the Indian national horoscope. This suggests disruption of normal commerce and a probable loss of national wealth. Of course, Mars is also a planet of violence and disputes, so we could see something along those lines as well. Given the overall market picture, however, the chances for significant financial turmoil are fairly high.
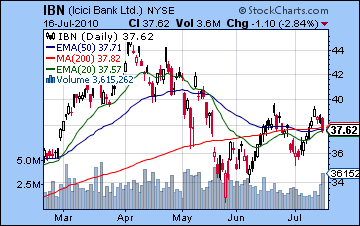
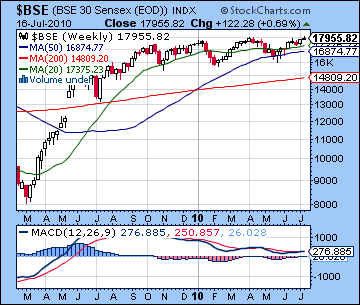 Despite the new highs last week, the technical picture did not take a significant step forward. Highs occurred on relatively low volume (16k) on the Sensex and that was largely the case throughout the week. Bulls have become fairly cautious suggesting that those who are bullish are already in the market while few are sufficiently pessimistic to sell. While price trumps everything, these highs have not been sufficiently confirmed to suggest the beginning of a new leg higher. We can see that the Nifty is in rising wedge here with support at 5350. This is a bearish pattern, however, that usually resolves with a waterfall downward although it is conceivable that prices may bounce higher once more off support. Of course, bulls can properly point to a trio of rising moving averages in the 20, 50 and 200 DMA. They are the very picture of bullishness and provide significant support in the event of a correction. After 5300-5350, the 50 DMA at 5169 might bring in more buyers although we should note it failed to do so in May when it was violated on the way down. A better level to defend might be the 200 DMA at 5100. This did successfully catch prices in a previous interim low. The bears have at least an equally compelling case as we can see a negative divergence in the Nifty’s daily MACD with respect to the high of 21 June. Prices have risen since then, but MACD has fallen. This is bearish. Similarly RSI (61) also exhibits a negative divergence with respect to the previous high. Stochastics (72) are falling after being oversold last week and are strongly hinting at a major move lower. MACD and RSI on the weekly BSE chart remain in a clear negative divergence and bearish crossover. This is perhaps further indication of the weakness of the bulls going forward. As a proxy for the financial sector, ICICI (IBN) continues to look vulnerable, especially as Friday’s session in New York saw a sharp selloff. And note the familiar pattern: a big selloff corresponding with a volume spike. Fewer investors are getting interested in this stock on the way up but many more are jumping ship on the way down. Prices are settling in very close to all three moving averages at this point. A break below this level would surely open the floodgates to much lower prices. Overall, the technical picture looks medium term bearish, although somewhat less so in the very immediate short term.
This week looks like a mixed bag as we will see a range of influences. Mars enters Virgo on Tuesday where it will join Saturn for the next six weeks. As a slower moving planet, Saturn’s sojourn in Virgo will last for two years while Mars will stay there only until 6 September. Virgo is a sign of analysis and accuracy, especially pertaining to rules or systems of information so we will likely see greater stress in this area. This could mean that the usual reliable and methodical approaches will no longer work as disruptions will become more frequent. In market terms, we could see players act more irrationally in the coming weeks. Some early week fallout is therefore likely with Monday and perhaps Tuesday looking weak. There is a decent chance of some gains midweek as Venus comes under the influence of Rahu. Venus-Rahu can sometimes coincide with speculative buying, even if it is rarely enduring. Wednesday is perhaps the best candidate for a gain as the Moon will come under Jupiter’s aspect. Declines are again more likely later in the week with Friday looking most bearish as the Moon forms an alignment with Saturn and Uranus. While both gains and declines are likely this week, I would lean towards a negative outcome overall. If Monday is lower as expected, then it is unlikely that we will break above last week’s high. Perhaps the Nifty might finish somewhere in the 5200-5300 range, although that is very much a guesstimate.
 Next week (July 26-30) is show time. After Jupiter turns retrograde on the 23rd and Jupiter-Pluto form their aspect on the 25th and Saturn-Uranus make their opposition on the 26th, the market will likely be increasingly wobbly. There are a high number of close aspects in a short time frame here so calling individual days is harder than usual. The early week looks quite negative though as Mercury forms an aspect with Mars. Sentiment may moderate into the middle of the week somewhat as Mercury forms an aspect with Jupiter and Pluto going into Thursday and perhaps extending into Friday. But the end of the week looks dangerous again as Mars is in a one degree conjunction with Saturn during Friday’s trading session. The close looks more negative than the open as the Moon will move away from Venus and towards the influence of Saturn. So we should see a big move down here, perhaps somewhere between 5 and 10%. It’s difficult to know just how low we might go since these aspects may have a multiplying rather than a simple additive effect. We could well be down more than that, although I would not count on it. The bears will likely continue to rule going into the following week (Aug 2-6) as Venus joins Mars and Saturn in Virgo. Some bounce is likely by the end of this week and the next week also. This looks to be a fairly modest rebound and is unlikely to return the Nifty to its July high. More weakness is likely starting around 12 August and this should be another big decline of at least 5% over two days. The market should trend lower going into early September. Another low is possible in late September and it looks like it will be a lower low. By that time we could be somewhere between 4000 and 4500 on the Nifty. Much will depend what kind of decline we see in the next two weeks. It is possible we could have a crash-type event in late July or early August and if that comes to pass, then price targets in September will be correspondingly lower.
5-day outlook — bearish NIFTY 5200-5300
30-day outlook — bearish NIFTY 4800-5000
90-day outlook — bearish NIFTY 4000-4500
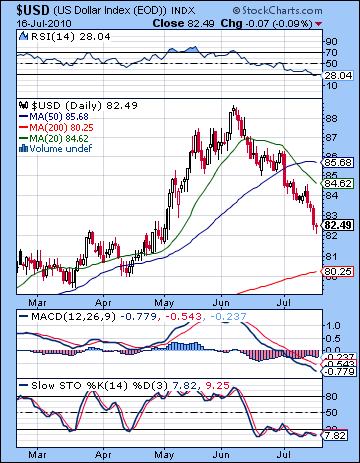 Investors continued to bail out of the Dollar last week as it closed below 83 and broke through some critical support levels. No surprise really as I had fully expected the losing streak to continue as long as Saturn was casting a shadow over the Dollar’s horoscope. We seem to be an uncharted waters here as it broke below the rising trend line off the December low and now appears to be falling in accordance with a nasty declining channel off the June high. What’s more the usual inverse relationship between equities and the Dollar has been coming apart since June 21. As pessimism grows over the outlook for the US economy, both the Dollar and stocks fell last week. This could be a sign of things to come, although I suspect the flight to safety play will kick back in when the next phase of this de-leveraging gets underway. From a technical perspective, the Dollar is in deep trouble. Not only is it locked in a falling channel, but the 50 DMA is now turning lower. Daily MACD is still in a seemingly endless bearish crossover and negative divergence. The RSI (28) is thoroughly bearish while Stochastics (7) are mired in the subterranean oversold area. Volume is still fairly average suggesting an orderly retreat, however. The weekly chart still shows a nasty bearish crossover though, so the Dollar does not look too healthy in the medium term. This does not preclude a rally but it does suggest it may not have any staying power.
This week looks like another bummer for the Dollar although the late week period looks somewhat more optimistic. As a result we could see an interim bottom put in this week ahead of the Jupiter retrograde station on Friday. Once Jupiter turns retrograde it will increase its influence on the Sun-Saturn conjunction in the natal chart and this should lead to a rally. The week as whole could still be negative overall, although there is some hope for a flat outcome. Some late week strength is possible, although it does not look particularly impressive. Next week may see some stability to the Dollar although I have to admit I cannot discern a big rally just yet. This is somewhat troubling given the probable battering that stocks will endure here. Perhaps the flight to safety will not occur in this early phase of this down leg. The Dollar looks significantly stronger in the first week of August, however, so perhaps we will finally see some traction then. The rally should gain momentum in the second half of August and continue into September. This will likely coincide with a major down move in stocks that sends investors back to safer asset classes and out of equities and commodities. The rally could well go parabolic around Labor Day so we cannot rule out a test of the recent highs at that time. After forming a significant high sometime in September or early October, the Dollar will come back down to earth, perhaps with a thud. The decline may be most pronounced in late November.
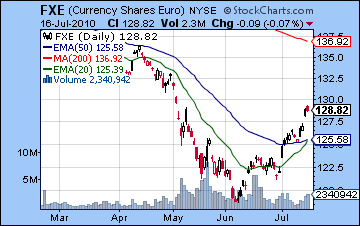 The Euro extended its rebound last week closing just below 1.30. This rally has taken the once forlorn currency all the way back to the falling trend line and some key resistance levels. I wasn’t too surprised by this continued strength in light of activation of natal Jupiter by last week’s Sun-Mars aspect. While the technicals have improved, we note that Friday’s decline occurred on rising volume, a possible warning of an imminent reversal. While prices have broken above the trend line, any pullback may first back test this line at 1.27 before attempting another rally. The bulls can point to the bullish crossover of the 20 and 50 DMA but bears can counter with the larger picture — prices continue to languish well below the 200 DMA which is now falling. These are still bearish indications for the medium term. This week looks mixed although with the entry of Mars into the first house of the Euro horoscope, we can’t be overly optimistic here. Next week looks more decidedly bearish as Mars bears down on the ascendant while Mercury drifts into the 12th house of loss. We could see the beginning of a major trend reversal here and another move lower going into the fall. October looks more positive, however, so another significant rally is likely at that time. Meanwhile, the Rupee lost ground last week closing above 47. I had expected the weakness to manifest towards the end of July so this may indicate the beginnings of a larger move lower. With significant financial uncertainty looming in August, the Rupee may come under increased pressure.
Dollar
5-day outlook — bearish-neutral
30-day outlook — bullish
90-day outlook — bullish
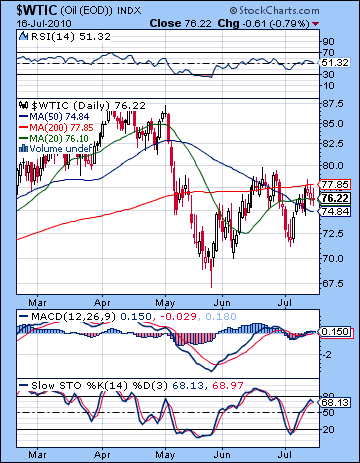 Crude oil ended mostly flat near $76 on the week as economic worries were offset over supply concerns. While I thought we might hang on to more gains, this was not an unexpected outcome. As predicted, the early week was mostly positive as the Moon-Mercury pairing in watery Cancer provided a boost that coincided with Tuesday’s Venus-Jupiter aspect. Wednesday saw crude briefly trade over $78 before reversing lower. The rest of the week was more bearish, however, as the shift from favorable Cancer Moon to a less favorable Leo Moon coincided nicely with ebbing enthusiasm. The technicals look pretty bad right here as last week’s highs were lower than the previous week’s. Also resistance emerged around the 200 DMA ($78) and sparked a reversal lower. The inability of crude to climb above this resistance should not offer much comfort to the bulls going forward. Crude appears to be working through a large triangle pattern with a resolution forthcoming in the near future. Daily MACD is looking pretty weak as the bullish crossover is fading and a negative divergence is showing with respect to the June 21 high. RSI (51) has a similar divergence and Stochastics (68) also looks primed for lower prices in the near term as it has fallen below the overbought zone. In the event of a pullback, bulls will be keenly watching the previous low of $72 and hoping it will hold. If it falls below that level, the sellers will gain the upper hand and take crude lower still. Given the proximity of prices to the key moving averages, there is a real vulnerability here that warrants close attention.
This week looks mixed. Monday does not look too favorable, especially at the open on the Moon-Ketu aspect. But some buyers will likely move in midweek as the Moon enters Scorpio and come under the aspect of Jupiter into Wednesday. We could well see two or perhaps three up days. Thursday is harder to call, although weakness seems more likely in the afternoon. Friday also looks more bearish as transiting Mars aspects the natal Mars in the Futures chart. Admittedly, the end of the week features both positive and negative aspects as Mercury slips into a positive place in the Futures chart but it does not look positive enough to offset the bearish Mars influence. If Monday is sharply lower, then the midweek rally may not be enough to push crude into the green. Nonetheless, I think there is a reasonable chance for a positive week here. It won’t last long, however, as next week will see the Mars and Saturn come together and activate the natal Rahu in the Futures chart. This is likely to spark a major move lower starting on July 26 that will last into August. More downside is likely into October although it will probably not be a straight line down. A significant reversal higher is likely in October and November.
5-day outlook — neutral-bullish
30-day outlook — bearish
90-day outlook — bearish
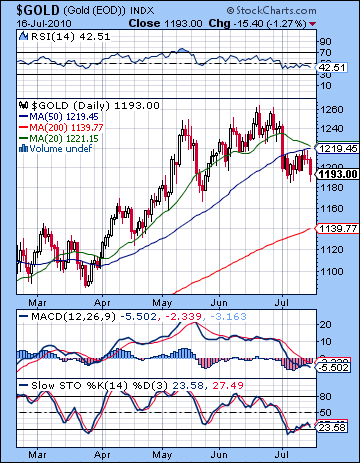 As the threat of deflation became more credible on flagging US economic activity, gold moved lower last week closing at $1193 on the continuous contract. This bearish outcome was underwhelming as I thought we would see more upside in the early week on the Venus-Jupiter aspect. After a down day Monday, prices did rise into Wednesday but topped out just below $1220. The Sun’s entry into Cancer on Friday corresponded with more weakness as bullion finished the week on a down note. The technicals look quite bad here as gold broke below support from the rising trend line dating back to 2008. The bottom of the rising wedge at $1240 did not act as a resistance since it was stopped dead in its tracks at the 50 DMA around $1219. As further evidence of a downtrend, the 20 DMA is now negative and is poised to crossover the 50 DMA in the coming days. Last week’s lows at least provided some hope for bulls as they were higher than previous lows ($1175) thus maintaining the bullish pattern of higher lows even if new highs are not in the immediate future. MACD is in a bearish crossover and is still falling and RSI (42) has entered bearish territory. On a positive note, MACD histogram is displaying a bullish divergence and Stochastics (23) has moved out of the oversold area — albeit in a very unconvincing way — and thus increases the chances for more upside in the days ahead.
This week looks mixed for gold. The Sun now moves further into Cancer where it remains for the next four weeks. It’s negative performance on Friday was perhaps an indication of what lies ahead for gold during the fiery Sun’s transit of this watery sign. The early week is perhaps more bearish. Mars enters Virgo on Tuesday which may give a small boost to gold midweek as Venus will now be free of malefic influences in Leo. The Sun comes under the benefic influence of Jupiter later in the week so that could extend the positive energy although it will still be some distance from the exact aspect. As Mars comes closer to Saturn here, it has the potential to upset other favorable influences so weighing the respective role of each is more difficult. While I would lean to a positive week overall here, I think the upside is limited. And given the probability of a major downturn, this is likely not a good time to be long in gold. Volatility will increase next week with more upside possible but price swings may become larger. The end of next week (July 30) looks more clearly bearish and as Venus enters Virgo for Monday, August 2 so we could see a sharp move lower. And when I say "sharp", I mean something like 5-10% over one or two days. The down trend should stay in place through much of August and into September and could take gold down to $1000. A significant rally is likely at the end of September and into October but this is unlikely to mark a significant new high. Look for a possible interim low in mid-October that will be followed by a major rally into November.
5-day outlook — neutral
30-day outlook — bearish
90-day outlook — bearish

