- Stocks declines likely early in the week on Jupiter-Saturn opposition and towards Friday on Venus-Mars conjunction
- Dollar to continue to strengthen; rally should last into September
- Crude oil likely to weaken further
- Gold vulnerable to declines after Monday; significant correction below $1150 is possible over next two months
 Sentiment crumbled along with the bulls’ hopes for a quick recovery as more bad economic data suggested the smart money was starting to factor in a double dip recession. After Monday’s quiet rise, prices fell for the rest of the week with the big blow coming on Wednesday. The Dow slumped more than 3% overall to close at 10,303 while the S&P finished at 1079. Needless to say, this was a welcome outcome as I had expected trouble from the addition of a weakened Venus in Virgo to the dense melange of aspects currently in play. I fully expected some gains in the early week ahead of Tuesday’s FOMC meeting and Venus and Jupiter did not disappoint. Monday saw a modest gain on low volume (in keeping with the pattern lately) but the reassurance from Fed Chair Bernanke only boosted prices for a grand total of one hour. I had wondered if we might see more selling late in the week with the approach of the Venus-Mars conjunction but that did not quite come to pass. Instead, the big drop came Wednesday, immediately after the departure of Venus from Jupiter’s luxurious lair. As a signal that the worm has clearly turned here, my more bearish scenario was surprisingly accurate: I had expected gains Monday followed by a bleed the rest of the week and then a close below 1080. What’s interesting here is that the interim top at SPX 1129 arrived on Monday, August 9 fully two weeks after the Saturn-Uranus opposition on July 26. I had hoped we might see the top put in closer to that date, or perhaps near the Mars-Saturn conjunction on July 31. As it happens, the top may well coincide with a Venus-Jupiter-Saturn alignment. That is a little surprising, and is definitely cause for further examination. Does this unexpectedly wide margin of error jeopardize my larger hypothesis the market still has another significant leg down left? I don’t think so, as the planets still look quite negative overall albeit with some noteworthy exceptions. As noted previously, the high number of close aspects in play nowadays makes the effects of these aspects blur somewhat so distinguishing their relative impact is harder than it would otherwise be. And we still have the Jupiter-Saturn opposition up coming this week, along with the Saturn-Pluto on August 20. So on the face of it, there seems to be a surplus of bearish energy still to be released before we might see the bulls turn this ship around for a significant bounce in early September on the Jupiter-Uranus conjunction. And then the equinox will be ushered in on a very negative Saturn-Rahu aspect on September 27 that is likely to erase any rebound rally that precedes it.
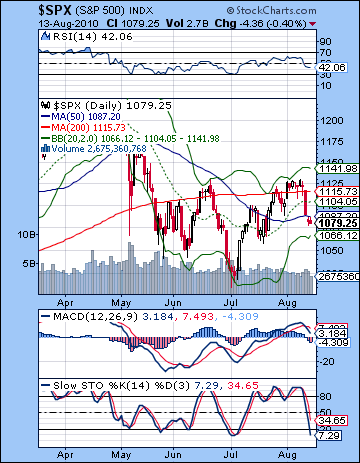
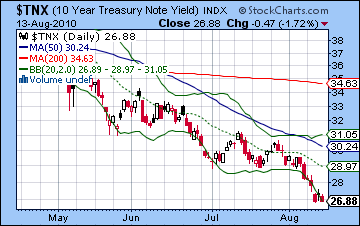
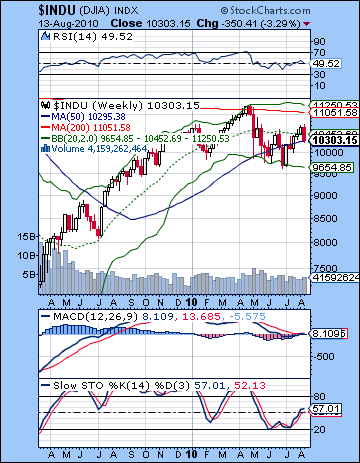 Last week was a huge defeat for the bulls. Not only did they fail again to climb above the previous high of 1131 on the S&P, but the retreat broke through the rising trendline from the July 2 low, the 200 DMA at 1115, the 20 DMA at 1104 and the 50 DMA at 1087. The rejection of all four of these support levels was a home run for the bears as the trend is once again pointing down. It’s worth nothing that Friday’s decline came despite some better than expected data on consumer sentiment, another sign that the bulls have fumbled the ball. When the market falls despite good news, it means the trend is negative. To add insult to injury, Thursday even provided another confirmation of a Hindenburg crash omen as the NYSE saw 76 new 52-week lows (the parameter demands at least 75). Note how the weekly Dow chart shows the 20-week MA now acting as resistance whereas before it acted as support. RSI shows lower lows which suggests that prices will eventually follow. As if to underline the likelihood of a double dip recession and with it deflationary fears, bonds rallied even higher as the 10-year yield made new lows for the year, under 2.70%. How low can they go? Well, 2.7% may not sound like much of a return in normal circumstances, but if prices are falling by 1 or 2% as they did in Japan through the 1990s, then it’s not as bad as all that. The Japanese experience is weighing heavily on markets nowadays as the economy continues to sag despite the best efforts of policy makers to stimulate demand. Japan made similar efforts after their asset bubble burst in 1989, all to little effect as the Japanese economy has underperformed in the 20 years since. Equity markets have been particularly hard hit as the nominal value of the Tokyo Nikkei now stands at less than 25% of its 1989 peak. But back to the S&P. We now have a clear bearish crossover in the MACD, and RSI (42) is bearish and in a negative divergence with respect to a previous July low. Stochastics (7) are now in the oversold area and perhaps that might entice some bulls to buy on weakness in the coming days. Prices are now approaching the bottom of the Bollinger band at 1066, so that area will likely act as support in the likelihood of further downside probing. The previous July low of 1056 is significant here as the bulls will need to defend this level in order to prevent the bearish scenario of lower lows from taking root. In this respect, it is conceivable that this move lower could be arrested around 1060 and then we would again have a tug of war emerge between 1060 and 1130. It is important that 1056 be taken out in the next two weeks or else the up trend I am expecting for early September could be strong enough to challenge resistance at 1130 and even go higher. I don’t think it’s probable, but it is nonetheless possible so that 1056 level will be an important area to watch.
 This week looks quite bearish. Monday and Tuesday will be dominated by the Jupiter-Saturn opposition that will be exact at the close of trading on Monday. This confrontation between optimism and pessimism needn’t always be bearish but given the other relevant factors it seems that it will correspond with frustration and obstacles. The early week period has the added burden of a tight aspect between Mars and Rahu that suggests sudden or violent actions are going to be the order of the day. This may find expression in higher trading volumes, increased volatility, and unexpected developments. It seems quite possible this could coincide with a significant down day or two with Monday perhaps looking worse. Wednesday holds some chance for gains (especially if we are lower after Tuesday) as Venus aspects Rahu. This is an unstable combination at the best of times, but may nonetheless coincide with some very speculative buying. Thursday is harder to call as the approaching Venus-Mars conjunction is still very close here but perhaps not quite close enough to warrant a down day. The Moon is with Pluto here so that can signal increased resolve. I would not rule out any outcome here. Friday looks more solidly bearish as the Venus-Mars conjunction is exact and the Moon teams up with Rahu. This looks like an "unusually uncertain" combination and seems likely to generate more selling pressure. Thursday-Friday are likely to be net negative, as are the Monday-Tuesday pairing. Wednesday looks like the most positive day of the week. A more bullish scenario would see the 1060 level hold into Tuesday and then some recovery to 1080 by Thursday will another move towards 1050-1060 by Friday’s close. A bearish outcome would see a more violent move lower early in the week to 1040 (or below) then a relief rally of 1% followed by another move lower still to 1020-1040. In either case, I think the low of the week is more likely to occur closer to Friday.
 Next week (Aug 23-27) still looks like another bearish outcome with lower lows very possible. A bounce is very likely on Monday and into Tuesday on the Sun-Jupiter alignment. If the preceding Friday has seen heavy selling, then it could be nothing more than a technical bounce, no matter how apparently exuberant. Wednesday and especially Thursday, the 26th look quite stressful as the Sun forms an aspect with Saturn while retrograde Mercury will aspect Mars. Both of these are bearish influences and their simultaneity looks doubly negative. For this reason, it is quite possible we could see lower lows by the end of the week. The following week (Aug 30-Sep 3) we could see an interim bottom formed. It’s very much a guess since the Jupiter-Uranus conjunction will begin reflect an increase in risk-taking energy in early September. Just when this overwhelms the bearishness of the ongoing Venus-Mars conjunction is harder to say. The main celestial feature here occurs on Thursday and Friday when the Sun will conjoin retrograde Mercury in close aspect with Rahu. This appears to signal some major price swings. The Sun-Mercury conjunction is often bullish but the Rahu influence here opens that up for debate somewhat. I would lean towards a positive outcome here leading into the Labor Day long weekend. After that, we could see some bullish sentiment building into September although with a major decline around Friday Sep 10 or Monday Sep 13. After another week or so going higher, the full weight of the Saturn-Rahu aspect will begin to be felt. This is exact on Sept 27 and is likely to color the end of the month and perhaps into early October. I would expect a lower low at this time. 975 is very doable at the top end of the range, and depending on how far we fall at the end of the August, it could even get to 800.
5-day outlook — bearish SPX 1020-1060
30-day outlook — bearish SPX 1000-1060
90-day outlook — bearish-neutral SPX 1000-1130
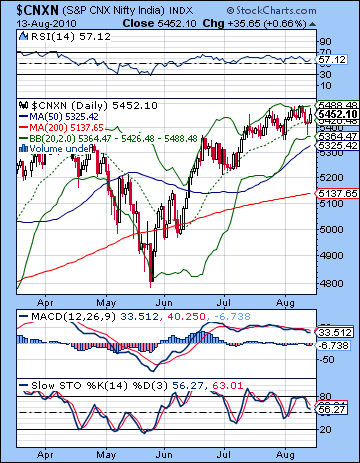 Stocks in Mumbai continued to run stronger than most other global markets as prices edged slightly higher last week led by banks and positive earnings reports. After making new highs on Monday, enthusiasm receded somewhat as the Sensex closed at 18,167 while the Nifty finished at 5452. While I had expected some early week gains on the Venus-Jupiter aspect, it was nonetheless a somewhat frustrating result. Clearly, the weakness of transiting Venus in the sign of Virgo has yet to have much downside for the Indian market, no doubt owing to its fairly resilient natal horoscope. We did see some modest selling in the wake of Monday’s Venus influence, although the combined decline was barely one percent. While Thursday was down for most of the day before finishing flat, Friday saw yet another rise to put the indices back in the green. As maddening as this result was, I acknowledged the possibility that we might have to wait for this week’s Jupiter-Saturn to see a significant down move take place. Given the continuing strength here, we have to assess the extent to which Indian stocks are marching to their own drummer. Can they somehow manage to escape the probable bearish outcome presaged by the current planets? Despite being too bearish over the past weeks, I don’t believe Indian stocks can resist this gravity-like force much longer. Admittedly, my thesis of an interim top at the end of July on the Saturn-Uranus aspect has largely gone by the boards, although we should note that the subsequent rise has been quite modest — less than one percent. The difficulty is that the high number of aspects here has made that usually reliable measurement less effective. Saturn and Uranus were therefore joined by Jupiter, Mars and Venus in close succession of the past two weeks so all may have contributed to an accumulation of sentiment that pushed prices to ever-higher levels. In this respect, Monday’s Jupiter-Saturn is another potential line in the sand for the market. That said, the Indian markets do exhibit a certain degree of individuality here since they peaked in early April a full two weeks ahead of the rest of the world. This singularity may therefore be duplicated this time around. The key transits for the rest of August seemed disproportionately tilted towards bearish Saturn. After Jupiter confronts Saturn on Monday, Saturn aspects Pluto on Friday. Meanwhile, the next dose of Jupiter isn’t scheduled to arrive until early September when it approaches it conjunction with Uranus. Some kind of up trend is therefore likely heading into 18 September. Saturn is likely to regain control of the market afterwards, however, as its square aspect with Rahu is exact on 27 September. This is likely to signal another down trend into October.
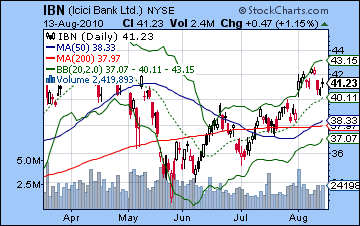
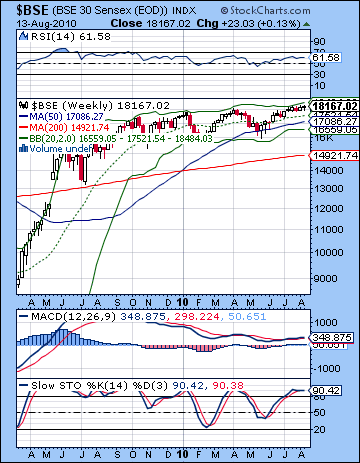 While the bulls can rejoice at the prospect of another week in control, the technical picture seems mixed at best. Volume recovered somewhat from previous weeks, although it’s worth noting that Monday’s high came on just 11k shares on the Sensex. The Nifty chart shows a narrowing of the Bollinger bands that usually precedes a major move. We can also see how Thursday’s low tested support at the bottom Bollinger band before buyers came in and took prices towards the upper band. All three moving averages are still moving higher, and that is certainly a very bullish indication. What is necessary for the bears to do is to take out the previous low at 5350 in order to establish a lower low and thereby initiate a more negative price pattern. Meanwhile, bulls have to push higher towards the upper band at 5488 and venture towards another new high. But the momentum indicators do not look conducive to major new highs as MACD remains in a bearish crossover and clear negative divergence. RSI (57) is bullish but it also displays a negative divergence as lower highs do not correspond with higher prices. In order to break this pattern, the RSI must exceed the Aug 9 high of approximately 67. Stochastics (57) are in a down trend and may reveal a likelihood for tracking lower still. We can also discern a pattern of lower highs in the Stochastics hence setting up a negative divergence with the sequence of higher prices over the past two months. The weekly chart of the BSE shows more bearish indicators as the RSI (61) has a series of declining peaks that diverge from the higher highs over the past few months. This suggests the highs are not sustainable over the medium term and a pullback is likely. It is much the same story on the MACD as the bearish crossover and negative divergence points to a significant pullback. We can also see how prices have tended to bounce off the upper Bollinger band — this time based on a 20-week average — and have found support near the bottom band. Currently, this level is about 16,500 so that is one potential area of support in the event of another correction. At the same time, we can see how compressed the bands have become and that sometimes indicates that a large move may be in the offing. The NY chart of ICICI Bank (IBN) shows the mixed nature of the current technical picture. While its August highs have been impressive in that they have maintained the bullish pattern of higher highs since the May pullback, they have not been strong enough to eclipse the April high. If prices reach that level, then the chart will become bullish while a breakdown below the late-July low of $38 would signal a lower low and the end to the recent up trend.
 This week holds the promise of another bearish week. The major influence here will be the Jupiter opposition to Saturn after Monday’s close. These planets are the yin and yang of the solar system and have the power to change market direction. The previous opposition aspect was part of the May correction and there is a good chance we could see lower prices on or shortly after this aspect. The other possibility is that we could see some intraday highs on this aspect and then begin to fall afterwards, both on Monday at the close and then through the rest of the week. Monday’s added feature is that Mars will be in close square aspect with Rahu. This is also exact after the close and has the potential to depress prices. Mars with Rahu creates sudden or shocking situations that may require quick reaction. For this reason, I would expect price swings to be larger than usual on Monday and Tuesday. There is a chance that we could see a big down day on either Monday or Tuesday and it is likely that the two days will be net negative. Wednesday looks more positive as Venus will aspect Rahu so that may correspond with some speculative buying. Later in the week, the picture appears to tilt towards the bears as Venus comes into exact conjunction with Mars near the close on Friday. Thursday is perhaps somewhat more positive than Friday although neither look particularly good. A more bullish outcome would see the early week pullback to only 5350, with a bounce to 5400 and then settling again near the bottom Bollinger band around 5350. A more bearish scenario would see a violation of the bottom Bollinger band early in the week with a Friday close around 5300 and the 50 DMA. That said, there is the potential for much more damage on the downside here but thus far Indian stocks have managed to escape these negative energies largely unscathed.
Next week (Aug 23-27) looks like the downtrend will continue. The early week will likely be positive on the Sun-Jupiter aspect on Monday and Tuesday. This may be a significant bounce if we have seen a sizable selloff late in the preceding week. Then the bears return later in the week as retrograde Mercury will form an aspect with Mars while the Sun is in minor aspect with Saturn. The simultaneity of these two bearish influences is quite unusual and should erase most if not all of the gains made in the previous two sessions. The following week (Aug 30-Sep 3) may see an interim bottom put in as the Sun conjoins Mercury in close aspect to Rahu. This is a combination that could take prices in either direction but it is likely that the move will be quite large. Given the approach of the Jupiter-Uranus conjunction in mid-September, I would expect prices to rise here. The second half of September looks more clearly bearish and will probably wipe out any gains from the preceding weeks. The gloom will likely carry over into early October as Venus will again conjoin Mars. A possible important low might occur on 7 or 8 October. Just where this will occur is an open question. I had expected the Nifty had a decent chance of revisiting 4000 here but that seems increasingly unlikely. First, let’s see what kind of correction we get at the end of August.
5-day outlook — bearish NIFTY 5200-5350
30-day outlook — bearish NIFTY 5000-5200
90-day outlook — bearish-neutral NIFTY 5000-5500
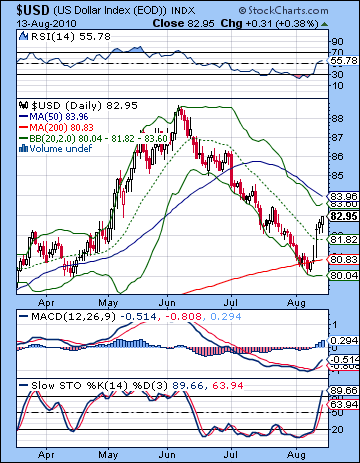 Hallejulah! The Dollar has finally been resurrected after being left for dead by the side of the road. It rose in five successive sessions last week closing just a bit below 83. This was a stunning and long hoped for reversal after it had been locked in a falling channel for almost two months. While I had been a little premature in my call for gains, it was good to have my basic bullish outlook confirmed. It seems that the Eurozone is back under the microscope as Germany’s strong economic growth data puts the ECB in a tight spot since raising interest rates is the last thing the troubled peripheral countries like Greece and Spain need right now. Greek bonds are once again trading at a rising premium here as the gap with German bunds has widened to over 800 basis points, the highest since May 7. This is all good news for the greenback as it now finds itself in the unfamiliar position of challenging resistance levels. After breaking out of the falling channel and the 20 DMA, it has now moved towards the top of the Bollinger band and is threatening to overtake the 50 DMA around 83.50-84. All the technical indicators have swung in a decidedly bullish direction here, so we could be in for a sustained uptrend as I have been forecasting. The RSI (55) still has a ways to go before it is overbought so that could translate into another 2-4 point movement here. Divergences are still apparent, too, however, so no matter how high this rally goes, it seems likely that prices will have to collapse eventually. MACD and RSI had some very tall, sharp peaks that would require a massive rally to equal.
This week looks like ‘all systems go’ so we should see more gains. Monday’s Mars-Rahu will likely correlate with rising fear that should enhance the Dollar’s safe haven status. This could be an explosive move higher. The late week looks similarly bullish, although perhaps more moderately. I would expect resistance at the 50 DMA to fall here with a shot at 85. Next week also looks fairly positive as the early week bearishness implied in the Sun-Jupiter aspect may well be offset by the nice pattern that sets up in the natal chart. Pullbacks are likely to be fairly mild over the next month or so, perhaps barely to the middle Bollinger band (i.e. 20 DMA). The uptrend will stay in place until at least mid-September and the Jupiter-Uranus conjunction. One interesting potential paradox will be how such an aspect will be bullish for both the Dollar and equities, as I am forecasting. The Dollar strength seems more reliable than stocks, and yet both have a good chance of coming to pass. A level of USDX 88 is still very much in the cards here and I would not rule out a run to 90. We could see the Euro fall towards 1.26 this week with the early part of the week doing the most damage. As expected, the Rupee lost ground last week. This down trend should continue over the next two weeks with 47 very much in the cards.
Dollar
5-day outlook — bullish
30-day outlook — bullish
90-day outlook — bearish-neutral
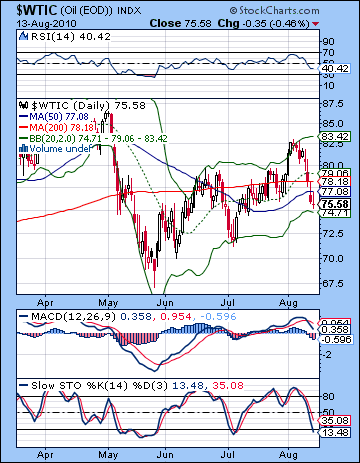 Crude oil got thumped badly last week as deteriorating economic data reduced demand estimates going forward. After Monday’s brief rise, crude fell by more than 6% overall closing below $76. This bearish outcome was very much in keeping with my forecast as I thought we might have enough downward thrust to test support at the bottom Bollinger band ($75) by early next week. With prices just one dollar from that level now, it’s almost a mulligan from here. The early week strength also arrived on cue as the Venus-Jupiter aspect corresponded with a rise to $82. But it was all downhill after that as we saw major declines on both Wednesday and Thursday. I thought we might see more bearishness on Friday but that may have been postponed until next week’s Mars-Rahu aspect. The technicals here are pretty uninspiring as prices closed below all three of the 20, 50 and 200 DMA. With the three moving averages flattening out here, there is less wiggle room for bulls to tout future prospects. MACD is in a bearish crossover here although there is no negative divergence yet. RSI (41) is falling, although it is only matching its previous low. Stochastics (9) are now oversold and this may bring in some buyers, perhaps once we hit support on the bottom Bollinger band at $74. A more crucial level of support will be $72 which is the previous July low. A close below this level might open the floodgates and spell the end of the current trading range between $70 and 82.
This week could well see more downside as the transit picture looks quite negative. That said, the natal chart lacks some of the kinds of affliction one would normally see in a major down move. The Moon transits Scorpio from late Monday to Wednesday so that could also indicate some occasional rallies. I still think lower prices are the likely outcome here but it’s possible the decline may be less severe than equities. Also some late week strength is more likely with crude. $72 is very possible, and I would not rule out $70. The following week might be mixed at best but lower prices are also very possible. Crude could form a temporary bottom between Aug 30 and Sep 3. If this retracement gains steam, then we could be looking at sub-$70 crude quite soon. After a one- or two-week bounce, prices will resume their decline in the second half of September. The last week of September looks to be the darkest period.
5-day outlook — bearish
30-day outlook — bearish
90-day outlook — bearish
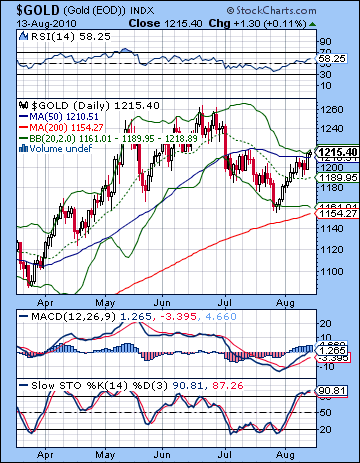 Fears of deflation lit a fire under gold once again as bullion climbed 1% to close near $1215 on the continuous contract. While I expected some upside on the Venus-Jupiter aspect that might have tested $1220, the inability for prices to pullback at all was disappointing. For some reason unknown to me, the transit of Venus into Virgo has yet to have significant impact on gold. Possibly, it is being supported by the high number of aspects involving Jupiter. From a technical perspective, the intermediate term looks fairly positive for gold as prices are still well above a rising 200 DMA. The daily chart looks more difficult in the short term although one can still piece together a bullish case. Prices have drifted up to the top of the Bollinger band suggesting a pullback may not be far off. Friday’s close at $1215 was close enough to the 50 DMA ($1210) that it may still be considered to be at resistance. Stochastics (90) are overbought here and may be signaling a pullback. That said, both MACD and RSI do not exhibit any short term negative divergences and both are bullish. Using a longer time period, however, we can see a negative divergence with respect to previous peak in the RSI dating back to May as the succession of lower peaks is clearly evident. Overall, the short term seems to indicate a pullback of some size in the next week or two. $1220 is a key resistance level here as it is the most recent high and failure to take it out would show major weakness by the bulls. Support may be found near the bottom of the Bollinger band at $1161 which is also very close to the 200 DMA at $1154. More importantly, this coincides with the previous low.
Unlike last week, this week does not offer any obvious bullish aspects for gold. Wednesday’s Venus-Rahu aspect might be somewhat bullish but it is unlikely to generate the same level of enthusiasm as last week’s Venus-Jupiter aspect. The Jupiter-Saturn opposition in the early week period may finally generate greater levels of selling as the natal chart will increasingly be vulnerable to Saturn’s influence. The late week looks more bearish in this respect as Mars will exactly conjoin Venus. We are likely to fall below the 20 DMA here. Next week also looks bearish as Saturn forms a tight aspect with the natal Moon in the GLD chart. I am reluctant to forecast any decisive break below $1160 in August but it is certainly very possible over the next two months. That said, Jupiter will begin to exercise more of a positive influence on gold by the end of September so that may act as a temporary break on any major down trend.
5-day outlook — bearish
30-day outlook — bearish
90-day outlook — bearish-neutral

