- Stocks declines likely on Monday, followed by midweek gains; bears likely back in control later in the week
- Dollar rally to continue; Euro may break below 1.24 by next week
- Crude oil support jeopardy; test of $70 possible next week
- Gold weakness likely on Monday and Thursday; pullback likely to gather strength after mid-September
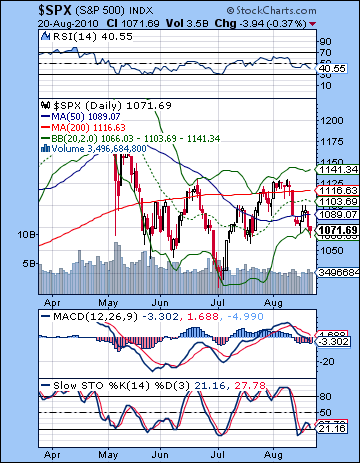 It was another victory for the bears last week as more bad news on the jobs front short circuited the midweek rally attempt. After failing to break above resistance, the Dow closed down about 1% for the week at 10,213 as the S&P finished at 1071. As welcome as the late week selloff was, it was a fairly orderly affair and we didn’t reach our downside targets. The absence of any early week decline was the main culprit here as I thought the combined effects of the Jupiter-Saturn opposition and the Mars-Rahu square would have corresponded with declines, even significant ones. But it was not to be. All we got was some fairly tepid selling at Monday’s open, and then the bulls came back into the ring and pushed prices back up until Wednesday’s close. The late week selloff appeared to coincide nicely with the Venus-Mars conjunction, although Thursday turned out to be the worst of the two days, rather than Friday as I had forecast. The failure to see a larger pullback was definitely disappointing, but does not fundamentally change my bearish outlook here. Economic fundamentals remain weak and unlikely to turn around anytime soon. The possibility of more stimulus from the administration or from the Fed could improve sentiment, but to some extent the market has already priced some of that in and the political support from the GOP is lacking in Washington ahead of the midterm elections in early November. We have seen the bond market explode to the upside here thus strongly indicating lower equity prices in the near term. To be sure, some of this bond rally is due to planned government purchases, but the notion of deflation down the road is also gaining momentum as the economic slowdown shows no clear sign of turning around. Perhaps more importantly, the US Dollar continues to strengthen here. This is another key factor that should accompany a stock selloff. Much of the bounce off the July low came on a resurgent Euro. Now that Europe’s problems are moving back into view, the Euro seems likely to revisit its recent lows. Although some of these Eurozone worries have already been priced into the market, a stronger Dollar will take money out of stocks as investors seek safety. From an astrological perspective, the planets do not offer much support for the bullish view, although the approaching Jupiter-Uranus conjunction in mid-September might coincide with a rally, especially if we see a meaningful decline in the next two weeks. The inability of two big Saturn aspects with Jupiter and Pluto to take the market significantly lower may simply reflect a delayed effect on the markets which will become manifest only with the transits of faster moving planets. And it is important to remember that Saturn’s final big aspect arrives in late September as it squares Rahu. Saturn-Rahu combinations are often bearish and this one has the potential for significant declines, and even a crash.
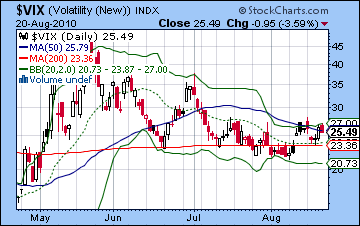
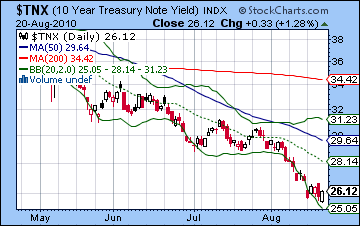
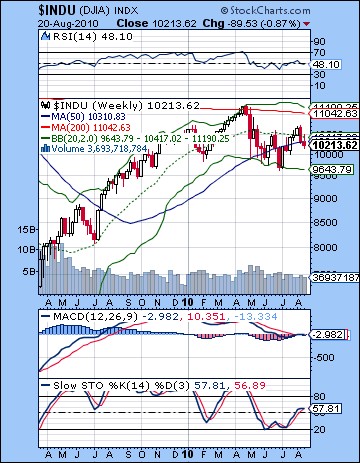 The bulls fumbled the ball this week as the market failed to break above some key resistance levels. On both Tuesday and Wednesday, the S&P traded up to 1100, only to be pushed back at the close. This was the approximate level of the 20 DMA (1103) and marked a previous resistance level dating back to early July. The bears were more successful as Friday’s trading took out Monday’s low. Bears still have more work to do, however, as they have to break below 1056 and thereby form a new lower low after that preceding low from July 20. After that, the July 2 low of 1010 on the S&P will be the line in the sand that will engage the battle between optimism and pessimism. There are still good technical reasons for expecting that the bears have a better chance of success here than the bulls. In a word, support looks more vulnerable than resistance. From the support side, prices ended up near the bottom of the Bollinger band and we did get a bullish hammer with Friday’s session. But volume on down days continues to out pace up day volume — a sure sign of nervousness that points to lower prices going forward. The 20 and 50 DMA are now flat and in danger of falling and both offer significant resistance in the event of any rallies. The falling trendline off the April highs will intersect in the midst of these support levels over the next two weeks. This trendline will offer firm resistance around the 1110 level next week and 1100 the week after. A break above this falling trendline would spell trouble for the bearish view. I don’t see that happening anytime soon but it is something to factor into the overall picture. MACD and RSI are now negative and both falling as the RSI is showing a negative divergence with respect to the July 20 low. Stochastics are turning up above the oversold line but given the strong negative divergence with the previous low, we cannot count on a new move higher. The weekly Dow chart shows a bearish inverted hammer candle at an important resistance level of the 20 WMA. This also looks quite bearish for the medium term. RSI (48) has now moved into negative territory. We will have to keep a close eye on how low the RSI goes with respect to its previous lows around 40 in May and July. If it falls below this level on any decline, then it will indicate the probability of still further declines in the medium term. US Treasury yields continued their descent last week, although Friday’s reversal higher may have indicated a temporary stop to the bull run. I don’t expect too much more downside to yields here, and some retracement back to 2.70 or higher is likely by the second week of September. The $VIX actually fell a little this week, probably related to options expiry week. It is nonetheless holding above the key support level of the 200 DMA.
 This week has a mix of aspects although there are significant downside opportunities on Monday and then later in the week. Monday may feature the initial effects, if any, of the Mercury retrograde cycle that began on Friday afternoon. While this is rarely a clear influence, it can be one disrupting factor in a larger corrective pattern. The previous Mercury retrograde cycle from April 18 to May 12 broadly correlated with the May correction. We shall see to what extent it may play a role here. Mercury will continue to move backward in the sky until September 13. So Monday has a greater chance for a decline as the Sun forms a minor but exact aspect with troublesome Mars. But due to the close proximity of several simultaneous aspects involving both negative (Mars) and positive (Jupiter) planets, it is conceivable that we get a repeat of last Monday with a down open and then a recovery through the day that continues into Tuesday. Certainly, Tuesday and Wednesday seem more positive as the Sun aspects Jupiter while Mercury is in a minor aspect with Venus. The good mood may not last until Wednesday’s close to any rally should be seen as very temporary. As the week progresses, Mercury (now moving backwards) will encounter Mars just as the Sun is lining up with Saturn. These are pretty bearish planets here so there is a good chance of significant downside later in the week. Thursday looks the worst from an exact geometric perspective, although as we know, these angles have a way of sometimes not showing up exactly when they should. I would think we get two down days (or net negative at least) later in the week, maybe Wednesday and Thursday, or Thursday and Friday. I would tend to think that the Thursday-Friday tandem is probably more likely. The latter part of the week looks more bearish than Monday so declines are more likely to be larger then. One bullish scenario would be a decline to 1065-1070 on Monday, followed by a two-day rally to 1080-1090, followed by a move to 1060 by Friday. This would keep the previous low intact and would give bulls some hope at least. A more bearish scenario would be 1055 on Monday, followed by 1070 by Wednesday and then down to 1040-1050 by Friday. This is very possible although it is unclear to me if we have enough bearish energy in these planets to take us there right now. But I do think we have a good chance to break below that previous low of 1056 this week.
 Next week (Aug 30-Sep 3) also looks pretty bearish as Monday could be negative. Some midweek gains are likely here, however, and then may be stronger than what we could see this week. The end of the week looks more decidedly bearish ahead of the Labor Day long weekend. The Sun and Mercury conjoin while in aspect to Rahu so this could coincide with greater financial uncertainty and takes prices lower. There is a reasonable chance that we will see an interim low former here, either on Monday or perhaps on Friday. The following week could see buyers come back into the equation as Venus forms minor aspects with Uranus and Jupiter on Tuesday and Wednesday. We may see the top of any rebound rally there as the week after looks more tense as Mercury forms aspects with Venus and Saturn. Saturn is the bad guy here so its aspects do not bode well for the market overall. September 15 may see the bears return in force as the next down trend takes hold. The time around Sep 24/27 looks very ominous and could see a major decline, perhaps of a size befitting a crash. A bottom could be put in sometime shortly thereafter, perhaps as late as the first week of October and the start of the Venus retrograde cycle. October will likely see a significant two or three week rally off those lows, but the market will weaken again in November and December. It is hard to say if the December lows will be lower than anything we see in early October. It’s quite possible. So a bullish scenario would see 1010 hold in early September and then a rally back to 1050-1070 and then down to 920-975 by early October. A more bearish unraveling could mean 975 by early September, a rally to 1020-1040 by mid-September then down hard to 850-920 by early October. Since there is a decent chance of more downside as we head into 2011, I would err on the side of caution and assume the more bullish scenario for now and see how it unfolds.
5-day outlook — bearish SPX 1040-1060
30-day outlook — bearish SPX 1020-1060
90-day outlook — bearish-neutral SPX 950-1050 (N.B. this is a guesstimate for prices on Nov. 20)
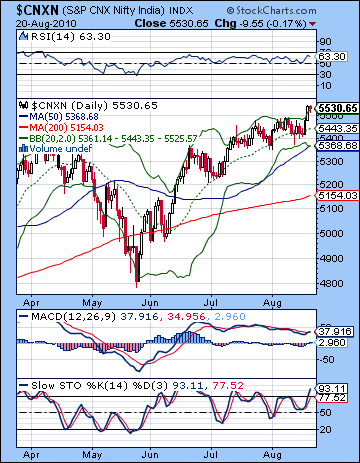 Stocks in Mumbai rose for the third week in a row as foreign institutional investors responded favourably to new consumer spending forecasts. The Sensex broke out of its recent trading range and gained more than 1% to close at 18,401 while the Nifty finished the week at 5530. Alas, Indian stocks continue to defy gravity here while the rest of the world slides further into the red. As puzzling as this bullish outcome was, it is worth noting that the intraweek action roughly mirrored the planetary influences I had outlined in last week’s newsletter, albeit at levels much higher than I had anticipated. I had expected the early week to be bearish on the twin influences of the Jupiter-Saturn opposition on the Mars-Rahu square and we did indeed see prices pullback slightly on Monday and stay flat on Tuesday. I thought we had a chance of a much greater downside but buyers quickly stepped in as the overall bullish story on India continued to gain traction. As expected, the midweek saw bulls prevail on the Venus-Rahu aspect and we got solid gains on Wednesday and Thursday. While neither day was surprising, the extent of the gains were as we punched out of the recent trading range. As predicted, the end of the week was more bearish on the Venus-Mars conjunction. Friday saw some very modest selling although buyers came in snap up bargains. When all is said and done, last week was a big win for the bulls. And while I have been wrong about the reversal window here, I still believe that the downside risk greatly outweighs any upside potential. The strong Saturn influence has yet to manifest in Mumbai, but it is taking hold elsewhere in the world. Eventually, there will be no escape from the larger downtrend and Indian stocks will have to follow suit as export forecasts will have to be cut as foreign buyers rein in spending. In astrological terms, the failure of the various Saturn aspects to take prices lower raises our eventual price targets for the fall season. While prices are likely heading lower in the medium term, their lofty heights means that previous targets such as Nifty 4000 are probably impossible over the next two months. That kind of level is still quite possible at some point in 2011, however. In the meantime, we will be watching Saturn for signs of its growing strength and with it, the greater likelihood for declines. It is still going to form a difficult aspect with Rahu in late September and now it seems likely that that aspect will govern the lion’s share of the decline. Transiting Jupiter has played an extending starring role here due to its favourable placement in the NSE chart and it may be gaining power as we move into September and its conjunction with Uranus. In some respects, the current rise may be in anticipation of that conjunction as some of that bullishness may in fact be manifesting ahead of schedule.
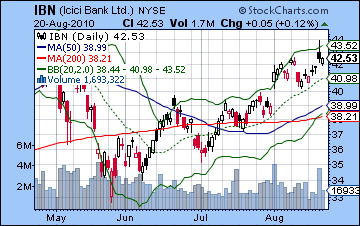
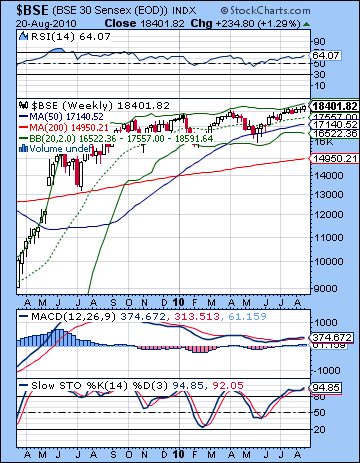 The bulls won again last week despite low volume and numerous indicators still suggesting the move was overdone. The midweek gains occurred on just 14k shares traded in the Sensex, and this was well below the annual average. Most of the recent buying has been done by FII in search of better prospects as US and European markets have fallen by the wayside. Domestic buying in the Indian market has been increasingly cautious. Prices ended the week near the top of the Bollinger band thus increasing the likelihood of a pullback next week. As a sign of the bullishness of the markets here, pullbacks have often only gone as low as the 20 DMA before buyers entered once again to bid up prices. MACD on the daily Nifty chart saw the beginning of a bullish crossover last week, although the negative divergence is still very much intact. RSI (63) is bullish and still generally rising. Last week’s gain mostly erased the divergence in the recent highs, although the lows may still be a vulnerable area. Nonetheless, this indicator has taken a turn to the positive. Stochastics (93) are well into the overbought zone but most of the bearish divergences have dissolved also. Obviously 93 is a very high reading and indicates that current levels need to pullback eventually, but this is not an imminent sign. Prices appear to be following a rising channel with support around 5440 and resistance at the top of the channel at 5560. Support levels are especially crucial here since the rising lower trendline coincides with the 20 DMA (5543) A violation of that level could begin a significant shift in sentiment in favour of the bears. Until that happens, the bulls will remain in charge. All three key moving averages are rising now. The weekly chart of the Sensex also shows how bullish the current market is as prices remain at the top Bollinger band and have not fallen below the middle line (20 WMA=17,557) since late May. Weekly RSI (64) is rising here but we can see discern a series of falling peaks going back to 2009 hence the negative divergence remains in effect. ICICI (IBN) shows the recent strength but there is more evidence to suggest the rally is unsustainable. It’s trying to recapture its April highs in this recent run-up but Thursday’s session produced an inverted hammer candlestick. This is a bearish signal that decreases the likelihood for new highs and a continuation of the rally. With the bulls in command here, the bears will have to earn their stripes back gradually. The first order of business will be to prevent any upside breakout of the trendline above 5560. Next, prices still have to come back down to the 20 DMA to 5543. Those will be very modest but necessary first steps to winning back the market direction. But that would still only constitute a run-of-the-mill bull market pullback. A more critical level is around the bottom Bollinger band at 5370. This also corresponds with the previous low. If this gets taken out, then it would help to re-orient the market towards a bearish perspective. Until that happens, the market will stay firmly in the bullish camp.
This week will be another opportunity for the bears to take prices lower, although the negativity may be mostly confined to the late week. One interesting new element this week will be the effect of the Mercury retrograde cycle. Mercury turned retrograde on Friday evening and when it moves backward through the sky it increases the chances for markets to reverse and for prices to fall. Indeed, the spring correction correlated fairly closely to the previous Mercury retrograde cycle from April 18 to May 12. This is not to say that Mercury was the most important factor in the decline, but it was one of several, just as it could be here. The current Mercury retrograde cycle runs from 20 August to 13 September. Monday could well be lower as Venus is still in close conjunction to Mars while the Sun is in minor aspect with Venus. I would doubt we will see a large move lower given the prevailing bullish trends and energies. But if it is more than 1%, then that is clue that perhaps Mercury’s new direction has shifted something more fundamental here. Tuesday and Wednesday look net positive as the Sun aspects Jupiter while Mercury aspects Venus. This should improve business confidence and spur some buying. We could well get two consecutive up days. Thursday and Friday look net negative with a possibility (but not a probability) of a larger move lower. Friday is perhaps more bearish in that respect as Mercury aspects Mars while the Moon conjoins Jupiter opposite Saturn. Overall, there is a chance we could finish lower on the week although much will depend on how much negativity we see later in the week. Some of that bearishness may be delayed until next week so it’s possible the losses may be fairly tame.
 Next week (Aug 30-Sep 3) will begin quite bearishly on Monday as Mercury aspects the natal Ketu in the NSE chart. There is a chance we could see a decline of greater than 2% here. Some midweek bullishness is likely and then weakness will likely return by Friday as the Sun and Mercury will conjoin while in aspect with Rahu. This is likely to spark more significant selling. Overall, this week could be down as much as 5% and take the Nifty down below 5300. The first full week of September looks like the market may bounce as Venus aspects Jupiter and Uranus, especially early in the week. Losses are likely on Friday 10 Sept and Monday 13 Sept as Mercury ended its retrograde cycle while in aspect to Saturn. After another week of rally attempts, the market should fall more steeply as Venus Mars and Saturn all proceed through their aspects to Rahu and Ketu. Friday Sep 24 and Monday Sep 27 are critically important and could see major declines on either or both days. We could see the market form a significant low around 7 October as Venus turns retrograde in conjunction with Mars. This would precede a two or three week October rally. November and December look bearish to neutral. In terms of key levels, a bullish scenario would see a low in early October between the previous low of 4786 and the 200 DMA at 5154. The market would then rally back 10-20% into late October and early November before falling again into December. A more bearish scenario would see the lows in early October below the previous May low of 4786, perhaps down to 4500. Then the October and early November rally would see prices back towards 5000, and then down again into December.
5-day outlook — bearish-neutral NIFTY 5400-5550
30-day outlook — bearish NIFTY 5000-5200
90-day outlook — bearish-neutral NIFTY 5000-5500 (N.B. This is a guesstimate of prices on 20 November)
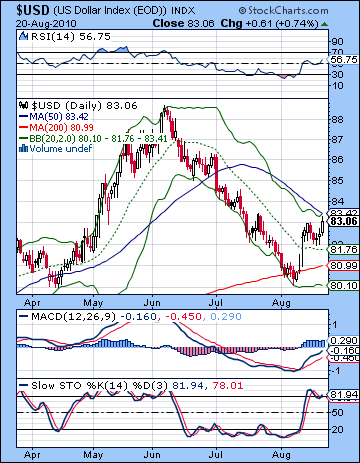 The Dollar continued to gain strength last week as more bad US economic data sent investors in search of a safe haven. After some declines early in the week, the Dollar finished strong above 83 and the Euro closed at 1.27. As welcome as these last week gains were, I thought we might have seen more upside but the early week gains did not materialize as the Mars-Rahu aspect fell through. The Dollar appears to be benefiting from the weakness of the Eurozone here as bond premiums are again widening for peripheral EU members like Greece. Also the Fed has announced that it is unlikely to unleash a "shock and awe" version of quantitative easing 2.0 this time around preferring for a more piece meal approach. The market is interpreting this to mean less money printing for the moment, so there is some hope for Dollar firmness in the near term. Technically, the Dollar has pushed to the top of the Bollinger band.and is now encountering resistance from the 50 DMA at 83.42. RSI (56) has moved in the bullish area and is rising. We can spot of positive divergence there with respect to a previous high on June 28. Current prices are lower than they were then, but the RSI indicator is at a higher level thus suggesting that prices will move above that level in the near to medium term. The 20 DMA is leveling out here and may begin to rise after another positive week. Stochastics (81) are in the overbought zone although after such a long decline, this may not be the most reliable indicator. An overbought condition can last for some time when a security is recovering from a long downtrend. From a weekly perspective, the Dollar still looks fairly bullish. Stochastics (23) are just now turning higher out of the oversold area and prices are moving towards the 20 WMA at 83.79. So the technical picture still seems fairly bullish overall, although there is the possibility of some consolidation before continuing this upward move.
This week looks generally positive although some midweek aspects could increase risk appetite which would be bad for the Dollar. Nonetheless, there is a good chance for gains on Monday and towards the end of the week, on Thursday and perhaps Friday. That should see the Dollar finish higher than current levels. Next week is likely to build on those gains with 85 very possible. This would correspond with 1.24 on the Euro. The Rupee is likely to slip back towards 47. The Dollar is likely to stay in this up trend until at least September 18 and the Jupiter-Uranus conjunction. While this conjunction involves planets that are usually risk-friendly, here they form a supportive aspect with the natal Sun in the USDX chart and hence will likely correlate with a rising Dollar. What happens between September 18 and the Venus retrograde on October 7 is less clear, however. Stocks are likely to still be falling during that time, while the Dollar’s course is uncertain. Jupiter will lose its strength here, although Venus may offer some bullishness. It’s a bit of a puzzle at this point but I hope to figure out its specifics in the coming weeks.
Dollar
5-day outlook — bullish
30-day outlook — bullish
90-day outlook — neutral-bullish
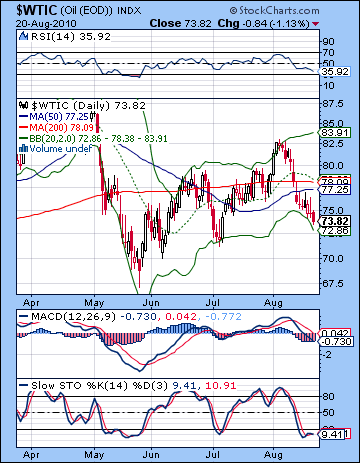 As economic forecasts continued to show slower growth, crude oil sold off again for the third week in a row closing below $74 on the continuous contract. This bearish outcome was more or less in keeping with expectations as the transit picture did not favor crude. With the failure of the early week Mars-Rahu aspect to create any bearishness, we saw crude actually put in a winning day on Tuesday, its only gain for the week. I had speculated that a gain was somewhat more likely during the transit of the Moon through Scorpio around this time. While it was another bad week, it nonetheless managed to stay above important resistance levels at $72. At the moment, it is at the bottom end of a rising channel that dates back to the May low. If it finds support here, then there is a case to be made for rising prices in the coming weeks. It actually may have fallen through that rising support line last week, although since it is now at the bottom of the Bollinger band, it may be one of those instances where trend lines are better drawn with a crayon rather than a sharp pencil. In any event, the previous low of $71.50-72 is hugely important now, as any break below that level would likely encourage more selling and take crude back down to $70 fairly quickly. RSI (35) is falling and showing a negative divergence with respect to the early July low. This is a sign of lower prices in the future. On the bullish side, Stochastics (9) are deeply oversold and it should prompt some rally attempt in the near term. But the bears have most of the lines on their side here, as price has fallen below all three moving averages. What’s worse is the 20 DMA is now sloping down for the first time since May.
This week looks like it could be another tough week for crude oil. Monday seems to indicate more selling as the Sun forms a minor aspect with Mars. Tuesday has a good chance for gains on the Sun-Jupiter aspect but the good vibes may dissipate sometime on Wednesday. Wednesday may still end positive although that is harder to say. Thursday looks like another down day as Mercury forms an aspect with Mars. Friday is another toss-up although I would not expect any up move to be very significant. Even if we see two up days this week, it seems unlikely that prices will move much higher and there is a better chance that we move lower. Monday could test that $72 support level and then we get a midweek bounce back to $74 and then fall again to $72 by Friday. Next week is very mixed with some negative days mixed in with quite positive days. Given the overall trend, I would expect lower lows, however, especially by the end of the week on Sep 3. Generally, it seems likely that crude will stay in a down trend until the Saturn-Rahu square aspect on Sep 27. $60 is a possible target.
5-day outlook — bearish
30-day outlook — bearish
90-day outlook — bearish neutral
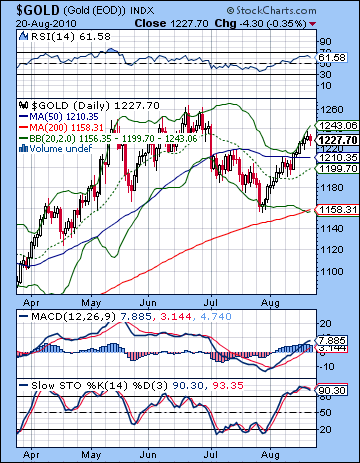 Gold continues to be the beneficiary of all the deflation talk in the US economy these days as it added another 1% last week before closing around $1227. I thought we might see more down side here with the approach of the Saturn-Moon aspect in the ETF chart, but so far that aspect has been MIA. Instead, we have the Sun shining brightly in Leo and that seems to have added to the luster of bullion. The midweek Venus-Rahu aspect delivered the expected gains and then some, while the late week Venus-Mars conjunction only correlated with a very modest decline on Friday. As has been the case recently, gold is responding well to any positive planets while apparently negative planets aren’t doing much damage. The result is higher prices as gold is now pushing up against the upper Bollinger band line. Thursday’s session produced an inverted hammer candlestick and that was followed by a bearish engulfing candle, so there is some reason to expect a pullback here. The indicators on the daily chart look moderately bullish given the rising moving averages although we can still detect a faint hope of a negative divergence on the RSI. MACD is also showing a lower high with respect to the previous high in June. Stochastics (90) look massively overbought here and are primed for a pullback. Overall, the technical picture favors some kind of pullback. Given the ongoing strength of gold, there is no indication that we are facing any imminent price collapse, however.
This week offers another chance for that errant Saturn to the Moon aspect to take prices lower. We also have the new element of Mercury moving retrograde through Leo. This is potentially damaging for gold since the Sun also occupies Leo at the moment. Monday looks bearish as the Sun forms a minor aspect with Mars so we can expect to see at least a moderate pullback below $1220. Gains are perhaps more likely into the midweek, however, as the Sun is likely to benefit from its quick aspect with Jupiter. I would expect Tuesday and Wednesday to be net positive. If for some reason they are not, then that is an important clue that the tide may have turned on gold. I don’t fully expect this to happen, but it is something to watch for. Thursday looks bearish as the Sun aspects Saturn while Friday is more uncertain. Given the natal afflictions, I would lean towards a negative or flat close. Overall, there is a good chance for a down week here. I would even venture to say there is a possibility of sizable declines, although given the midweek strength we may not be down that much when all is said and done. $1200 may be pushing it but it’s definitely possible. Next week looks like it could generate a large price move as the Sun conjoins Mercury in close aspect with Rahu. This may be a negative move, although I can’t be sure of that. While gold has not suffered during the Venus transit of Virgo, the Sun will enter Virgo on September 14. Since Saturn is in Virgo, this is likely to weaken prices from mid-September to mid-October. Again, I would think there isn’t much chance of a huge decline over the next couple of months but we seem likely to break below the 200 DMA at $1158. Gold’s steeper decline may be delayed until late 2010 and early 2011 as there are a number of difficult aspects forming in the natal chart.
5-day outlook — bearish
30-day outlook — bearish
90-day outlook — bearish-neutral

