

- Saturn-Ketu this week tilts towards bears; late week may see greatest volatility
- Dollar may see further weakness early but probable recovery by Friday; rally into October
- Crude oil prone to further weakness, especially later in the week
- Gold increasingly vulnerable to decline late in the week; October looks bearish
Stocks extended their advance last week as manufacturing and housing data surprised to the upside while the Fed Chair Ben Bernanke did little to diminish expectations of easy money. The bulls were very much on parade as the Dow climbed 2% and closed at 10,860 while the S&P finished at 1148. While I had expected some early week upside in the immediate aftermath of the Jupiter-Uranus conjunction, Friday’s surge came out of the blue and laid waste to what was otherwise a decent forecast. I thought we could see some significant upside on Monday and Tuesday as the Sun aspected the Jupiter-Uranus conjunction. And not surprisingly, the SPX climbed back to 1150 before reversing at the FOMC meeting in the afternoon. Bernanke offered few new hints about a possible second round of stimulus (aka QE2), other than to reassure investors that the Fed would do everything necessary to prevent deflation. Without any new concrete proposals, however, the bulls lost their nerve and started a round of profit taking that lasted through Thursday. This retracement was also very much anticipated as there was an absence of any clearly positive planetary energy for the balance of the week. Then came Friday — ouch! I actually thought we would see a greater chance for more declines as Mars was moving towards an aspect with Saturn but it did not pan out at all. Friday’s rally was a harsh reminder of the limits of astrology and my all-too-human interpretive abilities. While many price fluctuations will have some clear planetary correlation, not all will. Like most sciences of human behavior, astrology can only attempt to outline probabilities since certainty is only found in the physical sciences. That said, we can still note the relative proximity of the Jupiter-Uranus conjunction — now less than one degree past exact — and therefore we cannot be completely shocked by the appearance of big up days such as a Friday. Disappointed, yes, but not shocked. I had expected we would begin to see more of Saturn’s influence as it prepared for its own aspect with malefic Ketu on Monday September 27. So far, we are still waiting for Saturn’s more bearish effects to manifest. With Jupiter’s influence gradually fading and Saturn’s on the rise, the probability of a significant bearish move increases as we move into October and Q4. That said, I am becoming less confident that we will see a major move down in October. Calibrating planetary energy with actual prices is difficult here, and it is unclear if there is enough bearish energy to break below the all-important 1040 support level in October. It’s still possible, but I’m less certain of it now. A lot will depend on the first week of October. There is some very negative energy around the start of the Venus retrograde cycle that has the potential to take stocks down sharply, but just how far is an open question.
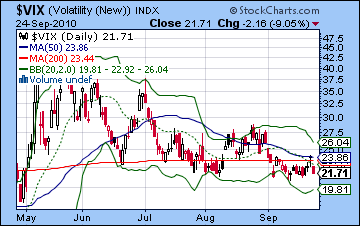
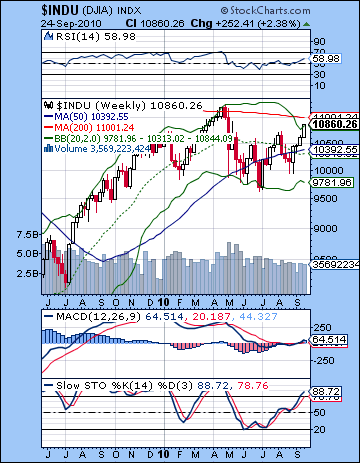 For all the bullishness last week, the technical picture remains only slightly tilted towards the bulls. To be sure, we broke above some important resistance on the Dow, but the wider indexes did not follow suit. Friday’s gain put the S&P sitting atop the right shoulder of the head and shoulders dating back to January. Failure to break above 1150 therefore kept that bearish pattern in play. The small cap Russell 2000 lagged even further behind as Friday’s high only managed to equal the highs from June and July. Financials (XLF) are also obviously lagging here as they have failed to equal their summer highs. Given the central role of the financial sector, this does not bode well for the market as a whole. So that’s very much a mixed picture with the blue chips leading the way but without broad participation. Volume continues to be on the low side which has been a hallmark of this rally. It doesn’t mean it will collapse overnight but it does likely mean it isn’t sustainable in the medium term. Besides the head and shoulders remaining intact, the other interesting feature of the S&P chart is that current prices are bumping up against the resistance line that dates back to the October 2007 high. This falling trendline touches the April 2010 high and the market has rallied back up to this line. Truth be told, prices could actually rise another 20-30 points and still not violate this resistance. But a push above this line would be a very bullish move. This is perhaps one conceivable last ditch defense for the bears if 1150 should break to the upside. Any rise above 1150 should all but kill the bearish scenario, but it is interesting to note how this falling trendline offers some kind solace at levels above 1150 on the S&P. With last week’s rise, the market seems even more overbought as Stochastics on the daily SPX are now 79 and have fallen just below the 80 line. What is interesting is that the Stochastics on the weekly Dow chart is now also above the 80 overbought line at 88. While these price oscillators can remain overbought for some time before selling ensues, a simultaneous overbought reading on both time frames is noteworthy and increases the likelihood of a pullback sooner rather than later. Daily MACD is still on the verge of rolling over here while RSI (66) touched the 70 line on Monday and now sits just below it. The VIX fell back under 22 this week but held on to its recent support level just a little below its 200 DMA. We can see that it was also slightly below the 200 DMA back in April just before it made its big move higher as the equities correction began. It seems we won’t see any kind of selloff unless or until the US Dollar undertakes a significant rally. The Fed’s promise this week to inflate at all costs savaged the greenback even further as more investors considered the long term implications of such currency debasement via the printing press. While a low Dollar is good for jobs, one wonders if Bernanke will still be able to attract buyers to US debt if no one wants his currency. I think the prospects are good for a Dollar rally in the near term, however short lived it may be. A more dangerous scenario for the Fed to consider is the possibility that both equities and the Dollar fall in tandem. I don’t see this happening until next year at the earliest but it is definitely something to watch out for in the weeks and months ahead.
 This week shapes up bearishly as we will get our first glimpse of Saturn’s strength on Monday when it forms its 90 degree aspect with Ketu, the South Lunar Node. While this combination of two bad planets should produce a decline, it is less clear exactly when the decline will occur. Since these are slow moving planets, they often require a third, faster-moving "trigger" planet to release their energy. The only close aspect we have this week occurs on Friday when the Sun conjoins Saturn. It seems very far-fetched that the market will stay at or above current levels until then, but that is something we cannot rule out. However, the probabilities are that we will see some pessimism before that, including on Monday. Tuesday and Wednesday are harder to call as there is an absence of exact aspects. Gains are perhaps somewhat more likely at this time. It’s the end of the quarter this week so there may be some strong and unpredictable moves that may not have any direct connection with the flow of economic news as fund managers adjust their balance sheets. The last quarter end witnessed a major decline and I would not rule out another one here, especially since the planets are inclined toward the bears. Thursday and Friday seem more bearish as the Sun conjoins Saturn while the Moon enters Gemini. Thursday’s Moon looks more negative but Friday has the more exact affliction of the Sun. There is a high probability for a net negative outcome across these two days, and both days may well end up negative. We could see a sizable decline here although the recent rally has tempered my expectations on the downside. Therefore, I will have to see it to believe it. A more bullish scenario would be a rise into 1150-1170 into midweek, followed by a decline to 1120-1140 by Friday. A more bearish (and I think more likely scenario) would be a decline Monday below 1140 followed by a failed rally attempt, then down into Friday somewhere between 1100-1130.
 Next week (Oct 4-8) features more bearishness and has a high probability to take prices significantly lower. Violent Mars roughs up Venus in a conjunction on Monday and that is likely to produce another decline. Some recovery is likely on Tuesday on the Sun-Venus aspect but the skies will likely darken again after that as the Moon joins Mercury and Saturn in Virgo for the end of the week. To top it all off, Venus turns retrograde on Friday the 8th. This is likely to disrupt sentiment since Venus will be still be in close conjunction with Mars. The combined effects of these influences makes a crash somewhat more likely here, although I do not think it is in any way probable. Perhaps we only end up falling 5-10% here. The following week (Oct 11-15) looks somewhat less bearish but not fully bullish either. It’s possible we could see lower lows here but it’s not something I would count on. Watch for a reversal higher after that as the end of October and early November looks mostly bullish. Stocks are likely to weaken again after that and head lower into late November. However, I would note that I am seeing some contradictory data for late November and December. Stocks generally look stronger after mid-December, however,as we will get a repeat of the Jupiter-Uranus conjunction that is exact January 4, 2011. At this point Q1 in 2011 looks somewhat negative, despite a significant rally in February. January and especially March look more bearish. A bullish scenario would see the S&P bottom in October at or above 1050 and then back up to 1150-1200 in November and then down to 1050 in December following by a rally into January back to 1150-1200. This would then be followed by a more significant decline into March that takes prices closer to 1000. A more bearish scenario would break below 1040 in October, perhaps below 1000, and then up to 1100 by November and down again below 1000 by early December. After a Christmas rally back towards 1050-1100, March 2011 would then see prices fall below 900. I would lean towards the bearish scenario as more likely, but we will have to see how much downside this Saturn-Ketu aspect generates in the next two weeks.
5-day outlook — bearish SPX 1100-1140
30-day outlook — bearish SPX 1000-1070
90-day outlook — bearish SPX 1000-1100
 The rally continued in Mumbai for another week as the main indices both crossed major thresholds with the Sensex closing over 20,000 and the Nifty over 6000 for the first time since early 2008. The Sensex gained more than 2% for the week and closed at 20,045 while the Nifty finished at 6018. This bullish outcome was a little disappointing since I had expected more downside, especially late in the week. Nevertheless, much of the week unfolded according to expectations until Friday’s rally. I thought we might get a significant gain early in the week on the Sun-Jupiter aspect and Monday’s prices rose almost 2% and Tuesday brought more follow through as the Nifty traded above 6000. After the run-up, we got some profit-taking as stocks fell modestly on Wednesday and Thursday. This also roughly corresponded to expectations as I had expected some giveback once the Jupiter energy had past. Friday’s gain was more puzzling, however, as I thought the approach of the Mars-Saturn aspect would tilt sentiment towards the bears. It was not to be. Instead, the absence of any exact malefic aspect allowed for more of that Jupiter influence to shine through. The Jupiter-Uranus conjunction became exact on 18 September and is still less than one degree apart. While it is weakening over time here, it obviously retains a significant amount of energy to lift the market. I frankly missed this possibility and did not properly allow for a bullish result for the end of the week. This continued strength of Jupiter challenges our bearish view of the market in the near term as it has yet to show much signs of weakness. The early week gains were the first sign that Jupiter was still a force to be reckoned with as gains came despite the fact that the conjunction was now past. Friday’s gain was also a sign that the bulls control over the market may linger a little while longer. This bullishness will be put to the test this week and into October as Saturn emerges as a key celestial player. Saturn forms an exact aspect with unpredictable Ketu this Monday (27 September) and this will be a crucial indication where the market will be heading for October and, indeed, for much of Q4. I had thought we would see more bearishness ahead of this aspect, but it seems that it may have to wait until after the aspect is exact before its effects will be felt. If there is no significant down move next week, then it would seriously undermine the possibility of a pullback in October. That said, I still think a pullback in October is the most likely scenario. After some kind of rally into early November, I am focused on the Rahu-Pluto aspect in mid-November as the next possible source of weakness. If this unfolds as expected, it could mark another significant down move that could last into early December. It is unlikely to be huge, but it could well be on the order of 10%.
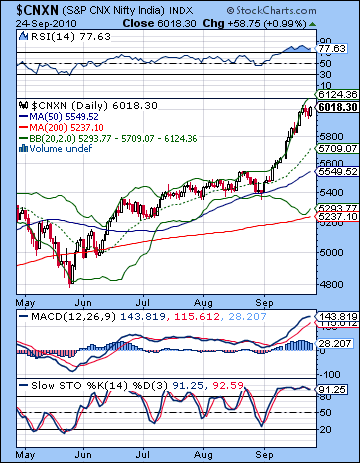
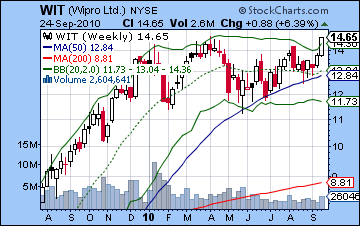
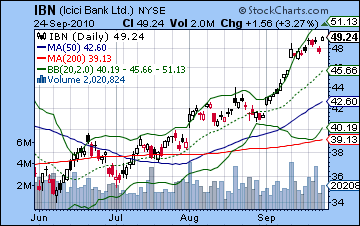
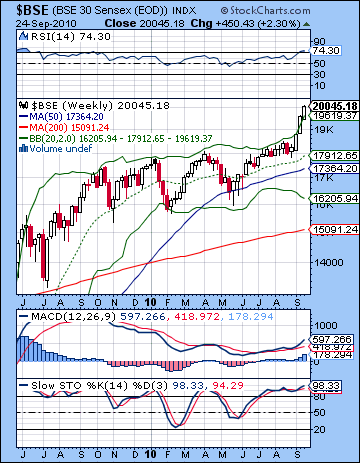 By most technical measurements, the Indian market is extremely overbought but few are prepared to call an end to the rally. As hard as it is to ‘catch a falling knife’, it is just as difficult to say when this near-parabolic rally rocket is going to turn around and come back down to earth. But it is important to remember that parabolic moves sometimes end in sudden and steep declines that mimic the intensity of their ascent. Its recent rise has been hugging the upper Bollinger band as all three moving averages are rising. RSI (77) is massively overbought and we can see the beginning of a negative divergence with respective to the early week high. Daily MACD on the Nifty is showing signs of rolling over here and the histograms are now shrinking as they often do ahead of a decline. Stochastics (91) are still overbought but do not show any divergences. Perhaps the most important technical point here is that the market is fast running up against its previous high in January 2008. There will be a lot of overhead resistance there as there are likely to be fewer buyers willing to assume the risk of taking prices to their all-time highs. Similarly, sellers may be motivated to take profits as we close in on the highs of 21,000 on the Sensex. The weekly technical indicators on the Sensex are also flashing a strong overbought signals as Stochastics (98) basically can’t go much higher and RSI (74) are also near the top of their allowable range. Weekly MACD is turning higher although it is in a negative divergence with respect to previous 2009 highs. A pullback to the middle Bollinger band around 17,000/5400 would be a fairly straightforward correction and a deeper correction would take prices down to the bottom Bollinger band at 16,200/4900. More immediate support would be offered by the previous resistance trendline now at 5700 on the Nifty. That will be the first line of the defense for the bulls in the event of a pullback. In the event of further gains, I would expect 21,000 to act as significant resistance. This translates to about 6300 on the Nifty. Meanwhile, ICICI Bank continued to make new highs for the year closing at 49 on the NYSE. While prices pulled back midweek, it did not fill the gap below 47. Although volume was strong, that gap is a weak price foundation for any rally going forward. From a technical perspective, it stands a good chance of being filled sooner rather than later. Wipro also gained last week but forms a double top with its April high. While recent strength has also come on good volume, the double top is a bearish pattern that invites sellers to take profits rather than risk further gains. This pattern is only rendered void upon a breakout above current prices. Overall, the technicals look overwhelmingly positive here although the parabolic nature of the September rally should be somewhat worrying to bulls. Many bulls would no doubt welcome a pullback for a normalization of the chart patterns and an opportunity to buy at lower prices. From a bearish perspective, the market needs time to break down, both in terms of forming divergences on the various momentum indicators (RSI, MACD) and also reversing the direction of some of the moving averages from up to down. Until that happens, corrections will continue to be bought and prices will stay high.
 This week introduces some potentially important Saturn energy into the mix as Saturn will aspect Ketu on Monday. This definitely has the potential to disrupt the rally since both Saturn and Ketu are considered malefic planets. At the same time, the bearish Saturn energy may not be released immediately on Monday. Just as we have seen with other close Saturn aspects, much of the damage may occur after the aspect is exact. This occurred on the Saturn-Uranus aspect on 26 April that initiated another leg down in the correction that continued into May. Of course, there is always a chance that the aspect may not manifest as expected. Jupiter in Pisces has been very strong lately, so we want to be modest in our early expectations here. That said, Monday has a good chance for a down day. Tuesday and Wednesday are harder to call owing to the lack of any clear aspects. The Moon is in Taurus which is often positive, but it’s not much to go on. Tuesday may be somewhat better than Wednesday. The end of the week is more likely to be negative and to feature a bigger down move because the Sun will conjunct Saturn on Friday. Actually the exact conjunction occurs before the start of trading Friday but it seems like it could be a highly significant pattern. By itself, this is negative influence, especially since the Moon will be in Gemini and thus falling under the aspect of Saturn. Friday is likely more bearish than Thursday, both the market will likely be net negative across both days. Overall, there is a very good chance for a down week, perhaps significantly so. However, I would note that there is a possibility that we may not see a big dip this week as the whole Saturn-Ketu decline may have to wait for the Sun to trigger it on Friday. If that happens, we could conceivably go sideways or even rise into Friday’s session which would then mark the top of the rally. I don’t expect this outcome, but it is a possibility worth considering, especially given this incredible September rally.
 Next week (Oct 4-8) is likely to be another negative week, and probably more so. Monday is likely to start negatively as Venus conjoins Mars. We could see a rebound on Tuesday or Wednesday on the Sun-Venus aspect but the end of the week looks quite negative again as Mercury conjoins Saturn on Thursday and Venus turns retrograde on Friday. These patterns could pack quite a punch and there is a chance of a significant decline. The following week (Oct 11-15) also seems bearish, although perhaps less so, as Mercury is in aspect with Mars late in the week. The midweek may be somewhat bullish in comparison. If the correction takes hold as expected, then there is a good chance it will run until the third week of October. Gains are likely on Monday the 18th on the Sun-Mercury conjunction so that could well mark the bottom. A significant rally is likely at the end of October and into early November. It is possible that we will go back towards current prices in a subsequent rally. November should be mixed but may weaken toward the end of the month with bearishness prevailing into December. Prices should rise again starting in mid-December and continue into the first week of January as Jupiter conjoins Uranus for the final time. At this point, Q1 2011 looks mostly bearish with March in particular standing out as especially negative. While 2010 has been surprisingly positive for Indian stocks, I am not optimistic about the prospects for 2011. After March, the period around May and June looks the most bearish.
5-day outlook — bearish NIFTY 5900-6000
30-day outlook — bearish NIFTY 5400-5700
90-day outlook — bearish NIFTY 5000-5500
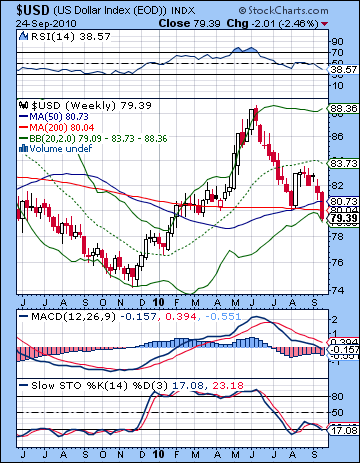 As Ben Bernanke reiterated his commitment to fight deflation in Tuesday’s appearance, the Dollar was widely dumped as investors feared further stimulus would be ultimately inflationary. The Dollar closed below the 80 level on the USDX for the first time since January. The Euro closed just a little below 1.35 while the Rupee finished the week at 45.2. While I wasn’t overly optimistic last week, I never would have expected the kind of selloff we saw here. The early week was bearish as I thought it might be as the Sun-Jupiter coincided with greater risk appetite as equities were favored over cash. More troubling was Friday’s plunge which took the Dollar below the crucial 80 level. This was an important support level in early August as well in March. Friday’s close broke below this support level and now the Dollar is in a kind of no-man’s land. From a technical perspective, it is very vulnerable to further declines here as it also closed below the 50 and 200 WMA, both around 80-81. It is at the bottom Bollinger band in the weekly chart so that is some consolation that perhaps declines will be muted in the near term. Stochastics (16) have slipped back into oversold although I would note a positive divergence with respect to the August low. MACD is falling below the zero line here and in a bearish crossover. We can nonetheless spot the beginnings of a positive divergence in the histograms which offers some hope for gains. Interestingly, we can also see a positive divergence in the daily MACD chart suggesting a reversal may not be far off. RSI (38) is bearish but has yet to reach oversold territory. One wonders if it will have to fall to 30 before buyers get serious again.
This week offers a better picture for gains as the Saturn-Ketu aspect is likely to create enough fear to drive some investors back into cash. This should be bullish for the Dollar. That said, I am less certain about the early part of the week as the more positive influences appear to congeal closer to Thursday and Friday. So it is possible we may see more downside in the early part of the week. And it is even possible that we could finish lower for the week since the early week declines may outweigh any late week gains. There is a good chance we will see further gains through much of October. These might be both sudden and sizable so it is difficult to say how high it could go although I am not expecting much. The Dollar is likely to weaken again going into November and we may well see lower lows. Some rally is likely going into January and this may even see a parallel rise with equities. Generally, 2011 looks bearish for the Dollar albeit with some important gains likely in May and June.
Dollar
5-day outlook — neutral
30-day outlook — bullish
90-day outlook — bearish
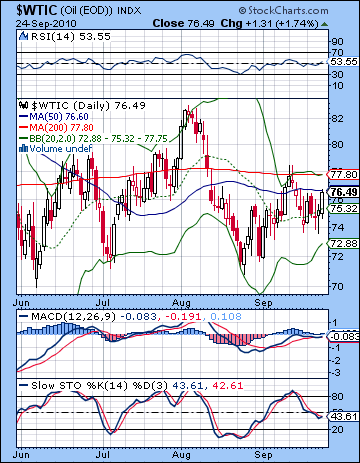 Crude oil futures rebounded strongly last week gaining more than 3% as it closed above $76 on the continuous contract. I thought we might see more downside especially later in the week. Monday saw an expected rise on the Sun-Jupiter aspect and then prices weakened as forecast until Friday’s turnaround. Despite the gain, the technicals remain weak on crude as prices are still below the 200 DMA and sitting exactly on the 50 DMA. Both of these averages are flat thus underlining the indecision in the current market. The 20 DMA is now rising and prices are drifting towards the top Bollinger band. MACD is flat and near the zero line and has a hint of a bullish crossover. Stochastics (43) have fallen off their recent perch but still have a ways to go before being oversold. Crude appears to be still working through that possible head and shoulders pattern on the August high. This would allow for a further rise to $80 before negating that pattern. Interestingly, we can discern a head and shoulders pattern in the RSI over the same time frame. It’s also worth noting that the shoulders and neckline are both sloping down, another indication for further weakness in the future. A break below current trendline support of $74 may push prices down to the May low of $68. Overall, the technical picture does not preclude further short term upside but it does not look sustainable given the resistance of the 200 DMA.
This week generally inclines towards the bears although there is a absence of clear aspects in the pivotal Futures chart that undermines that expectation somewhat. It seems very unlikely indeed that the Saturn-Ketu aspect would increase speculative demand for crude. And yet, Saturn is still two degrees away from making a very tense aspect with the natal Sun in the Futures chart. This is a strong sell signal for October and it could well get going this week, especially near the end of the week as the Sun conjoins Saturn on Friday. At the same time, there remains some element of ambiguity here this week so all outcomes are possible. The higher probability for declines begins late next week as Venus turns retrograde. The Saturn-Sun aspect is exact on October 15 so that is perhaps the most bearish time next month. There is a good chance crude will test support at $68 in the next three weeks and I would not rule out $60 either. A rebound rally is likely at the end of October and early November as Jupiter approaches its direct station. This looks like a substantial rally that could boost prices by 10% at least. The end of November looks bearish again as transiting Saturn afflicts natal Mercury in the Futures chart. This aspect is exact on Nov 25 although its maximum bearish effects could manifest at least a week on either side of this date. Prices should be mixed to bearish for the first half of 2011 with significant declines in March and June-July.
5-day outlook — bearish-neutral
30-day outlook — bearish
90-day outlook — bearish
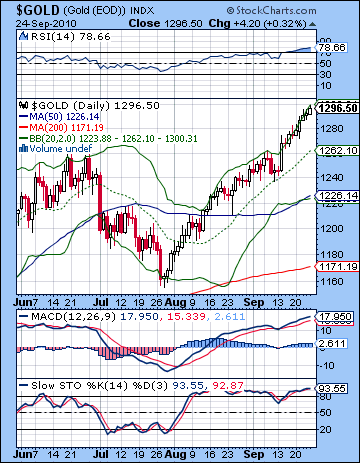 As the Fed talked up its plans to inflate the US economy regards of its impact on the currency, gold again took flight as it briefly traded at $1300 before settling at $1296. Certainly, the early week gains came as no surprise as the Sun-Jupiter aspect did its thing and sent bullion higher. What was more disappointing, however, was the absence of any kind of pullback the rest of the week. Gold has continued to rise despite the Sun’s entry into Virgo, a presumable bearish influence. This transit still has three weeks to go so I am not writing it off yet. After October 17, the Sun enters Libra a sign where it traditionally does poorly so that is another moderately negative influence for the next four weeks. But gold keeps rising nonetheless. Its stock chart increasingly resembles a runaway freight train as it rises relentlessly along the top Bollinger band. It is hugely overbought here as RSI (78) is getting up into nosebleed territory and daily MACD remains in a bullish crossover. Stochastics (93) are also overbought and show signs of a divergence with respect to the August high. The weekly chart also looks overbought as RSI is bumping up against the 70 line and Stochastics have moved over 80. Interestingly, MACD shows a clear negative divergence suggesting that the current enthusiasm will fade in the medium term. But gold fever may be resistant to technical indicators so there is no telling when the momentum will shift. The up move appears to have taken on a life of its own on the emerging belief that the US Dollar is destined for the scrap heap through devaluation.
This week offers another opportunity for bears as the Saturn-Ketu aspect comes exact and the Sun conjoins Saturn on Friday. It is possible we could see gold extend its winning streak into Wednesday although I am agnostic about the early week period. The late week will be fascinating to watch as the Sun lines up with Saturn. By rights, this should be bearish for gold as Saturn confers caution. This could therefore begin a significant correction that could last through October. A more bullish scenario would have gold continue to stay firm until October 8 and the start of the Venus retrograde cycle. This is another potentially bearish influence over the next month. I am quite confident in a retracement sometime in the next four weeks but somewhat less certain about when it will begin. Gold prices should stay mixed with possible downward moves into mid-December. Post-correction rallies may be significant but it is unclear if we will see substantial new highs in Q4. I would tend to think we won’t. A year end rally is quite likely as Jupiter conjoins Uranus and this should lead to a price spike into early January. Gold may be range bound through much of Q1 2011 as there are a couple of negative patterns here that should offset any upside.
5-day outlook — neutral
30-day outlook — bearish
90-day outlook — bearish-neutral