- Strong positive and negative influences this week; weakness to continue after US midterm elections in November
- Dollar may bottom here; gains more likely towards the end of the week
- Crude oil see price swings in both directions; correction below $70 likely in November
- Gold very mixed this week, with chances of declines increasing the through November
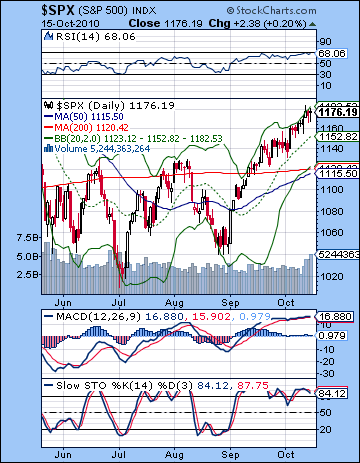 The QE2 rally dragged on for another week on further Japanese easing and reassurances from the Fed that it would do whatever is necessary to prevent systemic deflation from taking hold. The Dow closed near its high for the week at 11,062 while the S&P500 finished at 1176. This bullish outcome was disappointing to say the least, as I had hoped we would see more gravity-driven selling in the wake of the Venus retrograde station on October 7. Instead, stocks edged higher as the expectation for limitless Fed stimulus seems to have relegated all other concerns to the background. Liquidity uber alles. Not even two solid Mars aspects last week could shake the promise of more free Bernanke pesos. Monday’s Sun-Mars aspect was a dud as stocks were mostly flat and therein lay the recipe for another week where sellers refused to sell and buyers continued to be drawn in on the dips. The gains on Tuesday and Wednesday corresponded nicely with the bullish Venus-Uranus aspect so at least that was somewhat expected. But we seem to still be following the more bullish play book here as bulls insist we are driving towards new rally highs of 1250. As if to make sure bears didn’t get any fancy ideas of turning this ship around any time soon, the late week Mercury-Mars aspect barely registered as a hiccup. Thursday and Friday saw some intraday selling but buyers moved in both days before the close and took prices back towards their highs. Needless to say, this rally has gone on much longer than I had anticipated. When I first looked at the planetary situation for Q4, I thought there was a good chance we would see a continuation of the correction that began in the late spring. My original thinking was that it would begin sometime after the Jupiter-Uranus conjunction in mid-September, perhaps starting in earnest in late September or early October around the Saturn-Ketu aspect and the Venus retrograde cycle. I also found some corroboration of my expectation for lower prices by the Rahu-Pluto conjunction in November and several important afflictions in the horoscopes of the NYSE and NASDAQ charts. The rally appears to be running on fumes at this point, and those chart afflictions are still out there waiting, probably due to manifest more forcefully in November. The extended rally here has been pretty frustrating but it has not fundamentally changed my views on the market for this quarter. Nonetheless, my failure to see the market going to its current lofty levels (Dow 11,000) means that downside targets have to be raised accordingly. That said, there is still a good chance for a 15-20% correction at some point in Q4. It could be both greater or less than that, but there seems to be enough bearish planetary ammo here to take prices down more than a more middling 10%. And just to outline things a bit more, I think the market will be hit with another major corrective wave in Q1 2011. As a ballpark figure, this may have a similar scale as something we see in the fall, although there is some reason to think it will be larger.
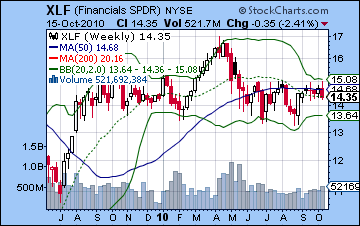
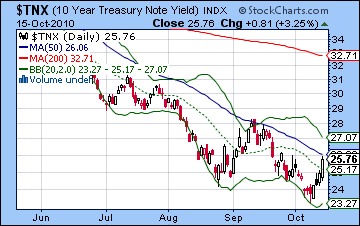
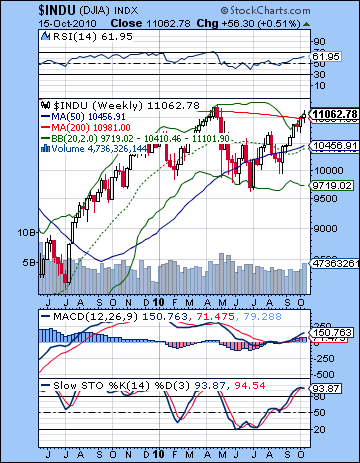 The technicals continue to flash overbought signals as it pushed higher. So much for technical indicators. The market seems to be very near some key inflection points here as the S&P is sitting right atop some key trendline resistance levels dating back to the 2007 top. It is also at the same level stocks bounced back to after the flash crash. A close above 1180 would almost certainly invite a run to the April high of 1220. It could conceivably follow that unlikely script, although it would require some major goosing from Bernanke and Blankfein. Price is riding the upper Bollinger band and seems overdue for a pullback at least to the middle line (1150) and perhaps more likely to the bottom line near the 50 DMA at 1115. When price drifts this far above the 50 DMA, there is an increasingly likelihood that it will return to the 50 DMA sooner rather than later. It often over shoots on the downside, of course, and that is very possible this time around. We saw an interesting rise in volume towards the end of the week suggesting that perhaps a larger move may lie in the near future. The Dow’s volume spiked Friday and given it closed in the red, that is a bearish sign. Some people are looking to get out of this market before something goes wrong, either with QE2 or the emerging currency war that threatens to upset the fragile recovery. MACD is still in a bullish crossover but it seems a hair’s breath away from rolling over very soon. This week? Next week? From a technical standpoint, all one can say is that it will rollover sometime in the coming weeks. RSI (67) is just off its recent high of 70 and remains dangerously overbought and showing a negative divergence. Stochastics (84) are much the same story and show similar divergences with respect to recent highs. All in all, these indicators do not paint a picture of a market anyone in their right mind would want to buy with any force. The banks (XLF) are bleeding a deep red now that the foreclosure crisis has entered a new, scary stage. What then is the bullish case? It’s possible Bernanke could come out and announce that the Fed is going to buy stocks but in the current political environment, that seems extremely unlikely. Perhaps the announcement of a new round of quantitative easing exceeds even the inflated expectations of the market ($2 Trillion?). This would completely devastate the Dollar and one would think that would ultimately undermine the appeal of all US assets including stocks. Bernanke is also staring down the barrel of some stark choices now as Thursday’s action foreshadowed his nightmare scenario where all US assets were falling in tandem: stocks, dollar and treasuries. If the Fed is intent on buying back more treasuries and injecting more liquidity into the system, it will have to pay attention to the problem of rising treasury yields. Yields climbed significantly again this week and the Fed runs the risk of creating conditions for further increases whereby foreigners proceed to summarily dump them. With rising US government debts, the last thing the Fed wants is rising yields which will surely choke off any chance for recovery and will likely increase unemployment very quickly. In order to keep yields low, Bernanke may have no choice buy temporarily remove some liquidity from the system. Of course, this will be bad news for the stocks which have grown accustomed to a never-ending flow of free money from the Fed. There is growing talk that the Fed will keep pumping money into the market until the midterm elections on November 2. The key FOMC meeting occurs the next day so many observers are wondering if the selloff will begin at that time, either on the news of a new round of stimulus measures ("sell the news") or perhaps through a surprisingly good electoral showing by the bailout-hating Republicans. Of course, if everyone believes that scenario, that’s the reason it probably won’t happen. There may be some participants who will choose to forgo the last two weeks of any rally and try to exit the market before the election and the next FOMC meeting. This seems more plausible to me, although either way, it’s important to grasp there are plausible political reasons for the market to correct here. This helps to confirm both the technical and astrological indicators. Nothing is certain, but confidence in outcomes can be increased where signals reinforce each other.
 This week offers a curious mix of positive and negative aspects. Most of the short term aspects here look bullish. The early week in particular has an impressive parade of contacts involving the Sun, Mercury, Jupiter and Uranus that has all the markings of significant gains. Wednesday’s Mars-Jupiter aspect also tilts towards the bulls, as previous contacts between these planets have resulted in gains. For the bearish side, the late week period looks more bearish as Venus is in aspect with Saturn on Wednesday and especially Thursday. Friday’s Mars-Neptune square aspect is also bearish. So there is evidence here to suggest more upside on Monday and Wednesday, and maybe even Tuesday. And yet, some of the other chart indications look more disturbed, as if there could be significant declines mixed in here. It is important to remember that sometimes "good" aspects go bad and can become corrupted when other factors medium term factors obtain. The trouble is nailing down the timing of these medium term influences is more difficult. For that reason, one has to anticipate the bullish outcome here but at the same time be prepared for more downside. Obviously, this isn’t very helpful in terms of a forecast but I wanted to depict the extent of the uncertainty here as transparently as possible. Since next week looks more solidly bullish, I am reluctant to place too much confidence in a bullish forecast this week. Sure, the market could simply continue to rise right into the election but I don’t think it will. A more likely scenario would be some kind of sudden selloff here that precedes next week’s rebound attempt. A bullish scenario would therefore be a gain Monday followed by a decline Tuesday and then another gain Wednesday perhaps putting the S&P up near the 1200 level. This would then be followed by profit taking in the late week that might return it to 1180-1190. A more bearish scenario would see some of these corrupted good aspects turned around and we get a steep selloff Monday or Tuesday on bad earnings reports (BAC?) that carries through much of the week and we see the S&P trade near 1120-1150 at its lowest point. Admittedly those are widely divergent scenarios but it could break either way. I am leaning towards the bearish scenario, although the bullish outcome would not surprise me either. If we do end up higher, then it merely concentrates the down move more tightly in the post-election period.
 Next week (Oct 25-29) generally looks more positive as we have two bullish conjunctions. Mercury conjoins Venus just before the start of Monday’s session while the Sun conjoins Venus on Thursday. This should produce at least two up days near their day of exactitude, and perhaps more. If we get a preceding selloff, then the chances increase for some kind of rebound rally. Generally, the late week period here looks more positive. November looks more bearish, however, as the possibility of early week gains will be offset by selling around the 4th and 5th. I would expect this to start another leg down which may culminate in the middle of November, perhaps near Nov 15-19. This coincides with the end of the Venus retrograde cycle and the end of the Jupiter retrograde cycle. We could see a rebound for the next two weeks but another significant dip is likely in early December. Since this December bearishness only seems to last a week or so, it may not be a lower low than anything we see in November. Look for a good rally after about December 10th which should continue into at least Christmas. I’m seeing some conflicting indications now about how long this December rally lasts. Some charts suggest heavy selling between Christmas and New Year’s while other charts have the rally lasting all the way into the first week of January. I hope to clarify this discrepancy in future newsletters. Generally, though, prices should fall in the second half of January and into February. Q1 looks quite bearish so it definitely has the potential to be a deeper decline that anything we get in Q4. In other words, there is a good chance for a lower low by March.
5-day outlook — bearish-neutral SPX 1120-1190
30-day outlook — bearish SPX 1000-1100
90-day outlook — bearish SPX 1050-1150
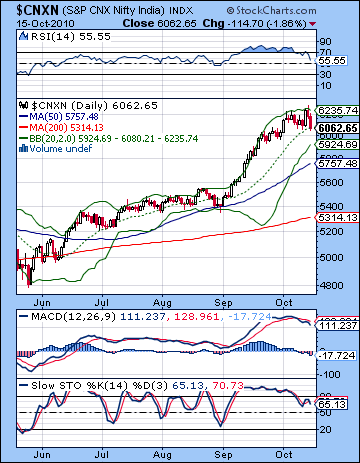 Stocks in Mumbai staged a modest retreat last week on concerns over the rising Rupee and profit taking ahead of the imminent IPO of Coal India this week. After surging on Wednesday, the Sensex lost about 0.5% for the week and closed Friday at 20,125 with the Nifty finishing at 6062. While I had been bearish in last week’s newsletter, the decline here was frustratingly small. Malefic Mars carried the day here, but only barely. I had expected more downside early on the week on the Sun-Mars aspect but the market was only fractionally lower on Monday and Tuesday. Clearly, Jupiter continues to support sentiment while Saturn has yet to make its presence felt. The midweek rally arrived more or less as expected on the Venus-Uranus aspect, although the size of the gain was a little surprising. Fortunately, the end of the week turned out mostly as anticipated as the Mercury-Mars aspect took prices lower on both Thursday and Friday. I had also expected Friday to be the worst of the two days, so that also conformed with the forecast aspect between Mars and Ketu. The weakness at the end of the week offered some evidence for the bearish effects of the Venus retrograde cycle (7 Oct-18 Nov) although the midweek rise simultaneously seemed to undermine that hypothesis. I had thought there was good reason to expect the reversal in the direction of Venus on 7 October might correspond with a reversal in the direction of the market. While the midweek highs came after this cycle pivot date, they may still be seen as "close enough" if the market continues to correct from here. I still think a correction is the most likely scenario here, although it now seems as if it will be protracted into November. As mentioned last week, the US midterm elections loom large in this respect. With Republicans likely making gains at the expense of Obama’s Democrats, further bailouts and fiscal stimulus measures will become less politically viable. Much of the recent rally in the US and around the world has assumed a never ending flow of cash infusions from Bernanke’s Fed. If these are called into question, then equities may suffer the consequences as liquidity is tightened. Many observers are therefore expecting US stocks to stay high until the election of 2 November and the Fed meeting of 3 November when Bernanke could announce the next round of quantitative easing — so called QE2. This scenario assumes that the actual stimulus measures may disappoint in some way and/or the market merely sells the news as if often does. But this notion of a post-election market selloff is now so widespread that one wonders if the selling may actually precede the election. It’s quite possible. If the selling is sharp enough, then it could bring down Indian stocks along with it regardless of domestic market conditions.
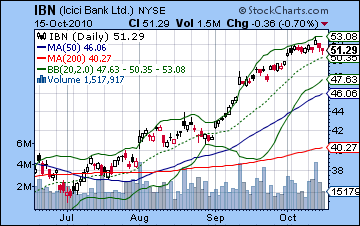
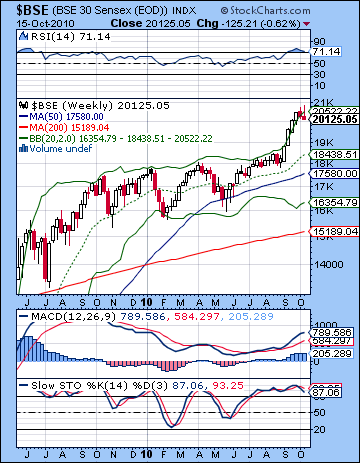 Market technicals deteriorated substantially last week as several indicators now look bearish. Daily MACD on the Nifty has rolled over and is now showing a bearish divergence. Stochastics (65) has fallen out of the overbought area and still exhibits a clear negative divergence with respect to the October levels. RSI (55) is looking very weak indeed as its negative divergence also appears to be playing out. Smaller corrections tended to stop around the 50 line so we will have to see if this one does, too. A trip all the way down to the 30 line would likely represent a correction greater than 10%. Friday’s close took prices to their lowest level yet in October, very close to the 20 DMA and middle Bollinger band. This would represent a very shallow correction in the midst of a strong bull rally. A deeper correction would pullback to the bottom BB line, now around 5900 on the Nifty. As a rule, when rallies get overextended they will tend to pullback to at least their 50 DMA before resuming any upward move. Since price has moved well above the 50 DMA in recent weeks, it is not unreasonable from a technical perspective to expect price to correct back to the 50 DMA at 5750. This would be a fairly critical technical support level since it would coincide with the top of the rising channel dating back to 2009. It is critically important for market bulls that this breakout level not be violated to the downside or else it would invite further selling and lead to the conclusion that the September bullish breakout was unsustainable. While this would take some of the shine off the current rally, it would not remove the basic bullish case for Indian markets since it would leave the rising channel of higher highs and higher lows intact. This rising channel support lies around the 5000 level on the Nifty and 16,000 on the Sensex. As long as this level holds, the medium term bullish view is still viable. Even with a correction likely in Q4, it is not at all clear that there is enough pessimism — either technical or astrological — to generate enough selling to challenge these levels at this time. We may have to wait until Q1 2011 for this rising channel to be more seriously tested. The weekly chart on the Sensex confirms the vulnerability of stocks at this time as this week’s candle is an inverted hammer. RSI is pointing down now although it remains in overbought territory. More ominously, we can clearly see a possible double top in the RSI dating back to the May 2009 peak. It is hard to imagine how the market can rally much further above current levels in the near term, especially given the close proximity of the all-time high. Price has formed a de facto double top here in October, so that bulls may be wary of attempting to go the final 3% lest they risk declines from weaker bulls who have chosen to take profits. Overall, the technical picture does not favour the bulls and assuming further risk on the long side. The upside potential is just too limited. While another rally attempt to 21,000 on the Sensex is still possible, a higher high seems unlikely. ICICI Bank (IBN) shows how the weakness is manifested in the financial sector. Interestingly, volume declined during the late week selloff so that is one clue that Indian financials may be in better shape than their US counterparts. The reduced volume also reflects the relative bullish sentiment in the US for the Indian economic story.
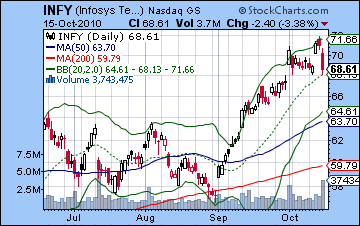 This week features a high number of aspects that could move the market in both directions. The early week tilts towards the bulls as the Sun-Mercury conjunction will pick up some Jupiter energy on Monday. On Wednesday, the Moon and Mars both comes under the aspect of Jupiter and also increases the likelihood of a positive trading session. Tuesday could conceivably be a down day although that is very hard to call. Generally the late week offers more chances for declines as Venus is in aspect with Saturn. These short term aspects appear to favour a rise overall, but the medium term influences are more equivocal and may undermine the ability of some of these positive aspects to deliver the goods. For this reason, I am unsure how the market will fare this week. A bullish outcome would not surprise me in the least, but the forces are gathering to take the market lower so a sudden plunge is also on the cards. A bullish scenario would see Monday higher with some pullback Tuesday and then higher still on Wednesday, perhaps back to 6200. This could conceivably test last week’s high. The end of the week would see profit taking again and take the Nifty back to around 6100. A more bearish scenario might see a gain on Monday but then have it all taken away in Tuesday’s session and then a modest gain Wednesday followed by sharper selling by Friday with a close somewhere around 5900. Both scenarios are possible although out of deference to the rally, I would slightly favour the bulls here. It is important to remember that even if the bulls have their way and keep the rally intact through all of October, it will merely delay the inevitable and condense the correction into a narrower time frame in November.
 Next week (Oct 25-29) looks mixed although we may see the bears prevail. The early week looks positive on the Venus-Mercury conjunction and then some profit taking is likely. Thursday’s Sun-Venus conjunction is also likely going to swing towards the bulls but Friday could be problematic. The following week (Nov 1-5) looks more clearly bearish especially towards the end of the week. Significantly, this will be after both the US elections (Tuesday) and the next Fed meeting (Wednesday). I would therefore expect a selloff at this time. Prices should fall into mid-November with an interim bottom possible around the end of the Venus retrograde cycle on 18 November. Interestingly, Jupiter will end its own retrograde cycle just one day after Venus. Since both these planets are considered positive, their near simultaneous reversals is definitely a possible turning point in market direction. Prices should then climb through the end of November but we could see another significant dip in the first week of December. This seems unlikely to take out the mid-November low, however. Stocks should resume their upward climb again by 10 December and this may continue until at least the last week of December and perhaps the first week of January and the Jupiter-Uranus conjunction. Another bearish phase seems likely in January. Whether this is a temporary dip with more sideways movement or the start of a prolonged decline into February and March remains to be seen. Certainly, the Jupiter-Saturn opposition in March seems bearish and tips the scales towards the bears for Q1 as a whole. If the Nifty has managed to hold onto 5000 by December as it might, the first three months of 2011 look bearish enough to decisively break that level on the downside. This view assumes that the Nifty does not rally all the way back up to 6200 by early January. It’s possible it could achieve that level once again, but it seems unlikely. My sense is it will form a lower high in January 2011 before falling sharply into March.
5-day outlook — neutral-bullish NIFTY 6000-6200
30-day outlook — bearish NIFTY 5200-5500
90-day outlook — bearish-neutral NIFTY 5500-6000
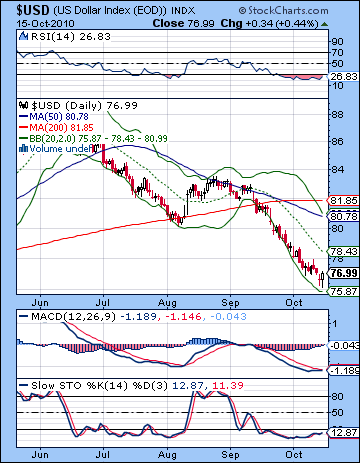 The Dollar continued to be the ugly duckling of world currencies last week although the pace of decline slowed as it closed just below 77. The Euro closed just a hair under 1.40 while the Rupee ended the week at 44.2. I had been fairly equivocal about the Dollar’s chances last week although Monday’s Sun-Mars aspect did provide a small lift, as did Friday’s Mercury-Mars aspect. In between, however, the greenback suffered the slings and arrows of misfortune from the Venus-Uranus aspect. The technical picture shows definite signs of life, however, as Friday’s gain produced a hammer candlestick, signalling a reversal might be imminent. Price has also started to pull away from the bottom Bollinger band line. The end of the week intraday lows also came very close to touching the long term support line at 76.5 thus providing some evidence that an interim bottom has either been reached or is very close. Daily MACD is now flat and on the verge of a bullish crossover while Stochastics (12) are inching higher and showing a positive divergence over the past week or two. RSI (26) also shows a positive divergence as it has moved up from its recent journey to the abyss. The weekly chart looks utterly forlorn as Stochastics may have bottomed out at 4 (!) while RSI (32) edges closer to the magic number of 30. If RSI was at 30 already, one would be tempted to say a reversal was more likely. Another week of bobbing and weaving may have to be endured in order for this momentum indicator to hit rock bottom. As bearish as the weekly MACD is, it is still in a positive divergence with respect to the late 2009 low. It’s not saying much for the Dollar, but at least its something.
This week looks pretty mixed with the early week looking a little shaky but the late week offering a better opportunity for gains. Dollar gains are also possible on Tuesday as it is sandwiched in between patterns that will likely see risk appetite increase which ought to favour the Euro. Overall, there is a chance the Dollar will chalk up a gain here, although it is still unclear. The following week also seems middling at best with aspects that could continue to batter the Dollar. The difficulty is that some positive medium term influences ought to be taking hold very soon. Hopefully they will begin to outweigh the short term aspects and begin to lift the greenback. While I am generally bearish on the Dollar over the next 6-12 months, I think there is a very good case for a technical bounce here as we head into November. It could rise anywhere from 80 to 85 before falling again starting in December. Then we can expect another decline into January, followed by another brief rally into perhaps February. Rallies will likely be shorter in terms of time and perhaps smaller in scale than declines here and should be seen as exit opportunities. 2011 looks generally bearish with a very good chance of breaking below the previous low of USDX 71 with some recovery possible in 2012 and 2013.
Dollar
5-day outlook — neutral-bullish
30-day outlook — bullish
90-day outlook — bearish
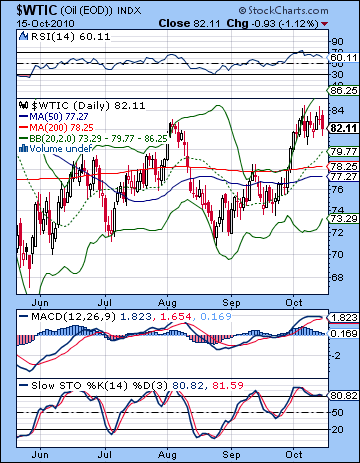 Despite the Dollar’s continued weakness, crude oil slipped last week closing just above $82 on the continuous contract. While I was bearish, this decline was tiny compared to what I thought we might see. The contours of the week fell in line with the forecast as there was modest weakness at the beginning and end of the week and a midweek rally. Thus far, the short term aspects continue to dominate the oil market while the more negative medium term influences have yet to make an appearance. Crude looks toppy here as we have seen a number of inverted hammers lately, all signs that a pullback may be in the offing. Bulls are starting to lose their conviction as the intraday gains do not hold by the close and price stays $84. We can see some clear divergences in the indicators here as RSI (57) has fallen from the overbought zone while price remains high. Eventually price will have to catch up. Price backed off the upper Bollinger band line this week and this may presage a retesting of the support levels at the bottom line around $73. At minimum a return to the 50 DMA at $77 seems probable as crude remains in a price purgatory where all moving average converge as participants await the next major move. MACD reinforces the idea that the next move will likely be down as it is rolling over but has yet to crossover. Stochastics (79) are showing a clear divergence and have fallen from their highs. Clearly, the momentum has slowed. And yet bulls can rightly point to the fact that the 50 and 200 DMA are still rising, although the 50 is still below the 200, a bearish set up. Perhaps a golden cross of the 50 and 200 DMA might bring in more buyers.
This week presents a jumble of influences at work that could move the market sharply in both directions. The difficulty lies in separating these tightly packed aspects. Monday’s Sun-Mercury-Jupiter looks very bullish although it suffers from a negative contact with Mars in the Oil Futures chart. It is possible that Monday will see a rise followed by a sharp selloff on Tuesday. Transiting Saturn’s aspect to the natal Sun in the Oil chart is also quite bearish but this medium term influence has yet to have much effect as prices have remained within a trading range. Wednesday looks more reliably bullish as both the Moon and Mars come under the helpful aspect of Jupiter. The late week period looks somewhat less positive and could well be negative on the Venus-Saturn aspect. There are influences pushing prices in both directions here with the short term aspects lining up towards a gain but the medium term influences pushing sentiment down. I would not be surprised to see a major selloff although the indications are far less clear than I would like. Next week looks somewhat more positive but November looks quite bearish as the transiting Saturn lines up against Mercury in the Futures chart.
5-day outlook — bearish-neutral
30-day outlook — bearish
90-day outlook — bearish-neutral
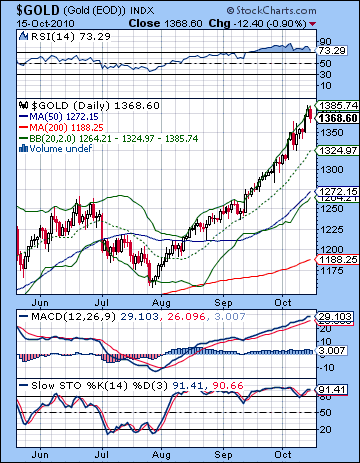 With more talk of global currency wars and the Fed’s sacrificing of the Dollar, gold took flight again last week and closed near $1370. While I called the midweek rise on the Venus-Uranus aspect and Friday’s negative session, the early week Sun-Mars aspect did not take prices lower. The bulls remain firmly in charge of this market. I had thought we might have peaked near the start of the Venus retrograde cycle on October 7 but that seems to have gone by the boards now as price continues to march higher. The technicals are still very positive here but there are growing signs that some kind of correction is required before gold can resume its upward climb. The longer it goes without correcting, the more disorderly a decline may be. RSI (73) on the daily chart is slumping a bit here and now shows a negative divergence. MACD is still in a bullish crossover, however, and Stochastics remain overbought. More bearishly, Friday’s red candle was a bearish engulfing candle with respect to Thursday’s candle. This is a bearish signal that sellers may be gathering steam in the near term. Price continues to hug the upper Bollinger band but a correction at minimum would take it back to the middle line at $1324. A deeper correction would take price down to the bottom line at $1264. This would also roughly correspond to the 50 DMA and also falls close to the breakout level. If gold were to fall to this level, it might be a decent entry point for a long position, assuming that technical and fundamental indicators concurred. The weekly chart looks very overbought as RSI and Stochastics are in the stratosphere. When daily and weekly charts are this overbought it is definitely not a good time to go chasing price and entering long positions. That said, gold has punched through resistance on the wedge pattern. Perhaps it can eventually work its way to the top of the rising channel at $1450-$1600, depending on when it gets there. A break below support in this rising channel at $1250 would be a serious blow gold bulls. No doubt it would bring in a lot of new money buying the dip.
This week offers yet another opportunity for a pullback as the Sun enters Libra on Sunday. The Sun is said to be debilitated when it transits this sign and given its symbolic association with gold, it slightly increases the chances for a correction over the next four weeks. Admittedly, this is not a strong influence but it adds a little more weight to the bearish astrological case. But the short term aspects here look generally bullish again so it remains to be seen how much weight some of the medium term bearish aspects actually have. Monday’s Sun-Jupiter aspect looks quite bullish, as does Wednesday’s Mars-Jupiter aspect. Other days may be less positive, especially towards the end of the week as Venus is in aspect with Saturn. While the up days may still be strong, there is a greater chance that the down days will also feature big moves. Friday may be the most bearish day on paper in this respect. Next week could be a make or break sort of week as the Sun-Venus conjunction occurs in a bad place in the GLD chart. Normally this is a very bullish conjunction but its placement in the sky would appear to be problematic. As time goes on, the greater the chance that the medium term bearish influences will finally take over. November also looks bearish with a possible low around the Jupiter direction station on November 19. December may be more bullish as Jupiter moves towards Uranus finally conjoining in the first week of January. Gold should see another significant correction in January which extends into February. Just where it is at this time is anyone’s guess. My sense is the Jan-Feb correction will be deeper than anything we see in the next six weeks.
5-day outlook — neutral
30-day outlook — bearish
90-day outlook — neutral-bullish

