- Gains probable Monday followed by significant declines midweek; some recovery likely by Friday
- Dollar mixed with gains more likely midweek
- Crude prone to declines by midweek
- Gold to have large price moves in both directions; midweek decline likely
- Gains probable Monday followed by significant declines midweek; some recovery likely by Friday
- Dollar mixed with gains more likely midweek
- Crude prone to declines by midweek
- Gold to have large price moves in both directions; midweek decline likely
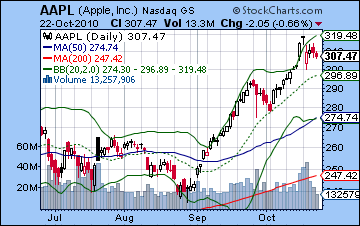
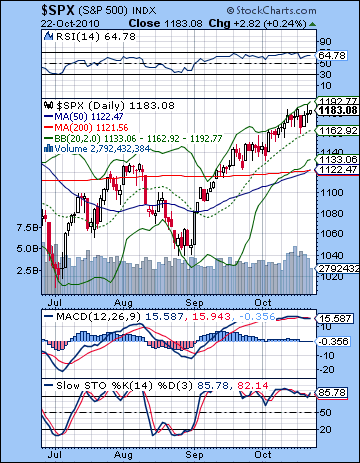 Stocks edged higher last week on more positive earnings and the increased likelihood of fresh stimulus from the Fed. Despite Tuesday’s significant decline, the Dow closed less than 1% higher at 11,132 while the S&P500 finished the week at 1183. I had been of two minds in last week’s newsletter given the close proximity of positive and negative aspects. I thought we stood a fair chance of a down week overall but ultimately the late week period was less bearish than expected. The rest of the week shook out more or less according to expectations. Monday’s Sun-Jupiter aspect coincided with a decent gain while Tuesday’s decline also conformed with bearish expectations in the wake of the previous aspect. I didn’t quite expect it would be so large, however, although the downside was a pleasant surprise given my generally bearish outlook. Wednesday’s solid gain also arrived more or less on schedule as the Mars-Jupiter aspect encouraged more risk taking. But the late week Venus-Saturn aspect didn’t amount to much at all, as Thursday was flat, albeit with some significant intraday selling, and Friday was also mostly unchanged as the Dow was slightly lower and the S&P slightly higher. Overall, it was more of the same as the pre-election QE2-driven rally stayed afloat. The market seems overextended here by most measures and we may be seeing increasing signs of topping. Market leaders such as Apple reported earnings last week and sold off. It is now below its recent highs while the overall indexes are still trading at their highs. This may be seen as a divergence of sorts. The market appears to have discounted the Republicans taking back the House and only a surprising GOP takeover of the Senate would spark any selling in the wake of the election on November 2. I don’t think that is particularly likely, so it seems that the key factor will be the FOMC meeting on November 3. Remarks made this week by current and previous Fed bankers suggest that QE2 treasury buy backs may be smaller than many people expect with the emphasis being on smaller purchases instead of the shock-and-awe approach of March 2009. If that’s the case, then some investors may be disappointed. That is one very real scenario that could accompany a November decline. In any event, I still expect we will see a significant correction here in the coming weeks and it may be bigger than many people expect. Most observers, even bullish ones, are calling for "a healthy correction", with the obvious inflection point being the election. The bullish IHS crowd still have their hearts set on 1250 by early 2011 but acknowledge the need for some period of consolidation before the next leg higher. While I can see another bull move on the Jupiter-Uranus conjunction in December and January, I’m not at all convinced we will make new highs at that time. More likely, the correction in the coming weeks is larger than 10% and may well be on par with the May decline of 15-20%. Of course, that may mean that the July 2 low of 1010 is not taken out. Perhaps that will be a more compelling technical argument to bring in buyers in December.
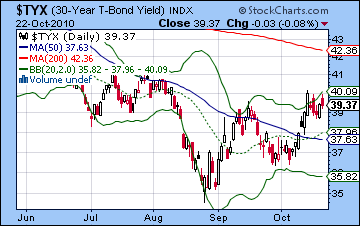
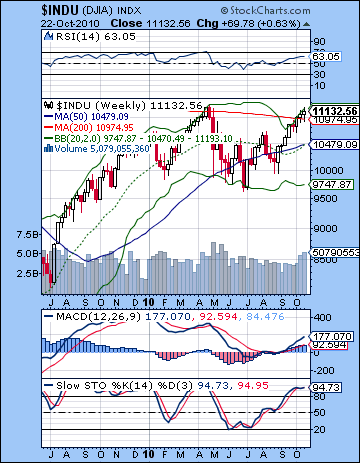 The market technicals look increasingly overextended here. The highest volume day last week came on Tuesday’s selloff — never a good sign. Daily MACD is now in a bearish crossover and well above the zero line, a classic combination for an approaching correction. Stochastics (85) remain as oversold as ever, and there is a clear negative divergence with respect to previous highs. Price bounced off the upper Bollinger band twice last week and continues to trade above the 20 DMA. The last time price was below the 20 DMA was way back on September 1. What a long, strange trip it’s been. And how overdue we are for a correction. To make things even more interesting we got a golden cross of the 50 and 200 DMA this week, a very bullish signal. Of course, these indicators are not infallible and in the short term often signal a reversal is at hand. The bearish death cross occurred in early July at the beginning of a significant bounce. So much for crosses. The bulls can point to the possibility of a breakout higher as the S&P is now actually trading above the falling trendline off the 2007 high. This is still small enough and of short enough duration that it may be seen as a potential fake out, but it is nonetheless further evidence of the strength of the bulls here. There should be a lot of resistance at 1190 and higher while support is likely to be found around the bottom Bollinger band at 1130. Significantly, this is close to the 50 DMA and the peaks in June and August around 1120. A pullback to 1120 would therefore be a fairly timid and ultimately bullish affair as bulls would then rush in a buy the market in the hopes for that 1250 level in the IHS promised land. The Dow weekly chart shows price running up the upper Bollinger band and we also have a variety of indicators that suggest an overbought condition. Perhaps more important is that the Dow traded at its April high last week thus creating the dreaded double top pattern. This is a bearish pattern that features significant resistance at prices higher than the previous top. As a possible sign of a narrowing of the rally, the wider indexes like the S&P and NYSE Composite remain below their April highs. The Dow chart is interesting because we can examine the differences between the run-up to the April high and the current high. Both MACD and RSI are now lower than their April levels, showing that the current rally is probably not going to be able to sustain this momentum. Also we can see that the Feb-April rally moved up against the top of the Bollinger band, much like the current rally. The yield on 30-year treasuries rose again last week as the bond rally seems all but over. Even since news of the QE2 was leaked in early September, yields have moved higher in anticipation of greater inflation and a weaker dollar. As yields climb, there may be a move out of treasuries as more investors decide the risk isn’t worth it. This could be very bad news for Ben Bernanke as it would raise borrowing costs on the burgeoning US debt. In the event that yields continue to rise, the Fed may be forced to remove liquidity. This would be negative for stocks since the rally has relied upon the constant injections of POMO liquidity for its fuel.
 This week could see some big moves in both directions as we will have not one but two conjunctions involving the planet Venus. Venus is a bullish planet and I do expect some upside from both of these patterns but there is a certain wild card element here since they will occur while in aspect with Ketu, aka the South Lunar Node. Ketu can bring surprises and disruption of the status quo so we cannot rule out any outcome here. I have generally been bullish on the last week of October although the Ketu caveat reduces the probability of the gains somewhat. Venus conjoins Mercury on Monday so there is some positive energy in play there that could translate into a gain, at least in the early part of the day. As we move into midweek, however, there is a genuine possibility for a large move lower as the Sun comes under the aspect of Ketu. This is exact on Wednesday, although it could conceivably manifest a day before or after. I would also note that we have the potential for some significant Saturn energy here (= pessimism) due to its aspect with Mercury on Wednesday. Also there is a weak but exact aspect between Saturn and Neptune that opens up the possibility for a larger decline than would not otherwise be the case. I’m not confident it will arrive this week, but it might. Certainly, the medium term influences look increasingly bearish here so it’s really a question when they decide to manifest. It could be as early as this week or we may have to wait until next week and the FOMC meeting. Thursday looks more bullish, however, as the Sun conjoins Venus. It’s possible this could shade over into Friday and create a positive close to the week but I suspect that if Thursday is higher, then Friday will be lower in the aftermath of the conjunction. A bullish scenario would be a positive close Monday and a test of 1200 by Tuesday and then some selling midweek followed by strength towards Friday that keeps prices at or above current levels, say between 1180 and 1200. A more bearish scenario would be a rise at Monday’s open followed by a flat or negative close. A midweek selloff then takes prices down to 1160-1170 and we get only one rebound day on either Thursday or Friday and close lower overall. There is really a good case for both outcomes here although I would lean slightly towards the bearish outcome due to the shiftiness of Ketu. Nonetheless, there is good reason to expect two up days here.
 Next week (Nov 1-5) looks more reliably bearish as there is a difficult Mars-Ketu aspect midweek. In advance of this aspect, we could see stable or slightly higher prices on Monday or Tuesday. A gain is likely on Thursday’s Mercury-Jupiter aspect, and Friday looks more middling. There is the chance of a large move lower here, especially on Wednesday, Nov 3. The following week (Nov 8-12) features the Rahu-Pluto conjunction on Tuesday which also tilts towards the bears. Friday’s session looks somewhat more negative than the others. November generally looks bearish and is the most likely manifestation of the bearish medium term influences for Q4. Jupiter ends its three-month retrograde cycle on Nov 18 and Venus does likewise the next day on Nov 19. This should be seen as a potential interim low in the market. There is a possibility that the down trend could extend into early December but this is less likely. There should be some kind of bounce in the two weeks following these planetary reversals and then another smaller move lower from Dec 5-12. The Jupiter-Uranus conjunction is likely to take stocks higher through the balance of December and into early January. This rally should run out of gas in January and we will see another move lower into February. I am again expecting at least a 15-20% move lower here, perhaps more. After making a possible low in March, another rally is likely to take shape and last well into July. This should be quite significant and may be enough to erase losses from the previous decline. It is difficult to say where the market will be by July, although I would guess somewhere between 1000 and 1100 on the S&P. Another major decline is likely from August to October on the Saturn-Ketu aspect.
5-day outlook — bearish-neutral SPX 1170-1190
30-day outlook — bearish SPX 1050-1100
90-day outlook — bearish-neutral SPX 1150-1200
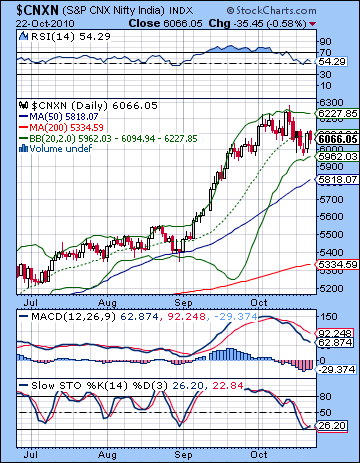 Stocks were mostly unchanged last week as the optimism of the successful Coal India IPO was countered by earnings disappointments from companies such as Wipro. Despite trading below the 20k level midweek, the Sensex finished Friday at 20,165 with the Nifty at 6066. This neutral outcome was not unexpected as I had noted the presence of both positive and negative aspects last week. Monday was positive as forecast on the Sun-Mercury conjunction, although the upside was trifling. Tuesday saw a much larger drop and this also broadly conformed with my expectations. Wednesday’s decline was more surprising, however, given the normally bullish Mars-Jupiter aspect that day. As it happened, the bull move was delayed until Thursday as the market rallied by 2%. The predicted late week bearishness was therefore confined to Friday only, as the market saw a modest pullback. Overall, the market still seems ripe for a much larger correction. I have been closely watching the Venus retrograde cycle which began on 7 October. Due to its association with notions of value and buying, I had thought it might correlate with a reversal in the market trend. So far that has not been the case, although one could still argue that it has been a factor in the potential topping action of the market over the past two weeks. Price has become more volatile here with larger swings in both directions. With the potentially disruptive Rahu-Pluto conjunction upcoming in mid-November, there would appear to be a greater likelihood for a correction in the near term. This fits nicely with the prospect of some politically-related selling in the wake of the US mid-term elections and the FOMC meeting slated for the day after on November 3. While the market has likely discounted the anti-stimulus Republican Party winning control of the House, a win of the Senate would be quite shocking. I’m not convinced a GOP takeover of the Senate is in the cards, however. Obama’s horoscope looks somewhat problematic but it doesn’t quite spell "disaster" that one would expect it might if his party lost both houses of Congress. Perhaps the FOMC meeting will sow the seeds of disappointment as the announced quantitatitive easing is much smaller than expected. In any event, most signs would appear to point to a significant correction in Q4. Just how deep this correction will be remains an open question, however. The key planetary factors would suggest that it is greater than a purely technical 5-10% correction. Probably it will be somewhere between 10 and 20%. Once it is completed, we can expect another significant rally in December and January on the next Jupiter-Uranus conjunction that adds at least 10% to the key indices. Another sizable decline seems likely in February and March on the Jupiter-Saturn aspect. This has a good chance of forming a lower low than anything we see in Q4. After that, a Jupiter-Pluto rally seems likely from about April to July. I don’t think it’s likely to exceed current levels, although it should be significant. Then another decline is slated for the Saturn-Ketu aspect in August and September 2011. On the whole, 2011 does not look positive for stocks and there is a probability of lower prices by Q3.
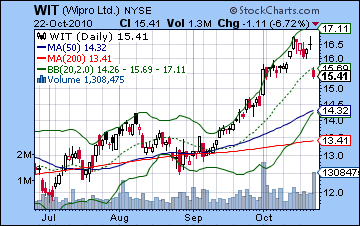
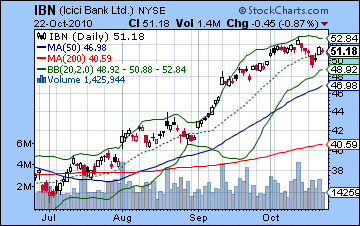
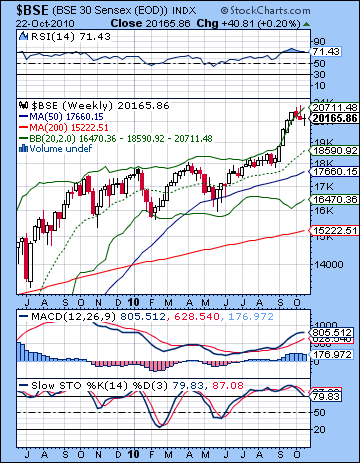 The technical condition of the market deteriorated last week as the Nifty closed below 6000 for the first time since September. Despite the mostly flat performance, most technical indicators show weaker readings. The Daily MACD is still locked in its bearish crossover although histogram bars are shrinking. Given the crossover occurred so high above the zero line, the current correction is a good candidate for returning the MACD line to below the zero line. Currently it is still well above this line. The RSI (54) has broken down and is still slightly bullish. Previous shallow corrections has seen the RSI bounce off the 50 line back to the 70 line so perhaps market bulls are hoping for a similar outcome here. The difference, however, is that this time the RSI is coming off a massively overbought level near 75 whereas previous retracements off the 50 line were part of the long rally off the May low. More encouraging for the bulls is that Stochastics (26) have bounced off the 20 oversold line and may be preparing for some kind of longer rebound higher. While this is very possible in the short run, it is uncertain if it can translate into a significant price move. Wednesday’s low was close to the bottom Bollinger band indicating a minimal correction had taken place before bulls rushed in and scooped up bargains. Clearly, there are still a lot of people buying this market even at these lofty levels. With the prospect of a huge double top pattern here going back to the January 2008 high, however, the upside would appear to be fairly limited. As price approaches 6200-6300, selling will likely increase and this will drive prices lower again. ICICI Bank (IBN) echoed the weakening of the wider markets with a lower high this week. Wipro (WIT) reveals more vulnerability here as Friday’s earnings disappointment sparked a significant selloff that closed a gap. As a company that is directly impacted by the rising Rupee, Wipro’s weakness here foreshadows the probable future direction of the export-dependent Indian market. The weekly chart still looks overbought as the Sensex has barely moved below the upper Bollinger band. This suggests there is more room to the downside in the event of a serious correction. Of course, it is technically possible that a deeper correction may have been postponed as a result of last week’s brief retracement. However, the falling Stochastics (79) and its negative divergence would appear to increase the likelihood of lower prices down the road. RSI (71) is still overbought on the weekly chart and is coming off a very bearish looking double top. And yet all three moving averages are rising indicating bullish momentum over the medium term. One would think the middle Bollinger band (18,590) on the weekly Sensex chart would be the probable first stop in any significant correction. This is especially true since it roughly coincides with the level of the bullish breakout from the rising channel. The bottom band (16,500) is the next obvious resistance level in the event of any major correction.
 This week looks quite mixed with significant price moves in both directions. Monday begins with a Mercury-Venus conjunction so that may support prices somewhat and I would expect a positive close on either Monday or Tuesday, but probably Monday. After that, the picture darkens somewhat as the Sun comes under the aspect of disruptive Ketu. This is exact on Wednesday although it could manifest anytime between Tuesday and Thursday. It is also worth noting that this Sun-Ketu aspect may be act as a trigger for the Rahu-Pluto conjunction. This means there is a gradually increasing likelihood for a much larger move down over the next 3-4 weeks and if and when it does happen, it is more likely to happen on aspect combinations such as these. For this reason, Wednesday and Thursday could conceivably produce a significant down day. It’s not certain of course, since Venus is in close proximity ahead of its own conjunction with the Sun on Thursday and Friday. This is usually a bullish combination, although the presence of the Ketu aspect is very much a wild card here and has the potential to reverse the sentiment. If the midweek is bearish as expected, then there is a good chance we will finish down overall. A more bullish scenario would be a significant rise on Monday towards 6100-6200 and then a mild pullback into Wednesday to 6000 with a rise into the end of the week that keeps the Nifty near 6050-6100. A bearish variant would be a smaller rise on Monday that keeps the Nifty below 6100 followed by a steep decline into Wednesday that closes below last week’s low, perhaps closer to 5800-5900. Then we could see one up day towards the end of the week with a close near 5900-6000. I would lean towards the bearish scenario here although much of the outcome will depend on how much of a pullback, if any, we get midweek.
 Next week (Nov 1-5) looks more reliably bearish as Mars aspects Ketu midweek. The early part of the week looks middling but the situation should weaken by Wednesday and a steep decline is quite possible. A significant up day is also fairly likely on Thursday or Friday on the Mercury-Jupiter aspect. The following week (Nov 8-12) also tilts towards the bears as both Mars and Mercury will come under the influence of pessimistic Saturn. There is the possibility that we will see the selling climax in the middle of November just ahead of Venus direct station on 19 November. With Jupiter also ending its retrograde cycle at that time, there could be a lot of reversing energy available for the market to tap into. If prices have been falling into November as we expect them to, then the time around 19 November could well mark an interim bottom. After that, some rebound is likely for a week or two as we move into December. Another dip is likely between Nov 29-Dec 12. It is unclear if this will be a higher low or a lower low than what we might see on 19 November. Then prices should rise substantially into the Jupiter-Uranus conjunction due for 4 January. Highs are likely to be lower than current prices. Stocks could remain fairly high until late January and the Saturn retrograde station on 26 January. That is likely to begin the next big move lower. It is likely to be a significant move, perhaps 20%. Once prices again stabilize in March — presumably at a lower low than in Nov-Dec — we can look forward to another rally that lasts until June and July. This should be a formidable rally and may well add 20% to stock prices. I am then expecting another major down move from August to October.
5-day outlook — bearish-neutral NIFTY 6000-6100
30-day outlook — bearish NIFTY 5000-5500
90-day outlook — NIFTY 5500-6000
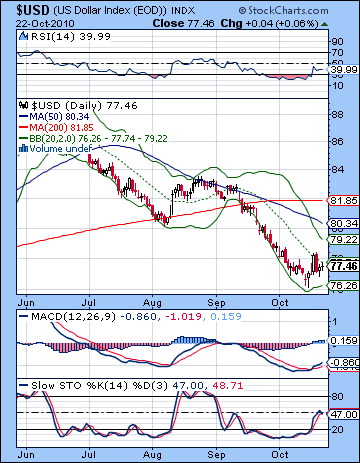 The Dollar finally got some wind in its sails last week on China’s surprise rate hike on Tuesday closing around 77.5. The Euro slipped half a cent to 1.393 and the Rupee moved up to 44.5 It was a long time coming but it seems as though the greenback has turned a corner here. Tuesday’s gain was especially gratifying as I had thought we might see a gain that day in the aftermath of the Sun-Mercury-Jupiter pattern. The technical position of the Dollar improved as we got a bullish MACD crossover on the daily chart. Stochastics (47) are moving higher here and still have a way to go before they reach overbought territory. In all likelihood, the Dollar will at least get that far. How long it stays overbought remains an open question, however, as the weekly chart looks severely compromised. Daily RSI (39) is also moving higher and a rise to the 50 or 60 level is likely. Friday’s close was just under the 20 DMA, a major accomplishment for the beleaguered currency. A push higher to the upper Bollinger band at 79 is quite likely here and it may well take a run at the 50 DMA at 80. A rally to the 79-80 level would still respect the falling channel and would therefore not mark a significant departure from the current bearish trend. Of course, a low Dollar is very much in the interests of the US right now as it boosts exports and creates jobs in the short term. However, the falling Dollar is bad news for the most of the rest of the world, as traditional trading relationships come under pressure. If Bernanke disappoints with the size or extent of QE2 in his update on November 3, then the Dollar could spike higher.
This week could see more upside as the Sun-Ketu pairing could reduce risk appetite and have investors retreating to safer havens. A decline is probable Monday but the chances for gains increases after that with Wednesday looking most positive. The late week period looks mixed to positive so we may well see give back then. Next week looks more solidly positive as the Mars-Ketu aspect will likely scare a lot of people back to the Dollar. The Dollar’s mini-rally here should continue into the Venus and Jupiter direct stations on Nov 18-19. I’m not expecting much of a lift here, but it should rise to somewhere over 80. After that, another move lower is likely until perhaps January. Another rally is likely from about mid-January to perhaps mid-February. Where it peaks in this period is an open question, but it likely will be somewhere between 80 and 85. The Dollar will likely stay weak through much of 2011.
Dollar
5-day outlook — neutral-bullish
30-day outlook — bullish
90-day outlook — bearish
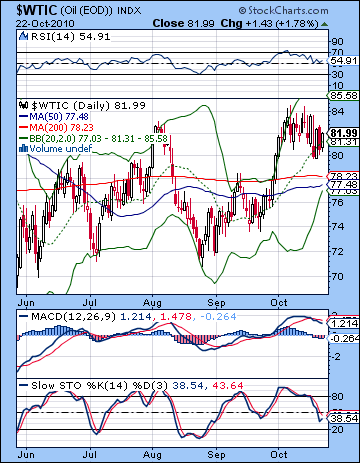 Crude oil lost ground last week on the improving Dollar and the possibility of reduced demand in China. Futures closed the week a shade below $82. This was largely in keeping with expectations as there was a mix of aspects in play. As predicted, we saw a gain Monday followed by a sharp selloff Tuesday which was then followed by another strong rally on Wednesday. The latter gain coincided exactly with the bullish Mars-Jupiter aspect. And as expected, the late week period was more bearish, although not by much. Last week’s decline took prices back to the 20 DMA and middle Bollinger band. Daily MACD now shows a bearish crossover and it still has a long way to fall before it reaches the zero line. Stochastics (38) has fallen sharply here and are approaching the oversold 20 line. Previous corrections have not always gone to 20 before reversing, so that is something to watch for. RSI (54) is falling but still in bullish territory. We may only know if crude is headed for a deeper correction if and when the RSI falls below the previous correction low of about 45. The convergence of the 50 and 200 DMA at 77-78 would suggest an initial support level in the event that the correction continues. After that, the August low of $71-72 would likely bring in new buyers.
This week has the potential for some significant down days that may offset any positivity from the two Venus conjunctions. Monday could produce a gain on the Mercury-Venus conjunction, although I would note that even there, Mars is aspecting Rahu in the Futures chart and this is usually a negative influence. Tuesday is nonetheless perhaps a better bet for a down day as the Sun comes under Ketu’s disruptive influence. We are likely to see at least one up day on either Thursday or Friday, perhaps both. The Sun conjoins Venus on Thursday so that may be a more reliable source of optimism. As transiting Saturn moves closer to its opposition with the Mercury in the Futures chart, there is a greater chance we could see a larger correction develop through November. There is a good chance we will revisit $70 at some point in the next few weeks. Once Venus and Jupiter return to direction motion on Nov 18-19, prices are likely to rebound again. I would not rule out a higher high by early January, with $90 a distinct possibility. Prices will begin to decline in mid-January and stay weak until mid-February at least. Crude should generally stay strong from March to July with another correction likely from August to September.
5-day outlook — bearish
30-day outlook — bearish
90-day outlook — neutral-bullish
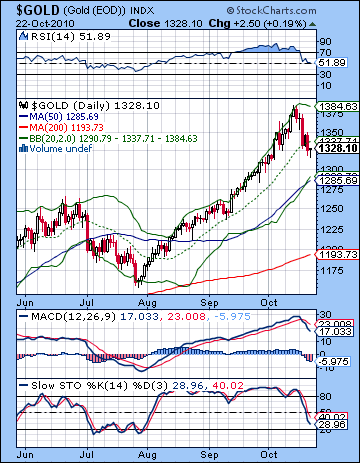 Gold finally got its long overdue haircut last week as the rebounding Dollar removed some of bullion’s allure. Gold declined 3% to close at $1328. I had wondered if we might see a reversal in gold’s fortunes on the entry of the Sun into Libra and sure enough Monday was mostly flat despite a fairly bullish aspect with Mercury and Jupiter. Tuesday’s steep decline was somewhat unexpected to be sure although Wednesday’s rebound occurred more or less in line with the bullish Mars-Jupiter aspect. The rest of the week was mostly bearish on the Venus-Saturn aspect. Price corrected to the middle Bollinger band but may continue lower if Friday’s hammer candlestick is not confirmed Monday. The hammer is a bullish formation when at the end of a down trend and since gold is at a level of resistance here, it is possible it could reverse and again move higher. Stochastics (28) have fallen close to the oversold level and this is another potential indicator that an interim bottom may be near. RSI (51) has fallen sharply from overbought level although it is still bullish. MACD remains in a bearish crossover but it still well above the zero line indicating further downside is possible. If there is a second leg down in this correction, it will likely test support near the bottom Bollinger band at $1280. This also roughly coincides with the 50 DMA. A little below that level, at $1260, is the breakout level so that may actually be more of a magnet in the event of a significant correction. This is also the approximate level of the bottom of the rising channel from the 2008 low.
This week looks quite volatile with more large price moves likely in both directions. Monday’s Mercury-Venus conjunction may send prices higher but the midweek Sun-Ketu aspect does not look positive at all for gold. I would think we see lower lows by Wednesday, perhaps below $1300. The complicating factor here is that the Sun will conjoin Venus just a day later and this is usually a bullish influence for gold. But since both Sun and Venus will come under the aspect of disruptive Ketu, there is a chance that price will continue to fall even at the end of the week. I don’t quite think it is a probable scenario, but it is somewhat more likely than it otherwise would be. I would still retain a bearish bias here, but stay open to the possibility of a rally day on Thursday or perhaps Friday. Overall, there is a genuine chance for a big move lower here. The outlook for gold looks relatively bearish for next week two to three weeks, at least until the end of the Venus retrograde cycle on November 19. Another rally will likely begin in late November and continue into early January. This may well eclipse the recent high, although that should only be seen as a probable outcome. Then there will be another corrective phase that lasts into mid-February. Generally, gold looks to be quite strong through most of 2011, as the Dollar is likely to stay weak. Higher highs are still quite probable for later this year, possibly in June or July.
5-day outlook — bearish
30-day outlook — bearish
90-day outlook — neutral-bullish

