- Choppy week ahead with moves in both directions, more downside is possible by midweek
- Dollar to rise higher with large move in either direction at end of the week
- Crude to fall further but reversal possible on Friday
- Gold mixed with significant move possible late in the week
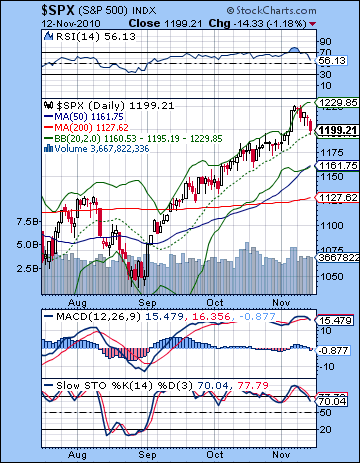 Stocks slumped last week on rumors of a possible Chinese rate hike as official inflation there rose above the key 4% threshold. The Dow broke a key technical level (11,245) and closed down 2% at 11,192 while the S&P500 finished the week at 1199. This bearish result was certainly not unexpected, although the bulk of the decline manifested somewhat surprisingly on Friday. I thought the Rahu-Pluto conjunction on Tuesday may well cast a shadow over the week, perhaps more so after Tuesday and that seemed to be the case. Monday’s Mercury-Venus aspect presented an opportunity for a gain but the market actually edged lower — a sign of things to come perhaps. Tuesday was negative and this was more in keeping with expectations since it lacked any obvious positive attributes. I had expected more downside on the Mercury-Rahu aspect on Wednesday and Thursday but those days were net flat with the decline arriving only on Friday and the lead-in to the Saturn-Mars aspect. As I noted last week, there was a reasonable chance for a decline to begin on the Rahu-Pluto pairing and that may well be what is now happening. The G20 meeting in South Korea did not reach any significant agreement on currency and trade and that perhaps is another manifestation for the combination of Rahu (thoughtless self-interest, greed) and Pluto (power, large organizations). The Fed’s QE2 program to support the economy through further stimulus is drawing widespread criticism from many quarters around the world. The plan to reflate the US economy through bond purchases is depreciating the US Dollar and exporting inflation abroad thus upsetting longstanding international trade balances. The inability to reach any accommodation on currency means that this issue will continue to fester in the weeks and months (and years?) ahead. There is also a growing number of domestic observers in the US who are now openly questioning to what extent QE2 can actually work since it only offers very indirect support to business spending. Stock prices may be supported by the flood of cheap money but this relationship will only hold as long as the economy is showing signs of recovery. Even then, stocks are vulnerable to changes in international demand as the Chinese rate hike revealed. A slowdown in China’s double-digit growth rate would weaken demand for US goods and this could be another source of weakness in the stock market. In astrological terms, this acrimonious debate over the currency implications of QE2 may continue into early December. Since both Rahu and Pluto are slow moving, they will be just two degrees apart in four weeks time. Their impact may be extended through the supportive conjunctions of Mercury and Mars in the second week of December. This is a rare quadruple conjunction that will likely underline some of these high level power struggles for the next several weeks. At the same time, however, it is important to note that the bullish effect of Jupiter will gradually be on the rise. Once Jupiter begins to move forward after this Thursday November 18, it will once again begin to approach its bullish conjunction with Uranus which is exact on January 4, 2011. However, I expect that we won’t see that much upside from Jupiter until the second or third week of December.
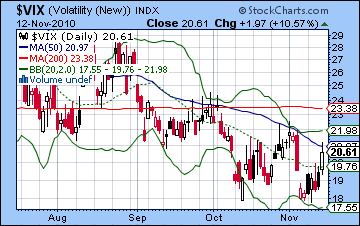
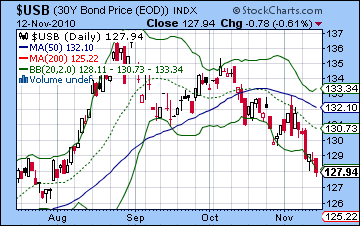
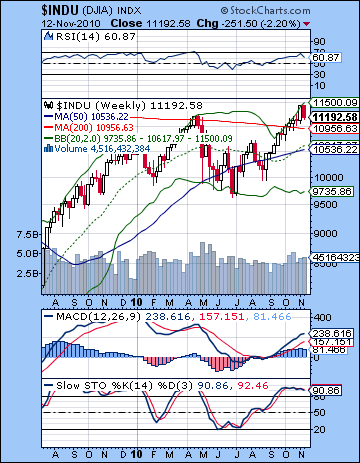 The technical situation worsened somewhat last week as the Dow closed below its breakout level of 11,245. This level was important because it represented a possible new bull market breakout from the previous April high. The close below that level now opens up the possibility that the breakout higher was a fake out and increases the chances that the market may actually be going lower. The S&P also closed below its breakout level of 1220 although this was less significant since it had barely risen above it anyway. More interesting, however, is that Wednesday’s intraday high of 1227 almost exactly matched the 61.8% Fibonacci retracement of 1228. While the pullback off this level is no guarantee that the bulls have given up and gone home, the fact that bulls caved in right at this level give the bears some hope that the market may be heading lower in the near or intermediate term. A closer look at the S&P chart shows that the bears still have a ways to go. Friday’s pullback ended right at the 20 DMA, which is more or less where previous corrections in this recent rally have ended. So potentially it is no big deal and prices could rally back to the top Bollinger band. More encouragingly for the bears, however, is the bearish crossover in the MACD, although this, too, was present in previous minor corrections over recent weeks. RSI (56) has fallen from its severely overbought levels and is in a negative divergence with respect to the previous low on Oct 19. Stochastics (70) are coming off the overbought area here and may be headed down. They also form a negative divergence with previous lows. And it’s worth noting that previous forays into the 70-80 area did not preclude further rallies. The weekly Dow chart also shows a potentially bullish support level of the 200 WMA at 10,956. Previous flirtation with the 200 WMA over the past two years have met with rejection as the bears took control and send prices lower. On this occasion, however, last week was the second close above this previous resistance level. Is it now acting as a support as a new bull rally gets underway? Bulls could certainly argue that although I would think the failure of prices to stay above the April highs likely counts for more at this point. The weekly chart still looks quite overbought at these levels as price is quite close to the top Bollinger band and Stochastics (90) remain overbought. RSI (63) is in a negative divergence with respect to the April high. A deeper correction would require a break below this rising channel, which equates to about 1190 on the S&P. If price bounces higher from here, then the rally is very much intact. Even in that case, it would probably require a close below a previous low like 1180 to turn the bullish tide to any significant extent. The $VIX was predictably higher last week and bounced above 20. It has yet to break above the falling channel, however, and unless or until it does, then this rally will remain firmly entrenched. Meanwhile, the appeal of US long treasuries continues to wane here as yields fell again this week. Coming as it did on falling equity prices, this is very bad news for Bernanke as it will increase the cost of borrowing down the road. And it is important to grasp that treasury prices are falling despite the boost in demand from the Fed’s buy back program. The risk of a 2011 blow-up in treasuries is increasing here and the market may force Bernanke’s hand to raise rates in order to bring in buyers of US debt.
 This week could well see more downside although with some up days thrown in for good measure. The early week period looks somewhat more bearish as Monday’s Mars-Saturn aspect looks fairly negative. As luck would have it, this bad aspect occurs on the same day as a bullish Sun-Jupiter aspect so that clouds the picture somewhat. It is possible that these aspects could produce a split between Monday and Tuesday although there is a good chance for a net negative outcome here. Wednesday also looks bearish on the Mercury-Saturn aspect and the chances of a decline are somewhat greater on this day since there is no Jupiter aspect in play. For the early week period, the best chance for a positive close is perhaps Monday, although that is unclear. Tuesday may open positively on the Moon-Jupiter conjunction but there is a good chance that prices won’t hold by the close. Tuesday and Wednesday are therefore better bets for down days. A gain is more likely to arrive on Thursday and the Sun-Uranus aspect. Friday presents something of a puzzle. It features the Jupiter and Venus direct stations so that may increase the likelihood of gains. Also the Sun forms a minor aspect with Venus so that should also boost the odds for an advance. However, the close proximity of the Mercury-Mars conjunction somewhat undercuts the likelihood of a positive outcome Friday. These aspects therefore increase the chances for a large move in either direction, even if it is not clear what the direction will be. Nonetheless, I would slightly lean towards a bullish result. Overall, the market could well finish the week below current levels. Certainly, the medium term influences are still pointing to a deeper correction. If Monday is higher, we could see a bounce to 1210-1215 and then down to 1180 by Wednesday. Thursday’s gain might take the S&P back to 1190 but Friday’s aspects could well see us finish close to current levels or even above. This would be a more bullish scenario. A more bearish scenario would likely see deeper losses by midweek perhaps to 1170 with Thursday’s rally to 1180 and with Friday ending up negative.
 Next week (Nov 22-26) is likely to start negative as the Moon opposes the Mercury-Mars conjunction. After that, we could see a bounce as prices are more likely to rally into Thursday’s Mercury-Jupiter aspect. There is a good chance for a positive week overall. The following week (Nov 29-Dec 3) looks bearish to neutral as Mars aspects Uranus and Mercury conjoins Rahu on Friday the 3rd. This is likely to mark the next move lower which could continue until the 14th. This could well be a sizable decline and I would not rule out a close below 1100, perhaps even testing support at 1040. A rally into Christmas should follow this down move although a significant decline is likely on Dec 28-29. January may see some rally attempts in the wake of the Jupiter-Uranus conjunction. Saturn turns retrograde on January 26 so it’s possible prices will stay firm until then. But there are a plethora of aspects in both directions throughout January that could end up producing much smaller gains. For this reason, I would not count on a January rally extending too far. Certainly, the late January period looks very bearish and this is likely to hasten a sharp decline that goes into February. Generally Q1 2011 looks bearish as rally attempts may be shaky and short-lived. Prices may fall 20% or more. Q2 should see significant improvement especially in May to July. The Saturn-Ketu aspect in August and September makes this a prime candidate for another major leg lower. I would not be surprised to see lower lows by the end of September.
5-day outlook — bearish SPX 1180-1200
30-day outlook — bearish SPX 1100-1150
90-day outlook — bearish SPX 1000-1100
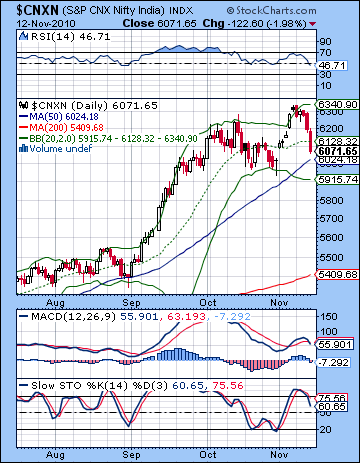 Stocks had their worst week since May as concerns over a possible Chinese rate hike and the Irish debt bailout sent investors rushing to the exits. The Sensex lost more than 4% to close at 20,156 while the Nifty ended the week at 6071. The decline provided more credible evidence that last week’s Rahu-Pluto conjunction is creating problems for the market. While the extent of bearishness was a little surprising, it was gratifying to see the market roughly conform to expectations. Monday was lower as expected on the Moon-Mars aspect and the recovery on the Mercury-Venus aspect did not manifest until Tuesday. Interestingly, the exact Rahu-Pluto conjunction occurred Tuesday and the market was bearish for the rest of the week. I had wondered if we might see a dynamic like that with the Rahu-Pluto acting as a dividing line. So far, that notion is intact although we will have to see how far this current pullback goes this coming week. Wednesday’s Mercury-Rahu aspect was also negative as we anticipated and this carried over into Thursday. Perhaps more unexpectedly, however, was Friday’s significant selloff. I was unsure about Friday since the bearish Mars-Saturn aspect was in play but still somewhat inexact. It may well be that Rahu-Pluto is now the prevailing medium term influence on the market and it is tipping the short term aspects towards more bearish outcomes. As I have noted in previous newsletters, the Rahu-Pluto conjunction is a bearish combination that can erode confidence and increase uncertainty. It is perhaps fitting that this conjunction should occur at the time of the meeting of the G20 last week in South Korea since Pluto symbolizes large organizations and power while Rahu represents destabilizing greed and self-interest. The G20 failed to reach any significant agreement on currencies and so that remains an open debate and potential source of conflict in the future. As the US Federal Reserve continues to print money in an attempt to reflate its economy, it is in effect depreciating its currency and exporting its inflation abroad thereby causing disruption of trade patterns around the world. Predictably, there has been a chorus of criticism from a diverse range of nations who have been hurt by this de facto US Dollar devaluation. It seems likely that the growing instability of the international currency regime will continue to be a source of discord in the weeks and months to come. Significantly, the effects of the Rahu-Pluto conjunction may well last into December as these two slow moving malefic planets will still be just two degrees from each other. Moreover, Mercury and Mars are scheduled to form a very unusual quadruple conjunction with Rahu and Pluto in early December so that may well reflect ongoing global problems. On the bullish side, with Jupiter ending its retrograde cycle on Friday, 19 November, it will once again begin to approach its final conjunction with Uranus due on 4 January 2011. As I have noted previously, Jupiter and Uranus is a fairly reliable bullish pairing so we should expect some significant upside from this approaching conjunction. However, I still expect the bearish Rahu-Pluto to dominate until early December at least. After that, there will be more celestial elbow room for the bullishness of Jupiter-Uranus.
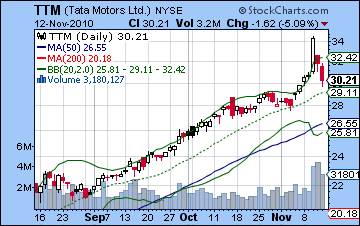
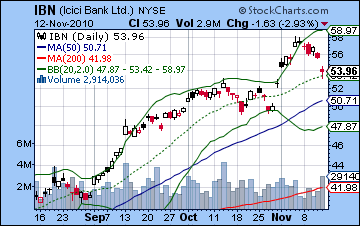
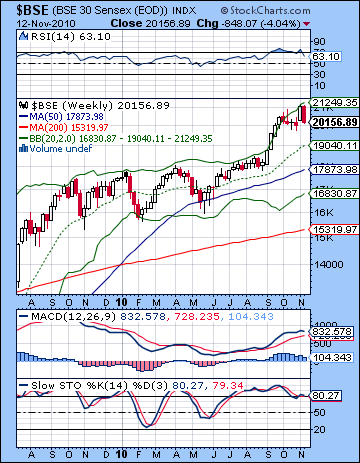 Technicals weakened last week as prices failed to follow the rising trendline to 6400 and instead turned lower. This is a potentially significant reversal that could indicate further downside before another rally is attempted. Friday’s close was below the 20 DMA and may well be headed for an appointment with the bottom Bollinger band at 5915. Even if that happens, the Nifty may test 5700 as that is the support level offered by the broadening triangle pattern that originated in early October. While bulls may be disappointed by their inability to keep price above 6300, the situation will still be salvageable for them as long as the Nifty stays above the October lows of about 5950. A higher low is crucial for the viability of the bullish case. 5950 is fairly close to the bottom Bollinger band, so we should treat support levels as approximates rather than as absolutes. All the indicators turned more bearish last week as daily MACD began a fresh bearish crossover and is now sloping downward. The negative divergence still dominates this chart and with MACD is higher than the zero line, there is still a compelling argument to be made for further declines. RSI (46) has slipped into bearish territory although it is roughly at the same level as for previous reversals higher. Of course, the divergence is still as clear as day here, so it offers little consolation to bulls. Stochastics (60) has crossed over also and may well be heading towards the oversold area below the 20 line. The weekly Sensex chart has a bearish engulfing candle as a result of last week’s action and may well point to lower prices ahead. This chart continues to suggest significantly lower prices in the medium term as the Sensex has only started to retreat from the upper Bollinger band line. RSI and Stochastics are looking shaky here and their divergences do not paint a rosy picture. In the event of a more thoroughgoing correction, the bottom Bollinger band might offer some support at 16,830. The correction thus far has been across the board as even high-flying stocks like Tata Motors have take a hair cut off their recent highs. Last Wednesday in New York saw a big advance on huge volume but the subsequent pullback also occurred on above average volume. Wednesday’s high has the preliminary appearance of a blow-off top since volume was actually higher on the follow through selling day. The next test will be if support from the rising channel will hold at around $29, or about 3-4% below the current price. A break below that channel would definitely be bad news for Tata and for the market as a whole. The pullback in ICICI Bank (IBN) has partially filled a recent gap although price remains above an important breakout level at $52. Overall, the technicals are tilting towards the bears although if the Nifty falls to 5950 or so, then we should see more buyers come in and try to push the market higher once again. One key factor to watch will be the slope of the 20 DMA (middle Bollinger band). Recent activity has made this line almost flat. The last time this occurred was in April just before the market sold off. If it should turn down, it would increase the chances of a deeper correction below 5950.
 This week looks mixed with significant moves in both directions likely. Monday may see one of these large moves as it features two strong aspects, one positive and one negative. The Sun is in aspect with Jupiter so that may offer some support to prices but Mars falls under the negative influence of Saturn also. While a cancelling effect is possible, I suspect we could see them manifest sequentially with a negative open followed by a rally attempt. It is unclear where the market will finish, although I would lean towards a negative close. The bullishness of Sun-Jupiter is likely to carry over into Tuesday’s session with a positive close as the most likely scenario. Wednesday looks more solidly bearish as Mercury now falls under the aspect of Saturn. Thursday may continue to see some residual negativity from Mercury-Saturn but some bullishness is very possible as the day wears on from the Sun-Uranus aspect. The outcome is harder to call here, although I would lean towards a negative close. Friday is another day that has the potential for a major move, although the direction is less clear. Venus and Jupiter end their retrograde cycles here and will begin to move forward. That is a positive influence. However, it just so happens that these reversals will occur just as Mercury is about to conjoin irascible Mars. The exact conjunction isn’t until Saturday, but it is close enough to increase the chances for a negative day. Nonetheless, I should stress that the most likely outcome is a gain. Friday’s open is particular has a good chance for a gain as the Moon aspects Venus. So a bullish scenario might have Monday and Tuesday generally higher to about 6200-6250 followed by a decline back down to 6000-6100 on Wednesday and Thursday with a rally day Friday back to 6200. A more bearish unfolding of the planetary energy would see a decline Monday below 6000 followed by a strong gain Tuesday back to 6100 and then to 5900-6000 on Wednesday followed by a modest gain Thursday to 6000 with Friday taking the Nifty below 6000. While I think the medium term influences are generally negative here, I am unsure if we will see enough downside this week to take it much lower. Nonetheless, I would slightly lean towards the bearish scenario.
 Next week (Nov 22-26) looks somewhat more positive although it may begin negatively on the after effects of the Mercury-Mars conjunction. Sentiment may be bearish to neutral up to perhaps Wednesday but some improvement seems likely in the late week period as Thursday looks quite bullish on the Mercury-Jupiter aspect. Friday may see some backsliding, however. The following week (Nov 29-Dec 3) looks like it will begin positively on the Mars-Jupiter aspect but the enthusiasm will fade by week’s end as Mars enters Sagittarius. This will set up the quadruple conjunction of Mercury, Mars, Rahu and Pluto for the second week of December. This looks like a very negative pattern that could coincide with a sharp selloff. I would not be surprised to see the 200 DMA and 5400 tested on the Nifty at this time and it may well go lower than that. Some kind of recovery rally is likely after 14 December as Jupiter moves closer to its conjunction with Uranus. This is generally reliable bullish pairing that has the ability to lift prices sharply. It remains to be seen how long the rally can continue, however, as I can see some negative aspects interfering with the bullishness in the last week of December. January may begin with further gains but the month may be characterized by more of a sideways movement. The next down leg will begin sometime between 15 Jan and 26 Jan, with the latter date coinciding with the beginning of the Saturn retrograde cycle. Some significant down moves are likely in both February and March although there will also be rallies mixed in. Generally Q1 2011 looks quite bearish. Q2 should see some improvement with the more reliable gains in May and June. August and especially September look very bearish as the Saturn-Ketu aspect will occur at the same time as the Uranus-Pluto aspect. I am expecting a bearish pattern of lower highs and lower lows to prevail at least until September 2011.
5-day outlook — bearish-neutral NIFTY 6000-6100
30-day outlook — bearish NIFTY 5400-5700
90-day outlook — bearish NIFTY 5000-5500
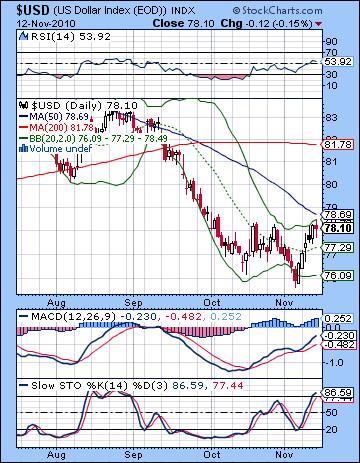 The Dollar finally got up off the mat last week as recurring problem of European sovereign debt popped up again in Ireland. The USDX closed above 78 with the Eurodollar finished the week just under 1.37 and the Rupee retreating to just under 45. As expected, the Rahu-Pluto aspect brought some joy back to the Dollar as nerves frayed over the intensifying currency wars. The Fed’s insistence on QE2 is tantamount to currency devaluation, much to the chagrin of America’s trading partners. The greenback’s strength here may be anticipating some significant central bank moves around the world to stem the tide of the falling Dollar. The G20 accomplished nothing in that regard as the issue remains a bone of contention. From a technical perspective, the Dollar has moved up to an obvious resistance level. Actually, it’s a two-way resistance level since it is both the top of the falling channel and at the same level of the previous high in October. Prices here are almost nudging up against the 50 DMA. The momentum indicators look quite bullish here as MACD is in a nice bullish crossover and is rising and yet remains below the zero line. This suggests it may have further room to run on the upside. We can also spot a positive divergence with respect to the previous October high. Similarly, the RSI (53) is now in bullish territory and is also in a positive divergence with the previous high. This is all the more bullish since the two more recent RSI lows also showed a positive divergence. Stochastics (86), however, have run all the way to the overbought area so this up move may be vulnerable to some profit taking. There is no obvious resistance level above the current level although the 200 DMA at 81 may prove to be a difficult target to reach. This would roughly correspond to 1.32 EUR/USD.
This week looks fairly positive for the Dollar as Friday’s Venus retrograde station sets up in aspect with the natal Sun in the USDX chart. The early part of the week looks fairly bullish but perhaps not overly so as Tuesday’s Sun-Jupiter aspect looks like it will translate into increased risk appetite which is often bearish for the Dollar. Wednesday is perhaps a more reliably positive day for the greenback. Some sharp moves are more likely this week, especially towards the end of the week, although it is not clear what their direction will be. I would tend to think they will be positive for the Dollar but I am fairly tentative about that. There is a reasonable case to be made for further gains into December as the planets look fairly unpleasant for overall sentiment. This should translate into more upside for the Dollar. It is conceivable that the rally could extend into January but it seems unlikely to extend much beyond that. There are some fairly contradictory astro indicators in play here that makes the Dollar especially difficult to forecast. The medium term influences do look mostly negative for the next 6-12 months while the Euro’s horoscope looks more bullish. I would therefore expect to see any Dollar rallies to be relatively short-lived and not very strong. The EUR/USD will likely move to 1.40 or 1.50 or perhaps even higher by mid-2011.
Dollar
5-day outlook — bullish
30-day outlook –bullish
90-day outlook — neutral-bullish
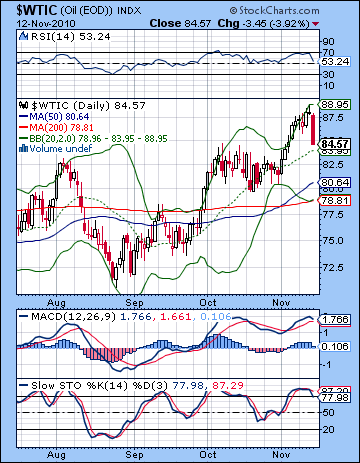 Crude oil retreated from its recent highs as the prospect for slower growth in China dampened demand forecasts. Crude close below $85 on the continuous contract. While I thought we would get some kind of pullback last week, I did not foresee that it would all arrive on one day — Friday. In fact, I mistakenly believed that Friday had a good chance for an up day. It seems that the midweek bearishness I expected on the Mercury-Rahu aspect showed up a little late. The technical situation is vulnerable to more downside here although there is still a plausible case to be made for the bulls. Daily MACD is pointing down now but it has yet to complete a bearish crossover. And there is also no evidence of a negative divergence with respect to the previous high. RSI (53) took a sharp turn lower but remains in bullish territory and is not grossly out of whack with previous small corrections. Stochastics (77) have crossed over and are now below the 80 line. Price has pulled back almost to the 20 DMA suggesting some support is possible around $84. However, on this occasion the 20 DMA would appear to offer weak support. Previous instances where it did support price were marked by rising momentum as MACD was at a much lower level as in September. Now that MACD is much higher it is that much more vulnerable to a larger correction, perhaps like we saw in August when it fall back to the bottom Bollinger band. This would roughly equate to $79 here. This is also the approximate level of the 50 and 200 DMA.
This week looks mixed but with some bearish overtones that may well prevail. Monday’s duel of bullish and bearish aspects is unlikely to end in a flat outcome and I would favor the bearish outcome here. Tuesday looks more positive, however, so that may erase any possible downside we see on Monday. Wednesday looks negative again while Thursday has a good chance for gains. Friday is a toss up which could produce a sizable move in either direction. I would lean towards a down day but I would definitely not rule either out outcome. Next week also looks mixed with gains more likely towards the middle and end of the week. Early December seems more negative as the Rahu-Pluto conjunction will be activated by both Mercury and Mars. The second half of December looks more positive, as does January. Another significant move lower is likely in February and March as Saturn opposes Jupiter.
5-day outlook — bearish-neutral
30-day outlook — bearish
90-day outlook — bearish-neutral
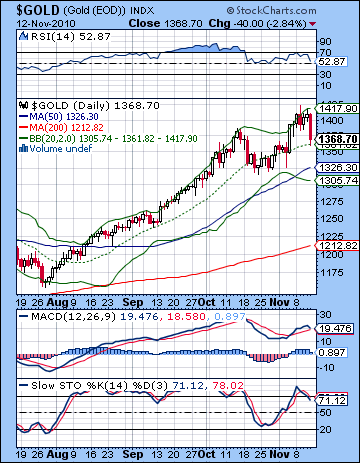 As rumours circulated about a possible rate hike in China on Friday, gold moved sharply lower losing 3% on the day and closing below $1370. As expected, gold did trade over $1400 early in the week as Monday’s Mercury-Venus aspect was enough to take it over that level. The midweek period was fairly choppy, however, with losses largely confined to Friday’s session. I had expected we might see more of the declines on Wed-Thurs on the Mercury-Rahu aspect. As shocking as the decline was, gold has only retreated to its 20 DMA. Could it hold here and just move higher again? Such a move is possible but it seems unsustainable given the gaping divergences in the momentum indicators. MACD appears to be rolling over at this time and shows a huge negative divergence with respect to the previous high. RSI (52) has fallen sharply but at least has not yet broken below the previous RSI lows nor the 50 line. Again, the divergence is stark here and would suggest that current levels are too high. In other words, gold does not look like a safe place to take a long position, even with all the currency uncertainty in the world. To be sure, the US Dollar seems compromised by the Fed’s wanton money printing in QE2. And yet if there is a move by other countries to bolster the Dollar, then gold will be in trouble. Such a move is possible given the pressure that many exporting nations are feeling. Also, a major pullback in equities may begin a cashing out process which would likely damage gold further. In terms of possible support levels, the bottom Bollinger band around $1305 may bring in some buyers. Another important level of support is around $1260 which corresponds to the summer breakout.
This week looks more mixed albeit with a bearish bias. Monday presents a conundrum as we have both bearish and bullish aspects in play. I would lean towards a bearish day Monday but with the likelihood for a recovery on Tuesday’s Sun-Jupiter aspect. Wednesday and Thursday look more bearish on the Mercury-Saturn aspect while Friday’s Venus station could produce a big move higher. However, there is still a chance that gold could continue its correction into Friday. Gold may continue to bounce around next week between $1350 and $1400 before likely heading lower in early December. There is a good chance for a sharp move lower in the second week of December that could well test $1300 or lower. The Jupiter-Uranus conjunction in early January will likely stabilize gold somewhat through the second half of December. After another rally into mid-January, gold should correct again into February and March. This correction will likely have some significant spikes higher but the trend appears to be lower through March. We should have another major rally from about May to August.
5-day outlook — bearish-neutral
30-day outlook — bearish
90-day outlook — bearish-neutral

