- Midweek gains possible with declines more likely late week
- Dollar mixed but strength more likely late in the week
- Crude mixed with gains more likely midweek
- Gold could rise midweek but declines likely by Friday
- Midweek gains possible with declines more likely late week
- Dollar mixed but strength more likely late in the week
- Crude mixed with gains more likely midweek
- Gold could rise midweek but declines likely by Friday
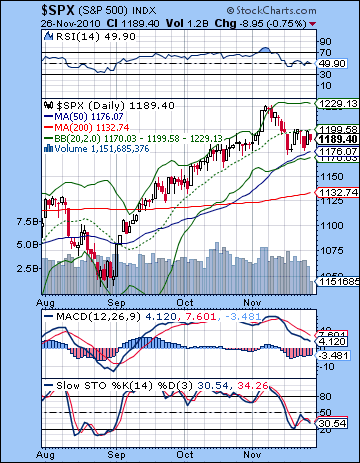 Stocks slipped last week as ongoing Eurozone worries coupled with a war scare on the Korean peninsula to offset some positive employment numbers. In a holiday-shortened week, the Dow closed down about 1% at 11,092 with the S&P500 finishing at 1189. The week unfolded roughly according to plan, and it was good to see the bearish scenario get some traction. I thought the early week would tilt negative given the Mercury-Mars conjunction and it did as Monday’s EOD rally set up Tuesday’s decline. While I thought there was a better chance that Monday would be the worse day, I had at least given some consideration to the possibility that Tuesday could be bad if Monday was more positive. The midweek rally arrived on schedule as the Mercury-Jupiter aspect brought in more buyers on the positive jobs news — only 400,000 newly unemployed filed for claims. In the current atmosphere, that counts as good news. Friday was lower as expected, although the selling started right from the opening bell rather than intraday as I had suggested. Overall, the market appears to be on course for a deeper correction here as it has not made another attempt to equal previous highs. As in May, the culprit may again be Europe, as rising bond yields in the European periphery are suggesting that the current status quo may not be sustainable. The bond vigilantes have returned and this time it may not be personal but rather systemic. The reaction to Ireland’s bailout and austerity program seems to indicate that while bond holders want more fiscal discipline, they are equally fearful that austerity could slow growth and thereby also lessen the ability for repayment. Austerity is a two-edged sword — it is necessary in order to restore confidence in sovereign debt but it is likely to cut growth forecasts that risk plunging affected countries into a double dip recession. Austerity may be good for the bond market since it will likely force yields lower at least in the short term, but it increases risk to equities since growth and profits may be affected more directly. Portugal and Spain are the next potential areas of concern (with Belgium rising up the charts with a bullet), although officials in both countries insist "all is well". Where all this is ultimately leading is unclear, as the Euro continues to bleed here and threatens to go much lower. It is critically important to remember that a falling Euro is bad news for stocks since much of the equity rally is predicated on a low greenback and all that free Fed money that was handed out a near-zero interest rates. While the current Eurozone debt crisis dovetails nicely with my bearish expectations for much of 2011, I’m less convinced that it will end up as the immediate cause of any further downturn in equity prices. While the Euro may well fall further in the short term, it’s medium term prospects for 2011 don’t look that bad from an astrological point of view. So it’s possible that by early next year, the crisis may well have migrated to New York.
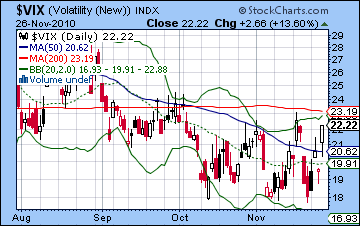
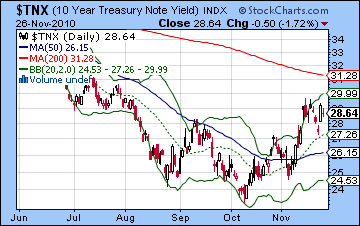
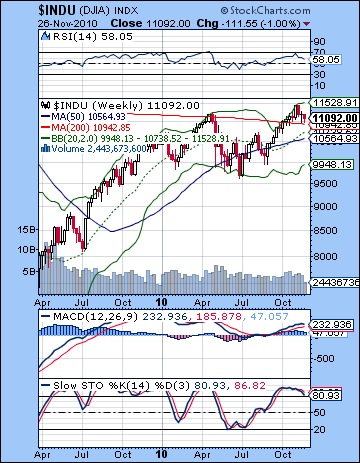 Despite last week’s listless performance, the technical situation seems to remain in the hands of the bulls. That’s because the SPX has yet to break out of its rising channel off the late August low. It has come close to breaking support on a couple of occasions but so far it has held up. By next week, this support level will be above 1190, so any close below that — and below current levels — could conceivably spark a much larger selloff. But on the bears side, we can spot a potentially bearish head and shoulders pattern with the LS and RS around the 1200 level with a 1227 head. The neckline for this pattern is around 1170-1175 so a break below there would increase the odds of a deeper correction. The downside target for this H&S is about 1120. Interestingly, this 1120 level is very close to the resistance level from the neckline of the inverted head and shoulders formed from the June-July tops near 1130. This is perhaps a prudent downside target in the event that support is broken in the near term. Certainly, the planets support a pullback of that magnitude or more, so that is a nice piece of confirmatory evidence. So we’re clearly at a crossroads here with the rising channel and H&S converging near current levels or a little lower. Resistance is likely around the 1200 level which would create a very elongated RS. A break above 1200 would be bullish as it would weaken the H&S and may set up another test of 1227. Technical indicators are predictably weak here but do not show clear signals. RSI (49) is slipping but one has to look carefully to discern any negative divergence. MACD is still in a bearish crossover and still above the zero line so that can be seen as a a bearish indication overall. Stochastics (30) have risen above the 20 line but portray a more ambivalent picture. The SPX cannot seem to break above its 20 DMA here although it has thus far bounced off its 50 DMA as support. As long as price can remain above the 50 DMA, the bulls can maintain their outlook. A close below the 50 DMA (1176 — right on the H&S neckline!) and that would hasten another selloff not unlike we saw in January and May of this year. The weekly Dow chart remains above its 200 WMA and this is a useful piece of bullish evidence since previously this line has acted as forceful resistance against further upside. For bears to really believe things have turned around, this line will have to fall. More ominously, however, the weekly MACD looks like it may be rolling over and a crossover may only be one or two more negative weeks away. This is bad news for the bulls in light of the negative divergence on this chart. The $VIX spiked higher on Friday back to the 22 level. This was a disproportionate rise (13%) given the relative small price decline. A close above the previous September high of 24 may mark a bigger move higher. And a close at that level would also be the first time the VIX would be above the 200 DMA since August. That would be a very bullish signal for the VIX and bearish for stocks. Meanwhile, 10 yr treasury yields were mostly flat last week and remain just under the crucial IHS neckline at 2.90%. Friday’s selloff in equities saw a commensurate flight to bond "quality", so we will have to see if this inverted correlation remains intact in the weeks ahead.
 This week is a real mixed bag that starts off with a tight Mars-Jupiter square. Over the past several months, this combination has usually corresponded with gains as the negativity of Mars is transformed into greater risk appetite through the optimism of Jupiter. This time around I’m less convinced it can deliver a gain since the overall picture is less supportive of gains. For this reason, there is a greater likelihood of a decline on Monday, although I am less certain of it than I was last week on the Mercury-Mars aspect. The midweek looks more positive as Mercury will move into aspect with Venus. This could bring gains on Tuesday and Wednesday, especially if Monday ends lower. They don’t look especially powerful like the Mercury-Jupiter aspect from last week, but the chances for midweek gains definitely rise on this aspect. The late week looks more bearish as Mercury approaches its conjunction with Rahu (North Lunar Node) just as Mars squares unpredictable Uranus. I would say that Friday looks more bearish than Thursday since we will see a Moon-Venus conjunction on Thursday that could conceivably boost sentiment. So we cannot completely rule out a gain for Thursday either. But Friday looks quite negative and there is a chance for a sizable decline here, perhaps something on the order of 2% or even more. So if Monday is lower, there is a good chance for an overall lower week. A more bullish scenario might be a gain Monday in the event of a dominant Jupiter and then milder gains into Wednesday that take the S&P to 1200-1210 followed by declines Friday to 1180-1190. Even this relatively bullish scenario would violate the rising channel and force bulls into a corner. A more bearish scenario which I think is more likely is a drop Monday to 1175 support as Mars overpowers Jupiter, then a recovery to 1190 by Wednesday, followed by another decline to perhaps 1150-1170 by Friday. Actually, I would not be surprised to see 1130 tested at some point. More conservatively, I am leaning towards a more bearish outcome here where we severely test the H&S support at 1170 and break below the rising channel at 1190.
 Next week (Dec 6-10) also tilts bearish given the proximity of Mercury and Mars to the ongoing Rahu-Pluto conjunction. At the same time, there is relative few exact hits so it is possible that we could see some stability return, especially early in the week. Bullish Jupiter enters Pisces on Monday while Mercury conjoins Pluto. These are potentially offsetting energies but I would nonetheless lean towards a bullish rebound at the start of the week. This will be all the more likely perhaps if the previous week ends on a negative note as I expect. The odds for a larger decline increase as the week progresses, however, as Mars approaches its conjunction with Rahu. Mars actually doesn’t conjoin Rahu exactly until Saturday so that may mitigate the bearishness but Mercury turns retrograde on Friday. For this reason, the best chance for a decline would be Friday, followed by Thursday. Overall, the week could be lower although the following week (Dec 13-17) would appear a better bet for the low on Monday or Tuesday on the Mercury-Mars conjunction. This will likely mark an interim low because a significant rally is likely after that going into Christmas. We could reverse higher near an obvious support level like 1130, or perhaps even 1040, although I don’t expect things to get quite that bearish yet. If we do go down to 1130 by Dec 13/14, for example, then the SPX could rise to 1200 by Dec 24. Another pullback is likely in the week before New Year’s, and then some volatile sideways moves are likely through much of January. So it is possible we could take a run at 1250 and that upside IHS target for January, but it seems just as likely we could bounce around between 1170 and 1220 until mid-January. Another significant move lower is likely in late January and into February. This has a good chance to take out the lows from December and may well retest SPX 1040. Overall, I expect a series of lower lows through 2011 until at least September.
5-day outlook — bearish SPX 1170-1190
30-day outlook — bearish-neutral SPX 1150-1200
90-day outlook — bearish SPX 1000-1050
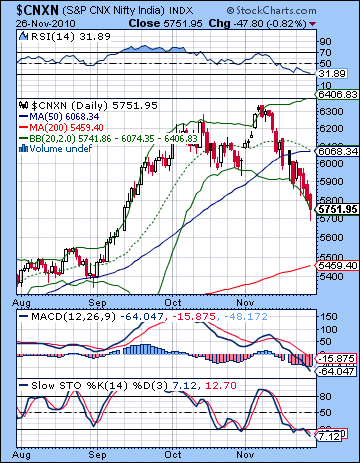 Stocks in Mumbai fell for another week as the bribery-for-loans scandal and Eurozone worries conspired to take prices lower. After briefly flirting with 20K on Monday, the Sensex finished 2% lower at 19,136 while the Nifty ended the week at 5751. While this bearish outcome was welcome given my medium term expectation, the extent and precise timing of the decline caught me off guard somewhat. I had expected we could see bearishness manifest more at the beginning and end of the week. As it happened, however, Monday’s gain was the only winning session as sellers moved in after that. Markets were coming off the twin direct reversals of Venus and Jupiter a few days prior, so that may have played a role in Monday’s rally. And the difficult Mercury-Mars aspect only asserted itself in Tuesday’s session, while it was still just one degree from exactitude. Even more puzzling was the inability of the bullish Mercury-Jupiter aspect on Wednesday to generate any buying interest as it did on other global exchanges. Clearly, Mumbai seems caught in a more bearish domestic environment as the housing loan scam threatens to implicate the government, realty companies and several banks. The late week Sun-Pluto aspect did take prices lower as both Thursday and Friday saw the losses extended. So now we have a better picture of how the market may continue to fall into that key quadruple conjunction of Mercury, Mars, Rahu and Pluto in the second week of December. Even if the ongoing problems in Europe are papered over by more EU bailouts, the housing scam is another area of uncertainty that has the potential to take stocks significantly lower over the next two weeks. As it is, these nefarious activities are plausible expressions of the continuing conjunction of shadowy Rahu with power hungry Pluto. I had previously noted how greed and distortion (Rahu) involving large organizations (Pluto) might have reflected the actions by the Fed and the subsequent criticism by its G20 trading partners. It may also be a reflection of current accusations of corruption that is now plaguing the banking and realty sectors. In any event, the financial world seems more under threat here as inflation concerns in Asia is forcing up interest rates and tightening bank reserves. This will likely reduce growth and thereby reduce the ability for India and China to drive the global recovery forward. As the Fed prints more US Dollars in the hope of kick-starting its economy, it only seems to be fueling inflation overseas and depreciating its own currency. There are very few signs of a sustained or vigorous recovery in the US. To make matters worse, bond buyers are slowly but surely starting to demand a higher risk premium on US debt. Once the Fed loses control of the bond market and it is unable to force yields lower through its buy backs, Bernanke will have no choice but to take liquidity out of the system and scare investors out of stocks and back into the treasuries. That may solve his problem in the short run, but longer term, the Fed will have to raise rates in order to entice foreign buyers of increasingly risky US debt. That will hasten another recession and plunge the world back into the red. Rest assured, another US recession is very bad news if you are an Indian exporter. This sort of scenario may unfold as soon as 2011 although the worst may conceivably be forestalled until 2012 or 2013.
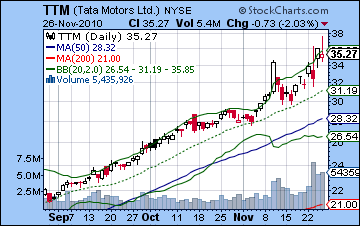
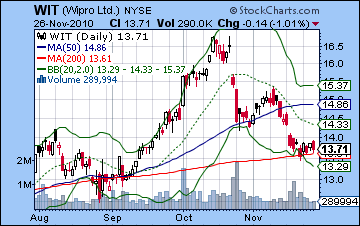
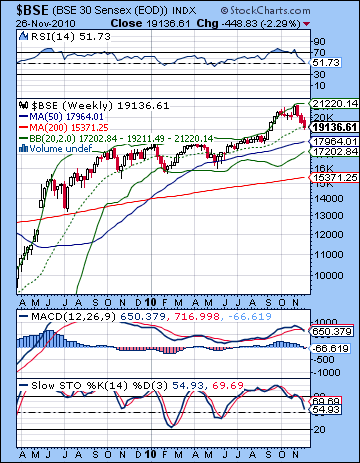 The technical picture became more complex last week as prices continued to fall below key support levels. The Nifty continued to the hug the lower Bollinger band and is now looking up at the 50 DMA which forms a significant resistance level. Perhaps even more bearish is the prospect that the 20 and 50 DMA are about to cross. If this happens, this would increase the chances of a much deeper corrective phase on the order of what we saw in April-May. On the other hand, there is some reason to expect a technical bounce in the near term. Friday’s session closed on a rally off the day’s lows and formed a bullish inverted hammer candlestick. Moreover, the Nifty has apparently bounced off support from the summer’s rising channel. This was a previously important resistance level and is now acting as support around 5700-5750. Stochastics (7) are very oversold here and may bounce higher. RSI (31) are very close to the oversold 30 line so that may also bring in some buyers in the short term. Previous bottoms in February and May saw stocks reverse higher when the RSI slipped a little below the 30 line. In both instances, it is worth noting that there were two touches of the 30 line, where the second one marked the interim low before a reversal higher. If this correction is roughly the same size as I expect it will be, then there may similarly be two touches at or just below the 30 line before it reverses higher. I should note that there’s a chance we’re actually close to that second touch now since the first touch may have occurred around the 35-38 level last week, although from a purely technical perspective, the odds are that there is more downside before we reverse. Both previous corrections seemed to find support from the 200 DMA, although the February low was somewhat above it while the May low was somewhat below it. Nonetheless, the 200 DMA offers a general guideline about possible support. It is currently at 5459 (18190 on the BSE) so that is a rough level we may want to keep in mind in terms of any possible lows made over the next two weeks. Daily MACD on the Nifty chart has fallen below the zero line and thus makes it a somewhat less appealing case for shorting. It will be very important to see how low the MACD goes on this corrective move. If it breaks below the May low of about -85, then it will create a negative divergence and thus add weight to the notion that we are heading for lower lows in the medium term. It currently stands at -64. And even more compelling bearish divergence will be created if it goes lower than -100 which is the February MACD low. That would suggest that the Nifty could well be headed below 4700 over the next two to four months. The way things are shaping up, I think that outcome is quite possible. The weekly BSE chart adds support to this bearish view as MACD is now in a double whammy of a bearish crossover and a negative divergence. RSI has pulled back to 51 but has yet to make a lower low with respect to previous corrections. If it can track below 45 which was the May low, then it would increase the chances for a much larger and longer corrective move in 2011. In this way, weekly RSI would feature not just lower highs as it does now, but also lower lows. Not surprisingly perhaps, Wipro (WIT) had another bad week and now sits poised on the 200 DMA. A close below here would threaten to the July low. Against this gloomy backdrop, Tata Motors (TTM) had a positive week but it also does not look overly bullish. The inverted candle/shooting star in Friday’s session should not offer much comfort to bulls, especially in light of the high down volume this week.
 This week also looks bearish although there is a real chance for gains, especially around midweek. Monday begins with a Mars-Jupiter aspect. During the course of the preceding rally, all Mars-Jupiter aspects produced positive days. I’m less convinced that will be the case here, although it is certainly possible. Given the tension in the overall transit picture, I would lean towards a down day as Mars could well overpower Jupiter’s optimism. There is a minor aspect between Mercury and Venus on Tuesday and into Wednesday that could push up prices on either of those days with Tuesday looking somewhat more bullish than Wednesday A two-day rise seems quite unlikely from this combination. We could see the market selloff again towards the latter part of the week as Mercury approaches its conjunction with Rahu on Friday while Mars is in aspect with Uranus. This is quite a volatile and bearish combination of planets so we could see a large decline here. A more bullish scenario might be a rise Monday and continuing into Tuesday that takes the Nifty back to 5900 with another decline by Friday so that we get a close around 5700-5750. The bearish scenario seems more likely however: lower on Monday to perhaps 5700 with a brief rise into midweek to 5800-5850, then down hard into Friday to 5600-5700. Even a bullish unfolding here for three days would not be enough to push the RSI significantly higher. For that double bottom in the RSI, there should be some kind of rally attempt that fails before price falls to a lower low. It’s possible it could happen this week, but it seems less likely. Perhaps the beginning of next week is more likely.
 Next week (Dec 6-10) may begin positively as Jupiter enters sidereal Pisces. This is often a bullish influence. However, we can still note a potentially bearish Mercury-Pluto conjunction. My guess is that the bulls will prevail early in the week, especially if we have finished the previous week on a down note. If Monday is higher, then Tuesday is likely to fall on the Moon-Mercury-Pluto conjunction. While declines are possible on various days here, Friday is perhaps more likely for a sizable decline as Mars approaches Rahu. The actual conjunction will not occur until the weekend so that may temper the downside somewhat although since Mercury turns retrograde on Friday, the bears may have the planets on their side. The beginning of the following week (Dec 13-17) is likely to begin negatively as Mars conjoins both Pluto and Mercury on Tuesday. There is a fairly good chance that we will see some kind of interim low formed around this time. Then we should see a relief rally into the last week of December. After a brief but deep fall just before New Year’s, there could be more upside in the first half of January. This rally will likely top out below the 6350 level, and may well only reach 6000 before heading lower in the second half of January and into February. I am expecting another big move lower at this time. It is quite possible we could break below 5000 by March and retest the February low of 4700. Generally speaking Q1 2011 looks quite bearish, as does the entire year. Even with a significant rally in spring or early summer, the mood will likely be quite bleak by August and September. I would not rule out 4000 on the Nifty by October.
5-day outlook — bearish NIFTY 5600-5700
30-day outlook — bearish-neutral NIFTY 5500-5800
90-day outlook — bearish NIFTY 5000-5500
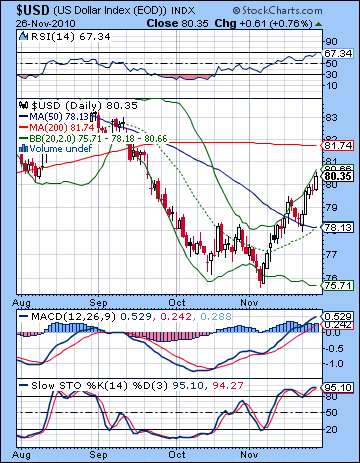 As the Eurozone started taking on water again on soaring bond yields and new bailout packages, the US Dollar rallied strongly last week finishing above 80 on the USDX for the first time since September. The Eurodollar closed near 1.32 while the Rupee approached 46. I had been decidedly agnostic about the Dollar’s prospects here although I noted some possibility for gains before and after the midweek Jupiter influence. Indeed, the greenback did rise early in the week as expected and followed through nicely in Friday’s session also. The only thing missing was much of a decline on Wednesday’s Jupiter aspect. This is perhaps a sign of the Dollar’s growing strength in the medium term as it has punched above resistance at 80 and the head and shoulders neckline that dates back to March. This has postponed the apocalyptic scenario for a while as the Dollar appears headed higher. We can spot an inverted head and shoulders pattern with the recent low that suggests an upside target of 83.5. That seems fairly ambitious in the short term but may be well worth considering. It’s still on the wrong side of the 200 DMA (81.7) and that may become significant resistance for weak bulls as they take profits from the recent rally. MACD is looking quite strong, however, as it has crossed north of the zero line in a bullish crossover and a positive divergence is evident with respect to the previous August high. This offers some support to the notion that the Dollar will reach above the 83.5 level in the medium term. RSI (67) is similarly in a positive divergence and may well run higher although its close proximity to the 70 line now may suggest some profit taking could be tempting. The 20 and 50 DMA are about to crossover and this could create more bullish momentum for the Dollar. I would note, however, that we got a similar crossover in August which did not last long. One possible difference was that in August price failed to move above the 50 DMA. This time it is already above the 50 DMA so that is one less thing holding it down. Overall, the technicals would favor the bulls, but only if it can hold above current levels at 80. There is a fairly significant falling trendline that the Dollar breached on Friday. It is still early days on the breakout so if it falls back it may be a fake out.
This week looks more mixed as some early week patterns could increase risk appetite and prompt a flow back into the Euro and other currencies. Monday’s Mars-Jupiter aspect could go either way, but it often corresponds to increasing risk tolerance so there is a chance it could boost the Euro. The midweek may be somewhat more reliably bullish for the Euro as the Dollar horoscope looks weakened by some Saturn influence. The end of the week may bring another flight to safety so we can expect the Dollar to resume its rally at least by then. There could be some more upside to the Dollar next week although I think a pullback is likely to begin before Christmas. This may move the Eurodollar back to 1.35-1.37. Another wave higher in the Dollar is likely in January, however, so we could see 85 by then. This would translate into about 1.20-1.22 EUR/USD. The Dollar is likely to weaken into February and this may well correspond to an equities correction. This is perhaps a sign that the impetus for the selloff will be from the US as the economy will show new signs of flagging. We should see a solid bounce into April that could continue into June. By contrast, Q3 looks mostly negative. Generally, I think the Dollar could move in a range between 76 and 85 until Q4 2011 — or about Eurodollar 1.22 and 1.42. In Q4 2011, the Dollar is likely to gather strength.
Dollar
5-day outlook — neutral-bullish
30-day outlook — neutral-bullish
90-day outlook — neutral-bullish
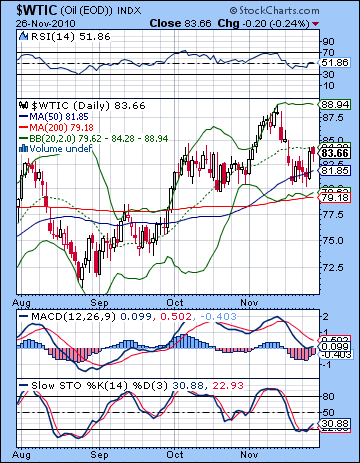 A good employment report and tightening supply prospects pushed crude oil higher last week closing above $83. This bullish outcome was in keeping with expectations as I thought the midweek Mercury-Jupiter aspect would fuel optimism. And how — Wednesday’s session at the time of the aspect saw a big 5% rally. Not surprisingly, the beginning and end of the week were more bearish as the Mars influence eroded speculative enthusiasm. The technicals have deteriorated since last week. The rally only took price back up to the 20 DMA as that moving average is now flat. The RSI (51) shows a negative divergence with respect to previous lows suggesting that current support at $80 may not hold in the coming weeks. MACD shows a similar negative divergence and has fallen to the zero line. Is price taking a breather before continuing lower or will be reverse? We can see the rough outline of a bearish head and shoulders pattern with $84 as the LS and RS and the head at $88. If price fails to break much above current levels, then there is a growing possibility that it could head lower, especially if and when it breaks below the neckline at $80. If this were to occur, then the downside target would be roughly $72. There is a fair amount of support at the $80 line so we may have to wait for the worst of the upcoming quadruple conjunction for that pattern to be realized.
This week leans to the bears although there is some upside potential, especially midweek. Monday is a bit of a puzzle as the Mars-Jupiter aspect often reflects speculative excess that lifts prices. However, there is a difficult placement in the Futures chart that makes me less confident that Monday will be higher. The midweek period is somewhat more reliably bullish as Mercury is in aspect with Venus. The late week period is more difficult again as Mercury conjoins Rahu. The Futures chart is mixed although it, too, leans bearish. Overall, there is a reasonable case for a bearish outcome here, although I would not rule out a move higher before retracing lower. Next week may begin positively, but the mood may darken as Mars approaches Rahu by Friday. I would expect we may have a shot at $72 by this time, or by early the following week. We should see a rally attempt after Dec 14, although it is unclear just how far it can go. The Jupiter-Uranus conjunction will be strengthening here so that augurs well for bulls but there will also be a series of difficult short term aspects that could erode gains fairly quickly. I think it is somewhat unlikely that crude could reach $90 in January, although it is still possible. Regardless how high it goes, crude is likely to begin a significant move lower once Saturn turns retrograde on Jan 26. This may begin a corrective move that lasts well into February.
5-day outlook — bearish-neutral
30-day outlook — bearish-neutral
90-day outlook — bearish
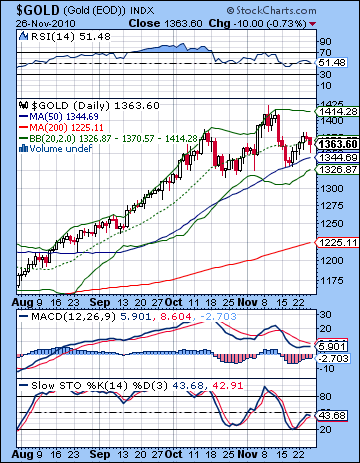 Gold managed a small gain last week as worries over a possible Korean conflict and European debt offset any losses to the strengthening Dollar. After briefly trading above $1380, gold closed at $1363 on the continuous contract. This was largely in keeping with expectations as I thought it was a very mixed sort of week with the bulls coming out on top. The midweek rally went mostly according to plan as we got gains Monday and Tuesday. I thought we might catch more downside from the separating Mercury-Mars aspect. Wednesday’s lack of any more upside was also a little surprising, although Friday was lower as expected. Gold bulls should not be feeling too good these days as the head and shoulders pattern is staring everyone in the face. The early week rally equaled the left shoulder at $1380 for a near-symmetrical pattern with an upward sloping neckline. If gold cannot rise above $1385, then it will be increasingly vulnerable to pullbacks. If this pattern were to complete, the downside target would be around $1240. This is roughly where the breakout was from the June highs so that adds the salience of that level. The technicals look quite weak here and point to lower prices going forward. MACD is falling and in a clear negative divergence. The same is true for the RSI (51) as the most recent low is lower than the October low. Worse still is that we can see a falling series of highs in the RSI. Stochastics (43) shows the same divergence to the downside indicating the possibility of going lower. Price is currently attracting some sellers at the 20 DMA so that may add to the resistance offered by the H&S. Buyers may come in at $1260 but if the decline is quick and sudden, it is possible it could bottom out closer to the 200 DMA at $1225.
This week looks mixed again with gains tending to focus in the earlier part of the week and the risk of declines increasing by Friday. That said, Monday could still go either way although I would tend to favour a positive day. Tuesday looks more positive on the Mercury-Venus aspect and it is conceivable this could carry into Wednesday. The end of the week looks more bearish as Mercury approaches Rahu and Mars aspects Uranus. So we could end up lower by Friday. Next week we could see a new lower low by the end of the week, perhaps below $1300. If this quadruple conjunction pans out as expected — admittedly a big "if" when discussing gold — there this is a decent chance we could see that bottom around $1250. I wouldn’t quite say its probable but the opportunity is there. Gold should rally until Christmas but then it looks increasingly vulnerable to selloffs. We may have therefore seen the top for now as January does not look good for gold . I would expect a new low that is below anything we see in December by late January or February.
5-day outlook — bearish
30-day outlook — bearish-neutral
90-day outlook — bearish

