Summary for week of January 3 – 7
Summary for week of January 3 – 7
- Stocks may rise early in the week but prone to declines after; Tuesday’s solar eclipse could mark shift
- Dollar likely to rebound by midweek
- Crude vulnerable to declines after eclipse
- Gold may rise early but declines more likely by end of the week
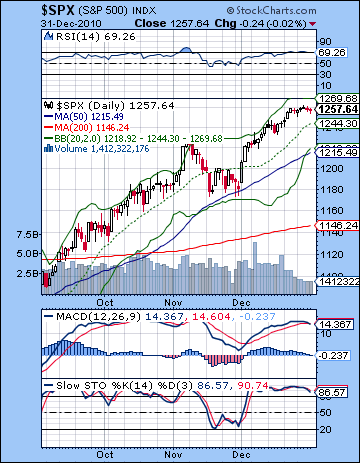 Stocks ended the year mostly flat as news of China’s rate tightening was offset by good retail data and better than expected unemployment numbers. The Dow gained a whopping 4 points on the week and closed at 11,577 while the S&P500 finished 2010 at 1257. The forecast bearishness from the Mars-Saturn aspect was MIA last week as the indexes barely moved all week long. I thought we would see more downside on this aspect but the whole week was proof of the underlying support for the market from the ongoing Jupiter-Uranus conjunction. Certainly, I had noted the likelihood of fairly firm prices up to this conjunction, but I did think there was a chance we could see an early selloff ahead of the fireworks in early January. As it turned out, the depressing effect of the Mars-Saturn may simply have neutralized much further upside from the Jupiter-Uranus influence. So now we’re in the thick of it as 2010 recedes into memory and a new year begins this week with a solar eclipse and the culmination of the aforementioned bullish conjunction. Could this really be some kind of watershed moment that turns sentiment around in a significant way? The simultaneous occurrence of both astronomical measurements on the same day, Tuesday January 4, is definitely a tempting proposition. It may prove to be ‘just a coincidence’, or it could completely transform the way the market is operating. I tend towards the latter view, although I’m not fully convinced that a correction can begin right now. I would only call it a probable outcome here, but perhaps with a somewhat equivocal 60-40 sort of split. On the bearish side of the ledger, Tuesday’s solar eclipse would tend to suggest an interruption of the rally that started back in the summer of 2010. Eclipses are famous for introducing new factors into the mix and as we saw in January and July, the eclipse period closely coincided with reversals of the overall market trend. While they are not exact markers of trend changes, when they are effective it usually takes only a few days for their effects to be felt. More ambivalent, however, is the ultimate effect of the Jupiter-Uranus conjunction. While much of the post September rally can be seen in terms of the close proximity of Uranus’ risk-taking with Jupiter’s optimism, this is a powerful duo that could conceivably push up stocks for a little while longer. When aspects culminate, they either lose their power almost immediately or may peter out gradually and thereby provide more price support in the weeks that follow. So while there is some evidence to suggest we could see stocks decline very soon after the eclipse, there is nonetheless a case to made for more of a mixed picture in January until a more reliably bearish influence appears in the form of the Saturn retrograde station. So that perhaps is the more bullish scenario here: a mixed or even rising market into mid-January and then down quite steeply into February. A more bearish outcome would be a top on Monday or Tuesday followed by a decline that lasts into February.
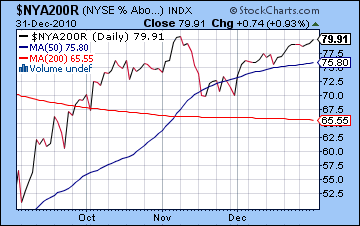
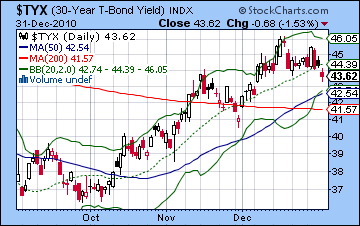
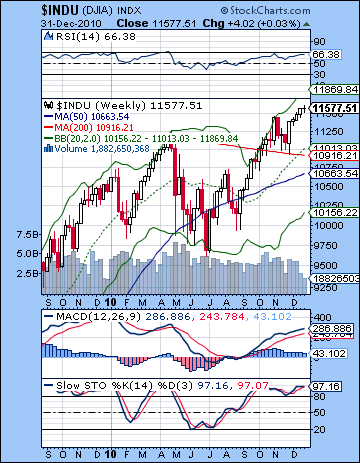 The technical picture is still largely bullish although we can see the usual reasons for skepticism. The SPX broke some short term trendline support on Monday and moved up the bottom trendline through the week. From a medium term perspective, it is still very much in the rising wedge pattern and is close to bumping up against resistance. Depending on how one draws this wedge, the resistance may be either at 1260 or 1280, with the latter level yielded by the August high and the August low. The 1260 wedge resistance is formed by connecting the tops from June and November. Price is still trading above the 20 and 50 DMA suggesting an absence of value for traders wishing to go long. The case for the bulls is further hampered by RSI (69) now sitting very close to the overbought level. It would take some major positive news to move the RSI above the 70 line for any length of time. The bulls also cannot look too favorably on the daily MACD which has actually begun a bearish crossover and is in a clear negative divergence. Not to say that these patterns are 100% accurate in foreshadowing lower prices — far from it — but they do not make a compelling case for going long. Stochastics (86) are similarly overbought and apparently losing some steam here. Support is likely found near the 20 DMA (1244) which has sometimes provided support in previous rallies. In the event of a deeper correction, the 50 DMA (1215) may bring in new buyers as tentative bulls may seek better buying opportunities. The 1215-1220 level is also fairly close to the bottom of the wedge so that is another reason why prices should hold there, at least initially. A move below 1215 would be bad news for the bulls and would likely hasten a decline down to 1125-1130 which is the bottom of the rising wedge that dates back to March 2009. The significance of this level is underlined by the fact that it also matches the neckline in the IHS pattern that prompted this rally after July. It is much the same cautiously bullish picture in the weekly Dow chart as the 200 DMA has acted a firm support for prices. But the indicators are very close to topping out here. RSI (66) can only go a little higher before hitting the 70 level. This may well equate to 12,000 on the Dow should it come to that, although it may not quite make it all the way there. The potential negative divergence is still in play here from the April 2010 high. Stochastics are at 97 and likely have little upside here. In the event of a minor correction, the Dow would likely come back to the 200 DMA at 10,900 (about 5% from here) which would roughly parallel a pullback to 1215 on the SPX. Such a mild correction would keep the rally very much intact and would likely encourage a run to 1300 or 1350. I don’t quite see this happening, but it would be the thinking of market bulls. A deeper correction would likely test the bottom Bollinger band at 10,100. This would amount to a 15% correction and would correspond to about 1100 on the SPX. This is close enough to the key 1125 support level to keep it in mind. The rallies continues to lose breadth as the number of stocks above their 200 day moving average is still below where it was in November, despite the blue chip indexes climbing to higher levels. And the current reading of 79 is still well below the reading of 86 measured in April 2010 before the flash crash. Meanwhile, the bond market recovered some lost ground last week as yields on the 30-year treasury fell below 4.4%. This was no doubt welcome news to Ben Bernanke whose entire strategy hinges on lower rates in order to jump start the moribund housing sector. So far, it isn’t working but it will bear watching to see if long bonds find any buyers.
 This week is a potentially critical moment for the market as Tuesday’s solar eclipse falls on the same day as the culmination of the Jupiter-Uranus conjunction. There is a real possibility we could see a top formed this week. Ahead of the eclipse, we may well get another up day or two as Venus is in aspect with Jupiter. Monday is perhaps the best bet for a gain with Tuesday also somewhat positive although there is considerably more downside risk on Tuesday. Given the intensity of the influences at work, I would not rule out a crash-type situation here. In addition, there is a close aspect between Mercury and Mars through much of the week here that is also a possible drag on sentiment. The other major aspect is a square between Sun and Saturn that is exact on Thursday and perhaps lasting into Friday. So even without the eclipse, there are bearish aspects to contend with here. Overall, the week is a very good candidate for lower prices. A more bullish outcome might be a rise above 1260 (to 1280?) on Monday with a reversal intraday Tuesday. Then a test of the 20 DMA at 1244 by Thursday’s Sun-Saturn aspect with a possible recovery Friday. A more bearish unfolding would see a rise Monday above 1260 but a more serious downdraft Tuesday and Wednesday with a possible testing of the 50 DMA at 1215 by Friday. I would lean towards the bearish outcome here, although I would caution that the Jupiter-Uranus conjunction may have some juice left in the tank that could postpone a significant correction until late January.
 Next week (Jan 10-14) looks more positive for short term aspects, although it will be harder to gauge the medium term effects of the weakening Jupiter influence. The start of the week looks bullish on the Mercury-Jupiter aspect with enthusiasm moderating after that. The end of the week could see flat to negative, although the week as a whole should be positive. The following week (Jan 17-21) should also begin favorably on the Sun-Jupiter aspect with more uncertainty by midweek and after. I would not rule out another up week here, although it seems less positive than the previous week. After that, the picture darkens considerably as Mercury moves into square aspect with Saturn just ahead of its retrograde station on Wednesday January 26. This looks like the start of another move lower, and probably a sharper decline than anything we may see in early January. Whether or not the market is falling from new highs or lower highs remains to be seen, but the planets look mostly bearish for the first half of February so a 10-15% decline seems quite possible here. Some recovery is likely in the second half of February but early March looks bearish and the month overall could be mixed at best. Q1 should be bearish overall with significantly lower prices by the end of March, perhaps testing support around the 200 DMA or even lower. Q2 looks more bullish with a major rally likely starting in early May at the latest. This could mark an up trend that lasts into June or July. Just how high it could go remains an open question. I cannot rule out higher highs (1300?) by July 15 but a lot will depend on what kind of correction we see in February. August and September look very bearish, and we may see much of the gains of the preceding rally wiped away. After another rally in October, the end of the year looks very bearish. So as I see it now, the highs for the year could either come in January or, if the February correction is only 10-15%, then in July. The low for the year seems likely to occur in Q4 although that is more of a guess at this point.
5-day outlook — bearish SPX 1220-1230
30-day outlook — bearish-neutral SPX 1200-1250
90-day outlook — bearish SPX 1100-1200
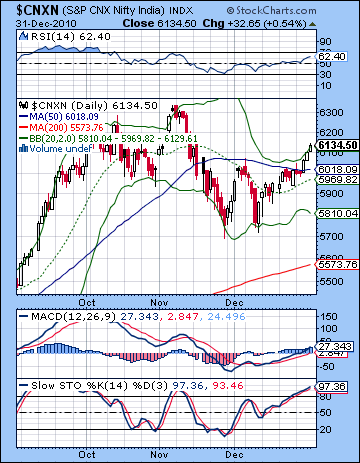 In keeping with the overall up trend this year, stocks gained ground last week as new economic data promised to boost the corporate bottom line. The Sensex rose more than 2% to 20,509 while the Nifty finished the year at 6134. Alas, the Mars-Saturn aspect proved to be no match for the ongoing Jupiter influence from its conjunction with Uranus. While I had expected some price support from the ongoing Jupiter-Uranus aspect, the absence of any significant downside here was disappointing. As it turned out, only Monday saw any kind of decline and it was extremely modest indeed followed by a mostly flat Tuesday. These two days roughly coincided with the Mars-Saturn square and it was all bullish after that as whatever minimal negativity faded and the Moon-Venus aspect took over for the rest of the week. At least the late week rally manifested largely as expected as we headed into the exact conjunction of Jupiter and Uranus this week. Will the enthusiasm for the rally suddenly fade once this conjunction has passed? Past experience would suggest that such an outcome is very possible, it there remains significant levels of uncertainty. Once bullish conjunctions culminate, there are two possible trajectories for the market. Either (1) the market sags very soon after — usually a matter of hours or days — and we begin a corrective phase or (2) there is a kind of residual bullish feeling that can last for several weeks or at least until some greater bearish influence comes into play. The present circumstance is complicated by the fact that a solar eclipse is due for the very same day as the exact Jupiter-Uranus conjunction on 4 January 2011. Eclipses also have the potential to mark major reversal points in sentiment and can correspond with changes in direction within days of their occurrence. A solar eclipse occurred just days before the correction began in January 2010 and the July bottom in most global markets occurred just a week before the next solar eclipse. So the simultaneous occurrence of those two astronomical factors increases the likelihood of the quick reversal scenario outlined in (1). That said, it is still an uncertain outcome and it is therefore conceivable the market could continue to rise into mid to late January. I don’t think such a rise is probable but it is still an outcome to consider. But what can be said with more confidence is that a reversal is close at hand, whether it happens this week upcoming or perhaps in late January when Saturn goes retrograde. I do think that 2011 looks quite challenging for equity markets generally, and Indian markets in particular. Given the outstanding influences this year, I think the markets will be hard very pressed to repeat last year’s 17% gain. Even a flat performance would be quite an accomplishment and I think there is considerable downside risk going forward as Q1 and Q3 look generally bearish. We will have to see whether Q2 and Q4 will have enough bullish energy to keep markets above water.
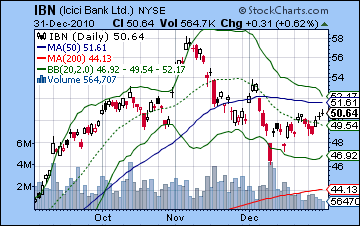
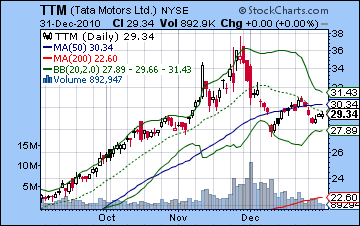
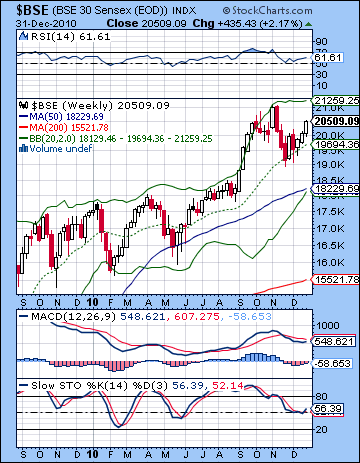 The bulls wrestled back control of the market last week as the Nifty broke above the 50 DMA. This was a major resistance level and thus strengthened the bulls’ case significantly. Price is now bumping up against the upper Bollinger band here and has retraced about 61% from the November low. Since this is a key Fibonacci number, further gains will likely see another push to the 78% retracement level, which would be about 6200 on the Nifty. Bulls are poised for the next potential hurdle as the 20 DMA may soon cross the 50 DMA. This would be another bullish signal that would bring new buyers into the market. The technical indicators would suggest there is further possible upside. The RSI (62) is rising but has some room left before it reaches the overbought area. Of course, November’s high equated with a 68 reading on this indicator so there is no necessary impetus to the 70 line. In fact, if the pattern of lower highs continues, the RSI could well peak below the 68 level this time around. MACD is still in a bullish crossover and has now crossed the zero line. Stochastics (97) are getting seriously overbought here and may not have much more room to move. What was resistance is now acting as support as the 50 DMA at 6018 may break any decline in the event of a mild correction. Below that, look to the bottom Bollinger band area around 5800 as the next key support level. This roughly coincides with the rising channel off the May 2010 low. A break below this channel support would likely hasten a test of the 200 DMA at 5500. The weekly BSE chart still suggests the 20 WMA as key support at 19,700. A more severe correction may test the 50 WMA at 18,200. This is what happened on May 2010 and we are likely to see it again sometime in Q1 based on the astrological indicators. The weekly MACD remains in a bearish crossover here while RSI (61) is rising and has some room to go before reaching the overbought area. ICICI Bank (IBN) raised rates last week and made modest gains here although it still hasn’t completely vaulted past the neckline in the head and shoulders pattern. It’s very close to doing so at $51 but many investors would no doubt like to see a close above the 50 DMA at 51.61 before dipping their toes in. At the moment, there may be too much risk that it will break lower and fulfill the H&S with a downside target of $42. With rates rising, Tata Motors had a tough go last week as prices slumped. It appears to be facing strong resistance from the 50 DMA at $30. While there is a potentially bullish double bottom pattern here, cautious investors may wait for a close above $31 before jumping in. Overall, the technical picture favours the bulls as long as the Nifty does not fall below the 50 DMA at 6018. A close below that level would open up the possibility for a deeper selloff. For the bulls, the next key level may be around 6200.
 This week may prove to be an especially important time in the market as Tuesday’s solar eclipse coincides with the culmination of the Jupiter-Uranus conjunction. For the reasons outlined above, there is a very real possibility that the market may be topping here. I am not fully convinced that this is the case, however, so we must allow for alternative outcomes, such as higher prices through the next three weeks in January. Certainly, there is a very good chance for gains early in the week on the Venus-Jupiter aspect. Monday would appear to be the most reliable up day with Tuesday also potentially higher. That said, Tuesday could also be lower as the Mercury-Mars aspect begins to dig in. Due to Mercury’s slower than normal motion this week, Mercury and Mars will form a tight aspect during the midweek period which may put pressure on sentiment. The late week period features a Sun-Saturn aspect which may also be burden on prices so I would not be surprised to further downside then. So a bullish scenario here would be a rise into Tuesday above 6200 — maybe significantly above — and then a retreat after that down to 6100 or so. A more bearish scenario (and more likely I think) is a rise to 6200 and then a reversal on Tuesday or Wednesday with a close Friday somewhere near 6000-6050. Given the intensity of the aspects involved this week, I would not rule out a large move down here although I would not say it is probable. We will have to wait and see what the effects of the eclipse are after Tuesday.
 Next week (Jan 10-14) looks quite bullish at the start of the week, and this is all the more likely if the previous week has ended in the red. The Mercury-Jupiter aspect will likely tilt Monday’s session to the bulls and it may well carry Tuesday higher also. The positive mood may diminish somewhat through the week, although I don’t see any obvious negative aspects. Friday looks like it could be weaker. The following week (Jan 17-21) also has some upside potential as the Sun aspects Uranus and Neptune early in the week and then Jupiter in midweek. Down days are more likely towards the end of the week, although this has the potential for the second consecutive week of gains. After that, the market looks weaker as Saturn prepares to turn retrograde on 26 January while in bad aspect with Mercury. This is a high probability down move that should carry into the first week of February. Some rebound is likely in mid to late February but March looks mostly bearish as Jupiter opposes Saturn. Significantly, this will coincide with the post-budget period which many are already suggesting could be difficult for the markets. Generally, Q1 looks bearish with a low occurring in March or even April. It is possible that this low could be anywhere from 5000 to 5500 on the Nifty although these numbers are quite speculative. A major rally is likely to occur in Q2 with prices rising substantially into May, June and possibly July. Another leg down is due for August and September as Saturn is in aspect with Ketu. This looks quite steep and may be a larger than the Q1 decline.
5-day outlook — bearish NIFTY 6000-6100
30-day outlook — neutral NIFTY 6100-6200
90-day outlook — bearish NIFTY 5000-5500
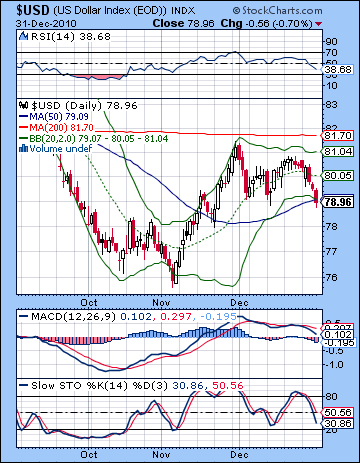 The Dollar got roughed up last week as more money flowed into risk assets. It closed near 79 with the Eurodollar finished the week just under 1.34 and the Rupee at 44.6. I was mistakenly bullish last week thinking we would see more early week upside for the Dollar. As it happened, only Tuesday was higher with the predicted declines coming in spades later in the week. The Dollar closed Friday at a crucial support level — sitting just below the 50 DMA. Another close below this level, and it may well see a rush to the exits. And yet the 50 DMA is a support level with a track record (Nov 22), so this may be an inflection point that sees the Dollar rebound. MACD is in a bearish crossover and falling and is still well above the zero line, perhaps indicating further room to fall. RSI (39) is in bad shape and is in a steady decline although I would note that a reversal here would set up a very nice bullish divergence with respect to the previous low in November. Stochastics (32) are coming close to being oversold but are not there yet. The weekly chart saw a bearish close below the 200 WMA, although the MACD chart is still in a bullish crossover. So the Dollar is still in its current trading range between 79 and 81.5. Its residence at the bottom Bollinger band line could be the jumping off point for another run to the top band or just a jump off point for a swan dive down to 76. I’m sure there will be many investors watching to see if the 50 DMA support holds this week. Failure to do so could be very bad news for the Dollar.
The planets this week favor the Dollar but the early week period could be difficult as the Venus-Jupiter aspect generally favors risk assets such as the Euro and stocks. So I would not be surprised to see more downside, perhaps forming a very convincing fake out below the 50 DMA. Tuesday could be more positive, with Wednesday looking better still. Friday may be more iffy for the Dollar, despite the apparently anti-risk aspect of Sun-Saturn. While this would normally push investors to the safety of the Dollar, I am more reluctant to forecast such a move here due to some thorny placements in the USDX natal chart. Nonetheless, I think there is a good chance we will see the Dollar rebound here and finish the week higher. Next week is likely to continue the trend higher, although it may be quite cautious. There is a good chance that much of January will see better sentiment towards the Dollar with a possible interim high put in around Jan 21 or 24. I would not rule out further upside going into February, but the situation looks more precarious then.
Dollar
5-day outlook — bullish
30-day outlook — bullish
90-day outlook — bearish-neutral
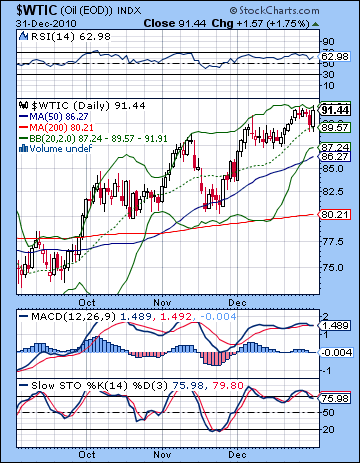 After a volatile week, crude oil finished mostly unchanged above $91. I had expected more downside here on the early week Mars-Saturn aspect but Thursday’s tardy decline was more than made up for by Friday’s bullish engulfing rebound. At least Friday unfolded more according to plan as the Moon-Venus aspect made speculation a more appealing activity. Not surprisingly, crude is having difficulty punching above current levels of resistance. It is in a rising wedge here with resistance just a little above $92 and support around $86. While it is pushing up against trendline resistance and the top Bollinger band, RSI (63) still has some room to run higher before becoming overbought. MACD is more equivocal, however, as it is about to have a bearish crossover although it is still rising. Crude is all momentum now as price has risen above the 20 and 50 DMA. While Thursday’s correction tested the 20 DMA, crude is increasingly overdue for a test of the 50 DMA at $86. In the event of a deeper correction, we would find significant support near the $80 level which coincides with the 200 DMA and the previous low. A correction back to $80 would only shake out weak bulls however, and would likely fuel another rally attempt. Only a break below $80 would cause bulls to question their positions.
This week will likely begin on a positive note as Venus is aspected by Jupiter. As a result, we should see at least one up day Monday, with a good chance for further gains Tuesday. It seems likely that crude will break above $92 here. But its fortunes could change quickly once the Mercury-Mars aspect takes hold. This is likely to occur either Tuesday or Wednesday although the aspect is fairly close for most of the week. The late week Sun-Saturn aspect also seems bearish although perhaps less so. Overall, there is a good chance for declines this week. Next week may also begin favourably on the Mercury-Jupiter aspect but the midweek period looks more uncertain. It is possible that we will see crude prices stay quite firm through much of January, at least until the Saturn retrograde on January 26. The closer we get to that date, the greater the chances of the price trend reversing and heading south. I am expecting a significant correction in Q1, most likely starting in late January and February which will take prices to $80 or below.
5-day outlook — bearish
30-day outlook — bearish-neutral
90-day outlook — bearish
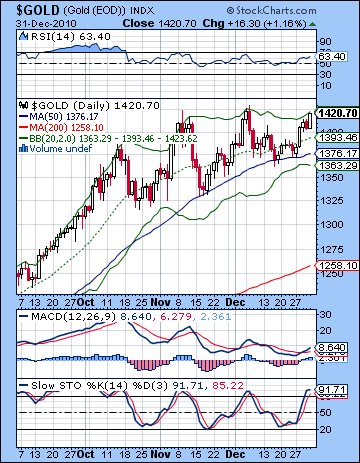 Gold climbed back to its previous highs last week closing at $1420 on the continuous contract. Although I had been bearish last week, I had been equivocal about my forecast since there was a few missing pieces in the key natal chart. The early week Mars-Saturn aspect had no measurable effect as gold showed gains through Wednesday. The Moon-Venus was net positive with Friday’s gain exceeding Thursday’s pullback. Gold has formed a triple top here in which the onus is on the bulls to push it to new highs. Price has been strongly supported by the 50 DMA over the past several months so that is a key resistance level now at $1376. A close below that level would likely shake out weak gold bulls — and perhaps some strong ones as well. Below that, the 200 DMA at $1260 may well act as a magnet in the event of a major correction. At this point, even a correction to $1250 would not cause too much trouble for the bull market in gold. Only a decisive break down of price below this level would cause some panic among gold bulls that the future was not as shiny as they expected. MACD is in a fairly unconvincing bullish crossover but appears to be riding the down wave of momentum so it remains to be seen if it can break out higher. Stochastics (91) are back into the overbought area so that does not make a compelling case for going long here. RSI (63) is trying to rally back to the 70 line and may well get there, although it stopped a little short the last time.
This week may well begin with more upside on the Venus-Jupiter aspect on Monday and possibly Tuesday, but the picture darkens significantly after that. There is a good chance for a down week here and a down month also. There is still some question when the correction in gold will begin — right after the eclipse or around the time of the Saturn retrograde period on January 26. I believe it is more likely to begin near the beginning of January with some potentially large downside late this week. Not only is the Jupiter-Uranus conjunction culminating, but Mercury-Mars and Sun-Saturn are likely to be two more sources of bearishness for the gold market to deal with. January seems mostly bearish and the bad vibes will likely extend into February. A rapid test of the 200 DMA at $1260 is possible in the coming weeks, although I admit it has the feel of a pipe dream given the immense rally we have witnessed through 2010. From early to mid-February, there will likely be another rally attempt for gold, and it could be significant although fairly short-lived as March looks like another move down. Generally Q1 is looking more bearish for gold with a possible bottom forming in March, or more likely, in April. Then we may see another rally that lasts into July. At this point, I doubt it will exceed current highs of $1400-1450 but it will depend on how deep the correction is in Q1. And then in September, the Saturn-Ketu aspect will force another correction that extends into the end of the year. While it is still possible that gold could make new mid-year highs, the second half of 2011 does look quite bearish so it seems more likely that it will finish 2011 below current levels.
5-day outlook — bearish
30-day outlook — bearish
90-day outlook — bearish

