Summary for week of January 10 – 14
- Stocks bullish early in the week but mixed as week progresses
- Dollar may decline, especially early in the week
- Crude may recover this week, Monday and Tuesday most bullish
- Gold rebound likely Monday or Tuesday, more mixed afterwards
Summary for week of January 10 – 14
- Stocks bullish early in the week but mixed as week progresses
- Dollar may decline, especially early in the week
- Crude may recover this week, Monday and Tuesday most bullish
- Gold rebound likely Monday or Tuesday, more mixed afterwards
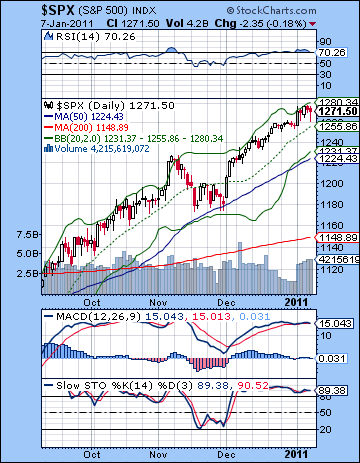 Stocks moved higher for the sixth straight week as early optimism from the ISM manufacturing data carried through for the rest of the week despite some less than thrilling employment numbers. The Dow rose about 1% to close at 11,674 while the S&P500 finished at 1271. Despite Tuesday’s solar eclipse, the market continued its amble up the wall of worry without looking back. Given the potential importance of Tuesday and the possibility of a top, this outcome was disappointing, although there were some bright spots, too. As expected, Monday was the most bullish day of the week as the Venus-Jupiter aspect brought in a surge of buying with the positive manufacturing data. This was also perhaps more likely given it was the first day of trading for 2011, which tends to have a bullish bias. I wondered if the SPX might go as high as 1280 to the top of the rising channel, and it almost did. However, what I did not expect was that it would keep climbing into Wednesday topping out for the week near that 1280 level. Most of the negative energy appeared to come from the late week Sun-Saturn aspect which I had suggested could depress prices on Thursday and perhaps Friday. While prices did fall during that time, they only corrected down to the support from the bottom of the short term rising channel before reversing intraday on Friday. The absence of any earth-shaking developments here means that the market may have enough juice left to inch a little higher still over the next two weeks. Tuesday’s double whammy of the culmination of the Jupiter-Uranus conjunction and the solar eclipse failed to arrest the rally, but it is worthwhile noting that gold and other commodities did suffer sharp declines. This may have implications down the road as investors move between asset classes in order to take profits. So I’m chastened here, although not defeated. I had suggested that the likelihood of a major trend reversal last week was only 60-40, so it seems the 40% was won the day, assuming the market can rally early next week as I am expecting. What we may have seen was a reduction in positive planetary energy as the Jupiter-Uranus conjunction has begun to weaken. This may therefore limit the upside potential both in terms of price and time (rally duration in days). One reason why I was equivocal about calling the top for last week was the absence of any clearly negative planetary patterns at the time. Prices can fall when Jupiter takes its foot off the gas pedal, but they fall much faster and harder when Saturn applies the brake. We got a small taste of that Saturn energy on Friday but a more reliably negative source of negativity may arrive on or near January 26 when Saturn turns retrograde. This can be a very difficult influence, especially when it is in hard aspect to another planet. This will be the case here as Saturn will square Mercury, the planet of commerce, at the time of its retrogradation. Remember that the market corrected last May when Saturn turned retrograde while in hard aspect with Venus and then Jupiter. In other words, it is quite possible there may be another week or two of this slow motion rally before a correction takes hold.
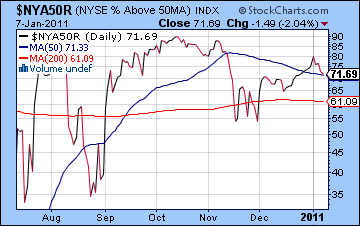
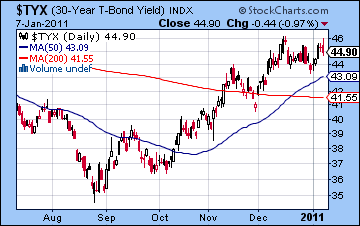
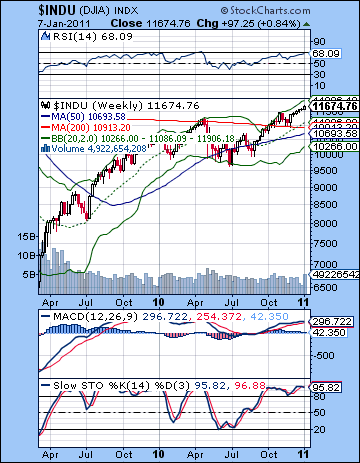 Even with all the sound and fury of the solar eclipse, nothing has changed in technical terms, the S&P remains in a narrow rising channel off the early December low. Friday’s intraday low tested support at the bottom channel at 1265 but then it reversed higher as bulls refused to play. Until that bottom channel breaks down, nothing will change. And we can expect another run to the resistance level, now around 1285. This is roughly in line with the medium term rising wedge pattern we see from the August high. Currently, this resistance level is about 1290. As I noted last week, however, it is still possible to draw this wedge from the June high, which would produce a lower resistance trendline around 1275-1280. Last week’s highs may have partially violated that trendline, so it may be prudent to assume the trendline with a higher resistance level. The bullish momentum is still in place as all moving averages are rising here. Friday’s decline did not quite test the 20 DMA at 1255, so it may not be acting as a significant supporting factor. The rising channel line appears to better reflect changes in price in this recent rally. If resistance is somewhere around 1290, then support next week will be initially in the rising channel at 1270 and then in the rising wedge around 1260. A significant correction can only come about when this 1255-1260 level is broken on the downside. If that happens, there may some buying near the 50 DMA at 1224, as we saw in late November. If that breaks, then the next level of support would be provided by the long term rising trendline off the March 2009 bottom. This is currently around 1125-1130. The technical indicators remain tantalizingly close to breaking down, although in a protracted, government-led rally, this may not account for much. RSI (70) is fallen back off its recent highs and still remains in overbought territory. Not what you would call a screaming buy. MACD is flat here and on the verge of rolling over — again! The weekly Dow chart shows price still comfortably above the 200 DMA suggesting a plausible bull rally is in place. RSI (68) is still slowly rising, but the closer it gets to the 70 line, the less attractive it becomes to medium term buyers. The bottom Bollinger band has risen to 10,266 and may be pointing to a possible target for a large correction, although this is a little lower than the corresponding level on the SPX. The rally breadth continues to narrow as the number of stocks above their 50-moving average fell again from their January 3rd highs of 80 despite higher prices. This is a potentially important negative divergence that is evidence of the unsustainability of the rally. Meanwhile, the elephant in the room is still the rising long bond yield as treasuries drifted higher last week to 4.46%. It’s still below its recent high but more positive economic data may spark growing inflation fears and that will force yields back to 5% fairly quickly. Bernanke will not tolerate this if he can help it, and he will be forced to turn the screws on equities to drum up new buyers of government paper.
 This week offers the chance for the bulls to take prices back up to resistance levels, especially early in the week. On Monday, Mercury forms an aspect with Uranus and Neptune. Since the Moon will also be close at hand, there is a very good chance for an up day here, perhaps on the order of 1% or more. The good times could keep on rolling into Tuesday as Mercury aspects Jupiter, although this seems less reliably bullish. The Moon will still be in Pisces, but it will be moving away rapidly so I wonder how much help it can give. One possibility might be an intraday reversal off the highs on Tuesday that ends flat or even lower. Wednesday looks more negative as Mars aspects Uranus and Neptune. It is still possible we could see stocks hold up under some selling pressure here, so this midweek outcome is perhaps best characterized as uncertain but leaning bearish. Thursday’s Mars-Jupiter aspect looks more bullish, although it is not as positive as the Mercury aspects we may see on Monday. I would also not rule out a down day here, as Mars can be unpredictable. Friday may have a better chance for a decline as the Sun enters Capricorn and Mercury approaches its conjunction with Rahu. Overall, the week looks very mixed and I would not rule out any outcome here. There is a good chance that early week gains will test resistance. The down side is perhaps more uncertain, although it is possible that by Friday we may test support of the Dec-Jan rising channel at 1265-1270. So a bullish outcome would see 1290 by Tuesday intraday, followed by mixed to lower the rest of the week with a possible Friday close around 1280. A more bearish unfolding of the week would see 1280-1290 by Tuesday intraday, but the declines may also be substantial with a test of support 1265 by Friday. I don’t quite think we get there yet, but it could happen. In both scenarios, the lows of the week are more likely to happen on Thursday or Friday.
 Next week (Jan 17-21) is a shortened week due to the MLK holiday on Monday. This one is even harder to call than the previous week due to simultaneously positive and negative aspects. Tuesday will have a bullish Sun-Jupiter aspect alongside a bearish Mars-Rahu aspect. I would lean towards a bullish outcome there. After that, things may take on a more bearish bias, although the aspects are not clearly negative. I would still not classify the week as strongly bearish, however, and any outcome is possible. The following week (Jan 24-28) looks very bearish as Saturn turns retrograde on Wednesday the 26th. The trick here is that Mercury will be square Saturn at the time, and this should correspond with pessimism and even some level of confusion. The risk of a crash-type situation rises here somewhat from the normal near zero probability to perhaps 10%, although this is nowhere near likely. There is, however, a probability for a significant two- or three-day selloff, perhaps amounting to 5%. If the market has thus far stayed within the rising channel and the rising wedge, this would be a possible time when support is violated and the correction begins. February looks mostly lower, although there is still the possibility of some significant rally attempts. I would not rule out further declines going into March with a possible low around March 14th. Admittedly, this seems much too negative an outlook but it is something I am considering. March 28th is another date to remember as Jupiter opposes Saturn on that day. This could be another significant turning point. If the market has been bearish until then, it may mark the start of a sustainable rise. Q1 therefore looks bearish with possible significant downside, but a major rally is likely for Q2 that could last well into July. The second half of the year looks bearish with a probability of 2011 finishing below where it started.
5-day outlook — neutral-bullish SPX 1270-1290
30-day outlook — bearish SPX 1150-1200
90-day outlook — bearish SPX 1100-1200
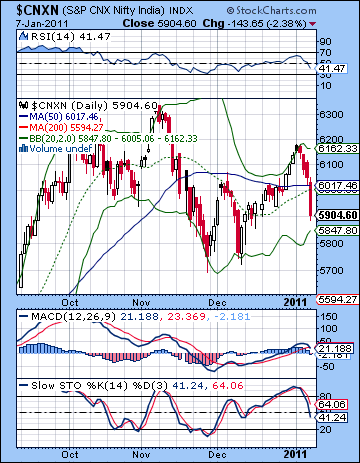 Stocks fell across the board last week as investors anticipated further interest rate hikes would be necessary to combat inflation. Closing below the 20K level, the Sensex lost almost 4% to close at 19,691 while the Nifty finished the week at 5904. This bearish outcome was largely in keeping with expectations as we saw early week gains on Monday’s Venus-Jupiter aspect. I had noted the possibility that gains could extend into Tuesday’s solar eclipse and that indeed was the case, although only on an intraday basis. Tuesday ended modestly lower and the bears took control for the rest of the week. I thought 6000 was a possible downside target here but even that lowly level was cleanly broken by Friday’s selloff. Interestingly, the Friday decline did closely coincide with the Sun-Saturn aspect which I had mentioned as a particularly pessimistic alignment. Certainly, it was a very important week that offered some preliminary support for the notion that the longer term market trends may have turned. The combined effects of Tuesday’s exact Jupiter-Uranus conjunction and the solar eclipse may well have marked a significant peak in the market as prevailing upbeat sentiment was jolted out of its complacency. While this was not the case in many other global markets, the Indian market was more vulnerable to reversals due to its higher valuations. Hence, we take a somewhat more confident view that the market will be not able to recapture its previous high levels (Sensex 20,500) before a larger correction ensues. But it is still early in the post-eclipse investment environment and we will have to watch developments closely over the coming days. It is important to note how the market reacts to both positive and negative influences. Last week, it was the weakening of the positive effects of the Jupiter-Uranus conjunction that played a key role in the pullback. In this sense, prices fell more because the amount positive energy was reduced, rather than the introduction of a new source of negative planetary energy. The solar eclipse is often negative, but it tends to act more like a circuit breaker, where it interrupts prevailing trends. Prices will only begin to fall if it is accompanied by negative planetary influences. We got a short-lived negative influence with Friday’s Sun-Saturn aspect, but we will have to reserve judgement whether this downward trend can continue. What is needed is a more clearly negative planetary energy. I believe that may take the form of the upcoming Saturn retrograde cycle on 26 January. So not only will we see a reduction in positive energy from the separation of Jupiter-Uranus, but we will have an increase of negative energy from the Saturn retrograde. Until that time, the market seems less likely to correct sharply. Instead, we may be more range bound, albeit with a bearish bias.
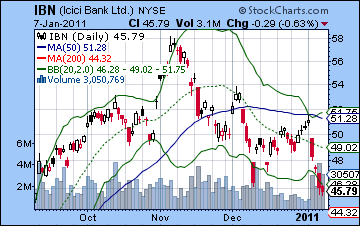
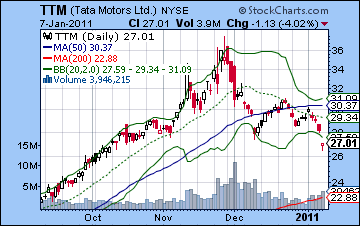
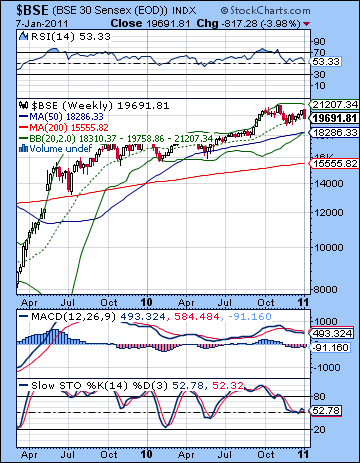 The bulls gave it their best last week but it wasn’t enough. Once the Nifty failed to make 6200 and the 78% Fib level in the early week rally attempt, prices retreated in a hurry and closed below the 50 DMA. This was a crucial technical development that strongly puts the market in the hands of the bears. Friday’s close did not quite equal the bottom Bollinger band (5847) suggesting some more immediate downside was possible. Some observers are calling for support around the previous lows of 5700-5750. This is quite possible in the near term. Resistance is likely near the 50 DMA at 6038 so that future rally attempts may spark selling as prices approach this threshold. The indicators do not paint a happy picture. Daily MACD is now in a bearish crossover and is heading lower. Since it is above the zero line, this is a triple strike against it and strongly suggests lower prices are in the offing. Stochastics (41) have fallen sharply here and may well be engaged in a headlong rush to the oversold 20 line. RSI (41) is now in bearish territory. This indicator will bear close watching to see if it stays above its levels from previous lows thus forming a possible positive divergence. If it falls below 37 — the 10 Dec low — then it will increase the likelihood of breaking the 5700 support level. If it falls all the way back to 30, this probability will be further increased. As bearish as the daily chart appears, the weekly Sensex chart is perhaps less grim. Price has retreated to the 20 WMA, as it did in the November correction. For this reason, it may offer some support going forward. However, a deeper correction as we saw in May 2010 produced a correction back to the 50 WMA and then some. This level is currently near 18,200 which suggest a further 7% decline is possible before turning higher again. This is roughly equivalent to 5600 on the Nifty, near the 200 DMA. Based on my interpretation of the astrological factors, this should be seen as a minimum sized correction for Q1, and there is a very good chance we will go lower than that. The charts of individual stocks confirmed this rough patch. As noted in previous newsletters, ICICI Bank failed to break above the H&S neckline and is in the process of fulfilling its downside target of $42. We will see if it manages to arrest its decline near the 200 DMA at $44. Note how Monday’s gain culminated exactly on the 50 DMA and then reversed lower. This is a very weak chart and perhaps reflects the difficult banking environment that the imminent rate hikes will create. It was much the same story for Tata Motors (TTM) as price reversed after Monday’s touch of the 50 DMA. This may find support near the 200 DMA at $23. This is what happened in the May 2010 correction.
 This week may see another rally attempt early in the week but the rest of the week looks more mixed. The Moon-Mercury-Uranus aspect on Monday will likely boost sentiment for at least one day, possibly two. Tuesday’s Mercury-Jupiter aspect also has some bullish potential so it’s quite possible we could see two up days that may push the Nifty back towards the 50 DMA at 6038. In any event, we should be net positive. Wednesday has a better chance of a decline as the Moon opposes Saturn. The late week period is harder to call due to the Mars aspect with Uranus and Jupiter. Mars is a malefic planet but it can sometimes be rehabilitated by more charming dance partners such as Jupiter. It’s possible we could see a split over these two days with one up and one down. Overall, there is a reasonable chance for a net gain on the week, although a lot will depend on what effect the Mars-Jupiter aspect will have later in the week. A bullish scenario might have the Nifty rallying back to 6030 by Tuesday (or even above!) and then falling Wednesday back to 6000 with a further rise to 6050 by Friday. A more bearish outcome might have the Nifty also rising towards 6030 by Tuesday but with deeper declines Wednesday below 6000, followed by weaker late week rallies that have it closing somewhere around 5950-6000. So there is a reasonable chance for some gains this week, although they may not last long. Monday’s action will be an important barometer of any post-eclipse optimism. Last Monday’s favourable Venus-Jupiter aspect only produced a modest gain of 0.3%. A similar sort of modest gain on the Mercury-Jupiter aspect would be a sign of greater weakness in the market and further evidence that the fundamental trend has shifted. I expect we may see a gain more significant than that, however.
 Next week (Jan 17-21) looks more mixed although strangely enough, there is a good chance for some early week gains here, too. The Sun forms a nice aspect with Uranus and Jupiter on Monday and Tuesday, so we should expect some upside. The rest of the week looks more negative, however, and we could see a lower week overall. The following week (Jan 24-28) features the start of the retrograde cycle of Saturn on Wednesday the 26th. This occurs while in bad aspect to Mercury and will likely mark another significant leg down. This is a similar situation as occurred in May 2010 when Saturn ended its retrograde cycle while in bad aspect to Venus and then Jupiter. The correction of January 2010 also came when Mercury began its retrograde cycle when in a bad aspect to Saturn. So there is some fairly solid evidence to back up the notion of more downside at this time. We could get an interim low on Friday 4 February or perhaps on the following Monday, the 7th when the Sun conjoins Mars while in aspect with Saturn. Those definitely look like very negative days that could produce a shock-type of low. Some rally is likely through mid-February and into late February but March looks bearish again. A lower low is possible in late March as Jupiter opposes Saturn and even April looks mixed at best. So Q1 is shaping up to be quite bearish with a bottoming process in March and into April. A sizable recovery rally is likely for Q2 and this may carry over into July. Generally, however, the second half of 2011 looks bearish with another correction likely for August and September.
5-day outlook — bullish NIFTY 6000-6050
30-day outlook — bearish NIFTY 5500-5700
90-day outlook — bearish NIFTY 5000-5500
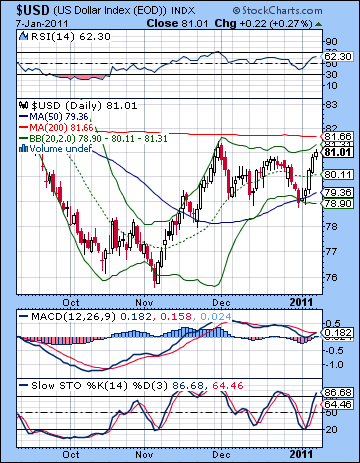 Amidst the rush of favorable economic data, investors barged back into the Dollar as the USDX closed just above 81. The Eurodollar sank a full four cents to close just above 1.29 while the Rupee weakened to just over 45. This bullish outcome was expected, although we did not get any Dollar weakness on Monday as I thought we would. I had thought the Venus-Jupiter aspect would be enough to send investors toward riskier assets and out of the Dollar. While stocks rose across the board, the Dollar did too, perhaps suggesting a new dynamic in the offing in the wake of Tuesday’s solar eclipse. Hitherto, the Dollar has generally moved inverse to stocks. Not so last week, as improving economic numbers are encouraging investors to buy the Dollar in anticipation of a recovery. While the 3% gain was significant, the Dollar remains trapped in between the 50 and 200 DMA and is now pushing towards the resistance level of 81.66. This is also close to the upper Bollinger band and is the approximate location of where the previous Dollar rally peaked and reversed lower in late November. It will take a definitive close above this resistance level to turn fair weather bulls into true believers. The technical indicators present a mixed picture, albeit one that favors the bulls. As expected, the 50 DMA proved to be solid support as the Dollar reversed higher after an initial test of it Monday. The Stochastics (88) is already up in the overbought levels but both RSI and MACD are more positive. RSI (62) has more room to run higher before reaching the overbought level. And it will have to in order to erase a possible negative divergence with that previous high. MACD is just beginning to show a bullish crossover here and is still above the zero line. However, it shows a clear negative divergence that is unlikely to be erased barring a sharp rise. The indicators on the weekly chart look even more bullish as both RSI and MACD have considerable more room to run higher before reaching overbought territory.
This week looks less bullish for the Dollar, and we may well see it retrace downwards. Monday’s Mercury-Uranus aspect looks well positioned in the Euro chart so we should expect some move higher there, perhaps to 1.30 or above. The midweek Mars-Uranus aspect could see the Dollar gain once again but the late week Mars-Jupiter aspect may boost risk appetite once again and send investors fleeing from the Dollar. While I think the Dollar is going to rise further over the coming weeks, this week does not look especially promising for it and we could see it retrace back to the 20 DMA around 80. Next week may see the Dollar finding its footing again after some early week weakness, although I would be surprised if it had enough momentum to carry it above the 200 DMA. The last week of January looks more promising on the Saturn retrograde so it’s more likely we could see that breakout higher then. This is likely to correlate with an increase of fear and pessimism in the markets so the Dollar will be the beneficiary of the flight to safety play. February should see further upside and I would not rule out a run up to 85. While I have been uncertain on the fate of the Dollar here in Q1, it seems more likely that it will stay strong through March and conceivably even into April. I’m somewhat less confident in this prediction than I am about the equity correction across the same time frame, but there is at least some astrological evidence to support it as being more likely than not.
5-day outlook — bearish-neutral
30-day outlook — bullish
90-day outlook — bullish
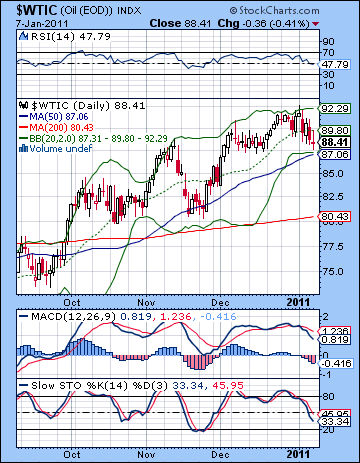 With global demand prospects weakening, crude lost more than 3% to close below $89. This bearish outcome was in keeping with expectations as the solar eclipse brought about a change in sentiment in commodities. As expected, Monday’s Venus-Jupiter aspect pushed prices above $92 where it ran into technical resistance and formed a bearish shooting star pattern. I had wondered if we might see a reversal Tuesday or Wednesday, but the bears came out in force Tuesday as the eclipse combined with the Mercury-Mars aspect and took prices below $90. The rest of the week was mostly bearish as Friday’s decline coincided with the Sun-Saturn aspect. While astrological factors may have predicted this pullback, the technical factors very much pointed to a similar outcome as crude failed to break above its upper Bollinger band at $92. Friday’s intraday low was very near the bottom band at $87 and thus the pullback had a kind of inevitable quality to it. As added support, Friday’s low also coincided with the 50 DMA so it may take more than one testing of that level for crude to move substantially lower as I am expecting. Even if the 50 DMA does not hold, price may find support from the rising channel now at $86. If that should also fall, then the 200 DMA near $80 would likely bring in new buyers. The technical indicators look difficult here as MACD is in a deepening bearish crossover but are still well above the zero line, suggesting there is much more room to go on the downside. RSI (48) has fallen from the overbought line and is now in bearish territory. We will have to pay close attention to the RSI level as a move down below 40 would form a negative divergence with respect to the previous low.
This week looks somewhat better for crude as the Mercury-Uranus and Mercury-Jupiter aspects may push prices back towards $90 in the early part of the week. But two straight up days in a row may be pushing it here, so I would not be surprised to see it reverse lower either Tuesday afternoon or Wednesday at the latest. Wednesday could see a significant decline. The latter part of the week looks bearish to neutral as the Mars-Uranus aspect Thursday could well be negative but Friday’s Mars-Jupiter may see speculators return to commodities. The week overall is harder to call although I would lean towards a positive outcome here, if only out of prudence. Probably crude will finish somewhere between $87 and $90. Next week may begin well enough on Tuesday (since Monday will be closed for holiday in the US), but look for further erosion as the week progresses. The last week of January will feature the beginning of the Saturn retrograde cycle and could take prices much lower. I would not rule out a test of the $80 before the end of the month, although at this time I would not say such an outcome is probable either. The correction will likely continue through to mid-February. A rally seems likely to start around Feb 11th or 14th as the Sun and Mars aspect the ascendant in the Futures chart. This rally should last into March although I would not expect higher highs. Prices look mixed to bearish through much April and I would not rule out lower lows at that time.
5-day outlook — neutral-bullish
30-day outlook — bearish
90-day outlook — bearish
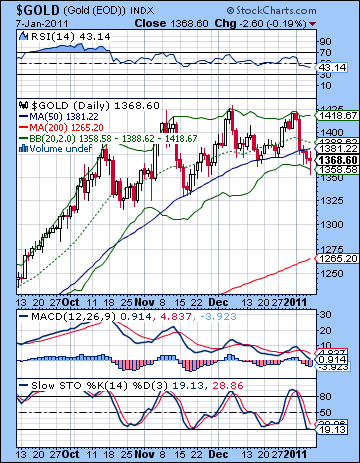 As the US economy strengthened, investors jumped off the gold bandwagon in droves as bullion fell below $1370. This bearish outcome was very much in keeping with expectations, although the early week upside never really appeared as Monday saw only intraday strength before closing lower. Tuesday’s solar eclipse was the knife in the back as gold plunged 3%. I had expected we might get a down move although I thought it may have been closer to the late week Sun-Saturn aspect. In any event, the eclipse week did appear to confirm my suspicions that the long awaited correction in gold is now underway. I had previously wondered if we might have to wait until the start of the Saturn retrograde cycle on January 26 for the correction to get rolling but there is some evidence here that the solar eclipse was the necessary trigger. We shall see. The technical picture darkened considerably for gold as price has broken now below the 50 DMA. Previous corrections during the course of this post-QE2 rally have all bounced back off the 50 DMA, but gold is looking very vulnerable here. While Friday’s intraday comeback from $1350 was impressive, it still has to climb back to the 50 DMA at $1381. This is now a key level of resistance. Bulls will be pushing this thing with all their might to get gold back over this line in the sand while bears will be shorting it like there’s no tomorrow. It’s still quite close to this level now, so we cannot rule out rally attempts to and even above this line. I doubt if it will be a hard and fast barrier to any further rally attempts, but we will have to see a couple of solid closes above $1380 before the selling pressure on gold subsides. And bulls might be able to convince themselves that as long as prices stay above previous lows of $1320, then the uptrend remains in place. With RSI (43) still well above the 30 line, there is plenty of normal downside left in a corrective move.
This week could start off fairly well as Mercury is in aspect with Uranus and then Jupiter. So we could see Monday close higher, but Tuesday is harder to call. I would lean towards a positive close but it’s really quite uncertain here. Wednesday seems more solidly bearish as Mars is in aspect with Uranus. The end of the week could be more mixed but with the downtrend seemingly in effect, I’m less optimistic about a positive finish to the week. While this week looks somewhat more bullish than last week, I’m not convinced there will be enough upside to produce a winning week. The following week looks somewhat more bearish and the final week of January and the start of the Saturn retrograde cycle looks even more negative. The correction could last into the second week of February and the Sun-Mars conjunction and we may well test the 200 DMA at $1265 by that point. February will likely see some rebound as the Sun enters Aquarius and leaves the affliction of Mars behind. Then another move lower is likely in March which may carry through to April. There is a reasonable chance that this will be a lower low than we see in February. May and June look mostly bullish with slowing upward momentum through July and into August. September looks like another sharp correction on the Saturn-Ketu aspect.
5-day outlook — bearish-neutral
30-day outlook — bearish
90-day outlook — bearish

