Summary for week of February 14 – 18
Summary for week of February 14 – 18
- Declines possible Monday but midweek strength likely on Sun-Neptune conjunction; weakness returns by Friday
- Dollar likely to continue to strengthen but midweek losses likely
- Crude to weaken further, although midweek bounce is likely
- Gold likely to strengthen into midweek
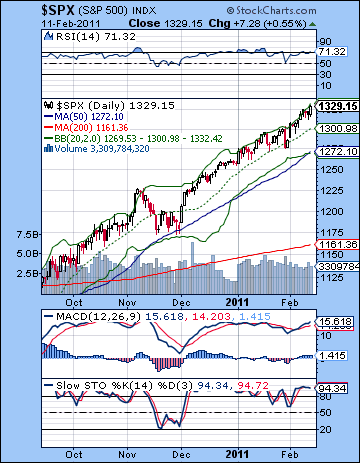 Stocks continued their relentless upward climb last week on significant M&A activity as well as a peaceful resolution to the Egyptian situation. The Dow finished more than 1% higher at 12,273 while the S&P500 ended the week at 1329. While I did not expect much downside action to take place last week, I thought there was a reasonable chance for some kind of decline in the early week on the Sun-Mars conjunction. But the market shrugged off any such alignment and proceeded to move higher for the balance of the week. While the absence of any decline on Monday was a little disappointing, I did expect some upside after that around the Venus-Pluto conjunction. I thought there was a good chance we could see 1320 and indeed we did get there, although there was no evidence for any late week selling. While the market has remained impervious to any substantial declines since the Saturn retrograde cycle on 26 January, I have not significantly changed my forecast for a significant correction in the near term. True, I would have thought we might have seen a little more downside with a testing of a rising wedge support. But the main astrological components of a decline still lie in waiting.
Saturn is gradually approaching its opposition aspect with Jupiter on March 29. This is a key feature of the forthcoming correction and we are still over a month away from its exact angle when it is at its strongest. Also, the unpredictable square aspect between Rahu (North Lunar Node) and Uranus scheduled for March 5 is another influence that is likely to undermine the dull complacency exhibited by the current rally. This latter combination of Rahu and Uranus is somewhat less reliable in its timing and its market effects need not correlate closely with the moment of its closest aspect. Nonetheless, both pairs of aspects suggest a changing investment climate where risk is subject to re-evaluation. With Bernanke’s QE2 program not slated for expiry until June, many investors are expecting the market to continue to climb, presumably to 1400 on the S&P. Certainly, the infusion of the Fed’s liquidity has had a levitating effect on stocks since it was first hinted at in September. It would seem futile to "fight the Fed" on this one since prices may continue to defy gravity as long as the Fed keeps buying treasuries. Honestly, I don’t know what will be the proximate cause of this upcoming correction. It could be some bad economic data, or it may be some unforeseen developments abroad. Maybe it will be a case of investors choosing to take profits ahead of the end of QE2 and beating the rush to the exits. What I do know is that the planets do not favour an orderly rally lasting into June. The upcoming correction looks like it will be a significant interruption of the rally and the mindset that it is predicated upon.
 The technical picture is largely unchanged as prices are firmly ensconced within the rising wedge that dates back to summer 2010. This wedge has proved to be almost as durable as the ones we saw in 2009 and early 2010 after the March lows. The thing about these Bernanke-inspired wedges is that they look bullet-proof until they aren’t. And they they dissolve quite quickly and suddenly since the bottom support line is so close and hence there isn’t much room left to maneuver while keeping the pattern intact. Sometimes there is a brief hiccup as there was in January 2010, as they re-form and then continue higher. Friday actually touched the upper resistance line at 1330 on the wedge, so that increases the likelihood that we may undergo a slight correction this week. While prices have been creeping higher through January and now February, it’s worthwhile noting that the S&P has touched the resistance line only in February. It’s previous touch was in early November at 1227, and before that, in early August at 1129. Resistance is rising at about 5-6 points a week and will sit at 1350 by the end of February. Support is now at 1300, having risen from a previous touch of the line at 1280 on January 28. This is not to say that a break below 1300 will initiate a sudden waterfall pattern. Certainly, that is possible but there will likely be support from the previous low of 1280 and a subsequent rally attempt before any wild ride downward occurs.
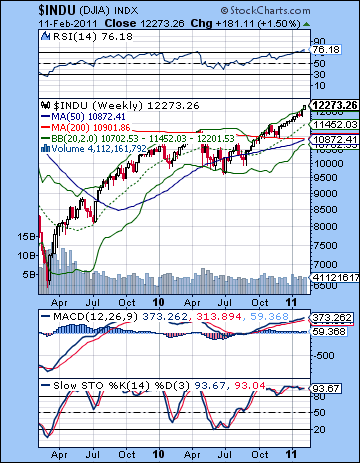
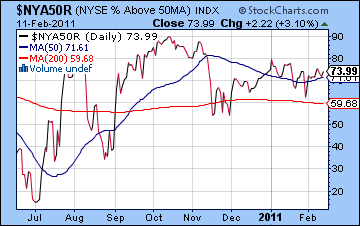
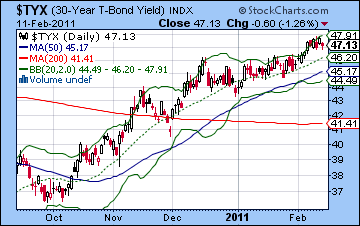
The technical indicators remain conspicuously overbought as RSI (71) has again drifted above the 70 line. Friday’s close was within a hair’s breathe of the top Bollinger band and offers further evidence that the current rally is getting long in the tooth. The 50 DMA at 1272 may be another key level of support and roughly lines up with the previous low of 1280. This is also fairly close to the bottom Bollinger band and therefore should be seen as a possible support level in the first phase of any correction. Bulls will likely try to step in to buy the dips first at 1300 and then at 1270-1280 in order to preserve the upward momentum. Certainly, the weekly Dow chart shows a massive momentum move as the RSI stands at a frothy 76. While weekly MACD remains in a bullish crossover, the negative divergence with respect to previous highs should give most bulls some reason for caution. Despite the higher prices on the main indexes, however, the broader markets continue to show unmistakable signs of weakness as the percentage of stocks above their 50 DMA ($NYA50R) is still lower than it was in early January. We can see how this may be mimicking the pattern from October-November as we got a high in October and then a lower high in early November which corresponded with the start of a correction. Meanwhile, treasury yields are in a holding pattern as the 30-year stayed in the 4.7-4.8% range last week. If yields remain above their breakout level of 4.6%, then it suggests still higher yields in the near future as it would signal that the long term bull run in treasuries may well be over. However, if yields can fall below 4.6% for a few days running, then it may indicate that treasuries aren’t quite dead yet. Higher yields are anathema to a sustained economic recovery in the US since the housing sector will likely require an extended period of cheap mortgages to bring that sector back to life.
 We are coming ever closer to the moment of no return on this rally, although I doubt we are there yet. Nonetheless, this week could have a dress rehearsal or preliminary feel about it as we will have two separate Saturn aspects. On the face of it, these should be bearish although recent experience with other Saturn aspects would suggest that it is not quite living up to its bearish billing. At least, not yet. And in the middle of it, is another alignment with Uranus-Neptune by the Sun which is bound to lift prices, possibly in the middle of the week. Monday features a Mercury-Saturn trine aspect that symbolizes focused efforts and deep thinking. While the 120 degree trine aspect is sometimes positive, I tend to think this one will be accompanied by some kind of disappointment, possibly involving some bad news involving transportation or communication. Another potential source of bearishness is that Mars enters the sign of Aquarius on Tuesday. This may increase pessimism and uncertainty around technology stocks. But the Sun offers a possible offsetting bullish influence by Wednesday as it conjoins Neptune. This is likely to reflect some optimism on the role of government in the economy. It is possible that the good mood could continue into Thursday’s Full Moon. The week will conclude with a square aspect between Venus and Saturn. This increases the likelihood of a decline on Friday, especially since Mars approaches Neptune and the Sun approaches its aspect with weird Ketu. I would not rule out further upside here, although if it happens it will likely occur midweek around the Sun-Neptune conjunction. A bullish scenario would see a modest retreat Monday back to 1320-1325 and then a push higher to 1340 by Thursday. Friday would see a decline to 1330, or roughly unchanged on the week. A more bearish unfolding would see a steeper fall Monday and Tuesday back to 1310-1315 and then a brief rally to below current levels (say, 1320-1325) and then lower again Friday to 1315-1320. While I would lean slightly to the bearish version, I do not expect any major testing of support here. I do think the market is very close to reversing, however, so one can’t be too cautious.
 Next week (Feb 21-25) offers a good possibility of larger declines as Mars conjoins Neptune on Monday while Mercury is in aspect with Ketu. Both are bearish influences and their simultaneity definitely increases the probability of a decline as well as increases its probable magnitude. Mars will follow closely on the heels of Mercury and line up with Ketu by Wednesday so there is a cluster of negativity that should produce two or three straight down days. I am expecting something fairly sizable here, perhaps 3-5% and something that tests the bottom of the rising wedge at very least. If we do successfully test 1300, then the late week Sun-Jupiter aspect will likely represent a rebound, albeit to a lower low. It is also possible that prices could fall below this first line of support at 1300 and go down to 1285 or so. The following week (Feb 28-Mar 4) is harder to read, although the Venus-Uranus aspect early in the week looks like bullish follow through from the end of the previous week. The optimism may fade by the end of the week, however. Early March will feature the aspect between Rahu and Uranus that could generate some surprising turns of events. This is a very unstable pairing that may be activated by Mercury’s transit on March 8. Generally, March looks bearish as Jupiter opposes Saturn on March 29. The correction may continue into April although once the opposition is out of the way, I wonder just how much downside will be left to go. The very bearish Mercury-Mars-Saturn alignment on April 18 could be significant and may end up marking an important low. I do expect a consolidation to take place in April which ought to produce a rally going into May, June and July. This may be a formidable rally, although it is unclear if the market can reach new highs. At this point, I think it will be lower highs, but I cannot rule out a double top or some other pattern. Generally, the outlook for the second half of 2011 looks fairly bearish with September and December looking like the most bearish months.
5-day outlook — bearish-neutral SPX 1315-1330
30-day outlook — bearish SPX 1170-1220
90-day outlook — bearish SPX 1200-1300
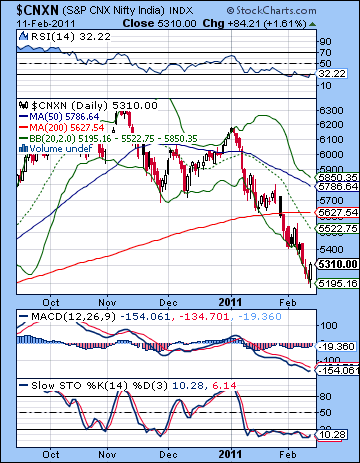 Stocks fell yet again last week as investors continued to worry about growth prospects in an increasingly hostile interest rate environment. After trading as low as 5200 on Thursday, the Nifty ended the week more than 1% lower at 5310 while the Sensex finished at 17,728. While I have been very bearish, I thought there was a reasonable chance for some upside last week on the Venus-Pluto conjunction. Alas, the only solid up day occurred on Friday, as Venus was fully one degree past Pluto. In fact, I thought we could see some upside Friday given the proximity of the Sun’s entry into Aquarius. Also, I noted the possibility of more downside on the early week Sun-Mars conjunction, although I thought it was more likely to occur on Monday. As it happened, Tuesday was the largest decline of the week after Monday’s inconclusive session. The absence of any sustained rally attempt here is worrisome since it underlines the extent to which pessimistic Saturn is controlling sentiment. As I have noted in previous newsletters, there is a good chance that Saturn will rule the roost here until the culmination of its opposition aspect with Jupiter on 29 March, or perhaps even beyond that date. Throw in the volatile square aspect between Rahu and Uranus in early March, and you have all the makings of a very difficult period that shows no signs of ending anytime soon.
Saturn is exacting a heavy toll on Indian markets these days because the horoscope of the BSE is extremely afflicted. India has fared worse than other global markets because this approaching Saturn-Jupiter aspect falls in a very sensitive place in the chart of the BSE. The BSE was founded on 9 July 1875 as the Sun was situated at 24 degrees of the sign of Gemini. Currently at 23 degrees of Virgo, Saturn is currently moving backward in the sign of Virgo and therefore in a difficult 270 degree aspect with the Sun of the BSE. Saturn-Sun combinations are usually quite difficult at the best of times, and this one is made worse because of the precision of the angle involved. Saturn will continue its transit of Virgo for most of 2011 so that is one very important reason why Indian stocks are likely to be out of favour for some time to come. The chances for a significant rebound at some point in 2011 is therefore fairly unlikely. Rallies will tend to be short-lived and will generally be exit opportunities for investors looking to cash out of the market. While some mid-year rebound is likely, it seems increasingly unlikely that the 2010 highs can be recaptured. With inflation fears now stalking most emerging markets and the Fed’s QE2 stimulus program scheduled to end in June, Indian equities are very vulnerable to further weakness as liquidity dries up and risky assets lose their allure.
 The technical picture remains precarious although Friday’s rise may have provided some basis for a future rally attempt. Last week’s low was just below 5200 on the Nifty and this corresponded with the July 2010 low. The Nifty is still well above the May low of 4800, however, and this gives bulls some evidence to undertake another eventual rally. Using Fibonacci retracement levels, we can see that recapturing the 50% level would bring the Nifty back to 5550-5600. While the selling has been fierce, price is has still not quite touched the 61% retracement level of 5100. The fact that last week’s low is caught up in between suggests it may have to go lower eventually before it can turn higher once again. But the market seems very oversold here as RSI (32) is bouncing off a possible double bottom and could conceivably be probing higher. MACD is still in a bearish crossover and is making lows not seen since 2008. The Nifty is now on the wrong side of the 200 DMA as that dividing line between bull and bear markets looms large. We got a bearish crossing of the 20 and 200 DMA early last week and if the correction continues as I think it will, we will get an even more bearish crossing of the 50 and 200 DMA.
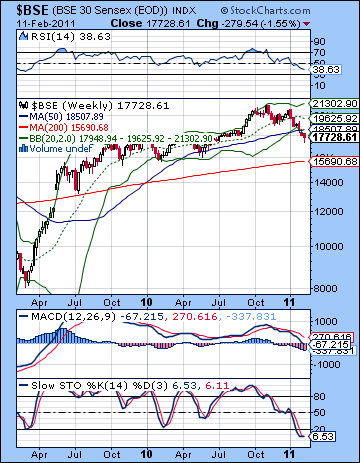
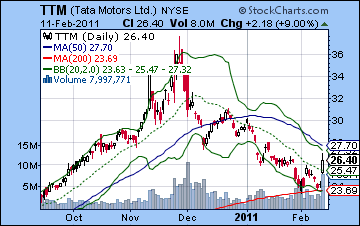
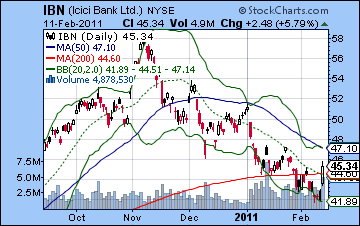
The weekly BSE chart reveals just how gloomy the current situation is. Price has fallen below the 50 WMA for the first time since 2008 as the Sensex is now riding the bottom Bollinger band. What ought to be more worrying for bulls is that the technical indicators still have some room to go on the downside before they present a convincing case for buying. RSI (38) is falling fast but still could easily go lower before any kind of sustained rebound rally takes place. MACD is in a bearish crossover but has only just crossed the zero line as a result of last week’s decline. In a major correction, it is not uncommon for MACD to fall well below the zero line for a period of weeks and months. The weekly chart suggests a possible support level at the 200 WMA (15,690) which acted as support in July 2009. This roughly matches previous lows in February and May 2010 near the 16K level. Individual stocks showed signs of life as Friday’s buying spree was well received by US investors. Tata Motors (TTM) surged 9% in the Friday session in New York as it successfully tested the 200 DMA for the second time in two weeks. That is a positive sign that the market may be finding a bottom. Of course, it still has to break above the 50 DMA for the rally to be significant as weak bulls may take the opportunity to sell as price approaches this threshold. ICICI Bank (IBN) shows a similar pattern as a possible bottom may have been reached as Friday’s rally saw prices close above the 200 DMA. It’s not far off the 50 DMA now, so we will have to see if it can move above this level.
 This week offers a double dose of Saturn, although there will be some offsetting influences that may reduce the potential downside. Monday begins with a Mercury-Saturn aspect. This is normally a bearish aspect and given Saturn’s recent strength, we should allow for the possibility for another down day to begin the week. As the week progresses, there is a good chance for some kind of recovery as the Sun approaches its conjunction with Neptune on Wednesday. Tuesday could go either way, although with Mars entering the sign of Aquarius (technology), there may be too much pessimism for a significant rally to occur at that time. So it seems likely that we will see at least one down day on Monday or Tuesday, possibly two. Wednesday is therefore a better bet for a positive outcome. The late week period features a difficult Venus-Saturn aspect that looks bearish, especially since it will hit a sensitive point in the BSE horoscope. Friday looks more bearish than Thursday in this respect. So while I would maintain a medium term bearish expectation, I’m a little less sure that prices will fall further this week. I still think it’s probable, but the planets present a more equivocal picture than I would like. The technicals also suggest that a moderation of sentiment may not be far off. So a bullish scenario might be only a mild decline Monday to 5250 followed with a rally into Thursday to 5400 and then back down to 5300 by Friday. A more bearish scenario would see a 5200 or lower by Tuesday followed by a brief rise to 5300-5350 again midweek. The late week would see more selling and a take out of the 5200 level. I would favour the bearish scenario here. I think we will get another test of 5200, and I would not rule out a test of that 61% Fib retracement level at 5100.
 Next week (Feb 21-25) looks fairly bearish as Mercury and Mars come under the disruptive influence of Ketu early in the week. This is likely to produce new lows, even in the unlikely event that the market manages to rally in 14-18 Feb. 5000 is possible on the Nifty here. Some up days are more likely towards the end of the week as the Sun is in aspect with Jupiter. The following week (Feb 28-Mar 4) may begin on a positive note as Venus is in aspect with Uranus, but the rest of the week looks more mixed. The first half of March looks fairly mixed with gains more likely. If we are going to see a significant technical bounce, this would be the most likely time. I’m not convinced it will be get very far, however. The picture darkens for the second half of March, however, as Jupiter opposes Saturn on 29 March. How low could it fall? I’m uncertain, but 4800 is definitely in play here, which is the May 2010 low. I would not be surprised to see the Nifty fall further than that, however. We could see a consolidation process occur in April with the Mercury-Mars-Saturn alignment of 18 April perhaps marking a significant low. Mercury will end its retrograde cycle in exact aspect with Saturn on 22 April so that adds to the potential bearishness at this time. Even if the market bottoms out before this date, I would be reluctant about taking long positions ahead of this mid-April period. Some kind of recovery rally is likely to ensure after this, although it may well be weaker than many expect. Nonetheless, we should see a gradual rise going into June and July before the decline resumes in August and September. New lows are likely in Q3 and Q4.
5-day outlook — bearish-neutral NIFTY 5200-5300
30-day outlook — bearish NIFTY 5000-5200
90-day outlook — bearish NIFTY 4800-5200
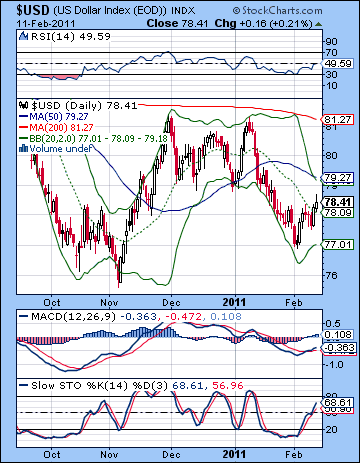 The Dollar resumed its advance last week as it gained ground on improved economic data closing near 78.4. The Eurodollar finished the week slightly lower at 1.355, while the Rupee ended Friday at 45.6. This bullish outcome was largely expected as the Venus-Pluto produced some weakness going into midweek which was offset by gains later on. Admittedly, the upside was fairly modest here as Monday’s Sun-Mars conjunction did not correspond with much upside so we had to rely on the late week bearishness of the Sun’s approach to Aquarius to send investors into the Dollar. So far, so good as the Dollar appears to be building onto recent gains and seems poised to go higher. MACD is in a bullish crossover here and still well under the zero line. This suggests it has a lot more upside. RSI (49) has climbed all the way back to the break even line. It recent double bottom off the 30 line seems to be as good as gold here and helps build the case that the Dollar has more upside. Stochastics (68) have risen off the 20 line and still have a ways to go before being overbought. This should help cautious bulls take prices higher. In terms of resistance, there is an interesting overlay of the top Bollinger band at 79.2 and the 50 DMA at 79.2. While both the 20 and 50 DMA are now falling, one wonders if this lower level will make it an easier resistance level to surmount in the event that the Dollar rally takes flight. Certainly, we are just one good week away from testing this resistance level. After that, the 200 DMA at 81 still looms large as resistance and it may take more than one try to break above that level.
This week looks modestly positive for the Dollar as Monday’s Mercury-Saturn aspect could send investors in search of safety. We could see 1.35 broken on the downside early in the week, which would translate into 79 USDX. But the midweek Sun-Neptune conjunction is likely to increase risk appetite and send the Euro higher so some or even all those early gains may be erased. This would set up Friday’s Venus-Saturn aspect as the difference maker on the week which would boost the Dollar above current levels. Overall, I don’t expect a huge upside here as the Dollar appears to be slowly building for a stronger move higher in March and April. Next week is more positive for the Dollar with a good chance to test resistance of the 50 DMA (79.2). Generally, March and April look bullish for the Dollar as transiting Jupiter will approach its exact aspect to the ascendant in the USDX horoscope. As it happens, this will closely coincide with an inverse influence on the Euro chart involving the nasty Rahu-Uranus square. Given the largely zero-sum relationship of the Dollar with the Euro, this is a nice confirmatory signal that the Dollar will continue to strengthen well past the 81 level and may take a run at 88 over the next couple of months.
Dollar
5-day outlook — neutral-bulllish
30-day outlook — bullish
90-day outlook — bullish
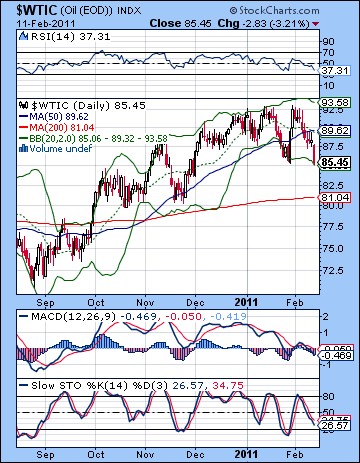 As the crisis in Egypt subsided, crude came back down to earth closing below $86. While I had been cautiously bullish, I did at least manage to highlight Friday as a probable down day. Friday’s 3% decline on Mubarak’s resignation coincided with a close aspect in the Futures horoscope. The biggest misfire was the absence of any significant upside on the midweek Venus-Pluto aspect. As it was, crude was mostly flat from Tuesday to Thursday, although it did trade higher intraday. Monday was also lower as the Sun-Mars conjunction did appear to correlate with bearish sentiment as expected. Crude has therefore returned to its level at the start of the unrest in Egypt at the bottom Bollinger band. This is still a plausibly bullish situation in the bottom end of the recent trading range, although the technical indicators still appear to be pointing to lower levels. RSI (37) have slumped back to late January levels and still have some way to go before becoming oversold. Stochastics (26) have similarly fallen significantly but have more room to fall before becoming oversold. MACD is again in a bearish crossover and has fallen below the zero line. Since price is now below the 50 DMA, the next level of support would likely be the 200 DMA near $81. This would match the November low and would still keep the bull rally intact since it could create the appearance of higher lows. In the unlikely event of another rally, the next resistance level would likely be a new high, perhaps around $94-95.
This week looks like more weakness for crude as Monday’s Mercury-Saturn aspect is unlikely to prompt more buying. In addition, Mars is now transiting a sensitive place in the Futures chart so that adds to the likelihood that last week’s declines are likely to be extended. This early week bearishness may be significant, so I would not be surprised to see another 2-3% on the downside. Some midweek strength is likely on the Sun-Neptune conjunction so we could see a return to the current levels of $84-86 at that time. The late week period looks less promising, however, as the Venus-Saturn aspect could see investors flees risky assets like crude. Overall, there is a reasonable chance for more downside. Next week (Feb 21-25) is also likely to be bearish as both Mercury and Mars come under the influence of Ketu. These are difficult and potentially significant aspects which could correspond to some big drops. In fact, there is a chance that we could see $80 tested at that time. We should see some recovery into early March that sees crude trade near $85 at least. Then price will weaken again around the Jupiter-Saturn opposition on March 29. This seems likely to correspond with another major move lower, at least down to $80 and probably lower. Crude looks likely to begin a rebound in April which will continue into June and July. Another leg down looks likely to begin in August.
5-day outlook — bearish
30-day outlook — bearish
90-day outlook — bearish-neutral
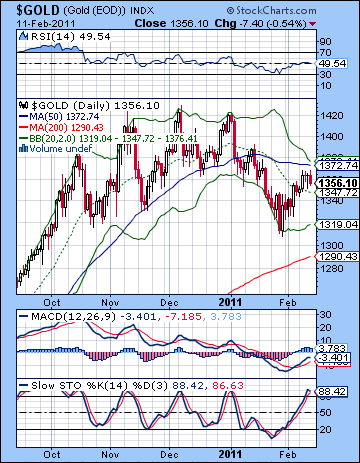 With the peaceful resolution of the Egyptian unrest, gold only managed a modest gain last week closing at $1356 on the continuous contract. This bullish result was in keeping with expectations, although I thought we might have more midweek upside on the Venus-Pluto conjunction. Tuesday was in fact higher, but the gains mostly petered out after that gold only traded towards $1370 intraday before succumbing to Friday’s selloff. I had expected gold to mount some kind of rebound rally in mid-February but thus far the results have been modest, if not underwhelming. There is still a good chance it will reach the 50 DMA at $1372 and maybe a little more. The upper Bollinger band at $1376 is close-by so that may add to the selling pressure if gold manages to climb that high. Stochastics (88) are now overbought so the easy part of the up move is over and done with. MACD shows a bullish crossover and is still well below the zero line. RSI (49) made some tentative steps into bullish territory last week but it remains to be seen if it can add to its recent gains. If resistance sits around $1370 or perhaps $1390 and the previous high, the key support level appears to be $1330. This is the bottom of the rising channel that dates back to early 2010. The late January low of $1310 touched this bottom channel support and it was the fifth touch of the line. A break below this rising trendline could be quite significant and could mark a major breakdown in the price of gold. If $1330 is broken, we may get down to $1260 quite soon. If we see a more thoroughgoing correction take hold, then $1000-1050 could be a possible downside target that could bring in new buyers.
This week looks fairly bullish for gold, although I am uncertain about how the week will begin. Monday’s Mercury-Saturn aspect will be exact before the start of trading so it’s possible it may not weaken sentiment that much. This would increase the possibility for the bullish Sun-Neptune conjunction to build for an additional day as we head into midweek. So I would lean towards a modest loss on Monday but it seems likely to be erased by Wednesday at the latest. So there is a good chance we will see $1370 by midweek and maybe higher. The late week period features a Venus-Saturn aspect that looks fairly bearish so we should anticipate some profit taking, especially if the preceding run-up has played out as expected. Next week (Feb 21-25) could be very interesting indeed as both Mercury and Mars are in aspect with Ketu. This is an extremely bearish alignment of planets that could send prices sharply lower. I would not be surprised to see a test of the rising trendline of $1330 at this time. We could see a brief bounce in early March that produces an even lower high before gold makes a lower low in late March and early April. I would not rule out a longer corrective phase that lasts into May here given the affliction in the GLD ETF chart. Gold seems very likely to trade at $1250 again fairly soon, but there is a real chance it could trade much lower than that by May. I would definitely not rule out $1000 here.
5-day outlook — bullish
30-day outlook — bearish
90-day outlook — bearish

