Summary for week of February 21 – 25
Summary for week of February 21 – 25
- Weakness likely going into midweek with large declines possible; some recovery by Friday
- Dollar may rise early in the week but offsetting losses possible later
- Crude prone to selling into midweek; some rebound likely by Friday
- Gold prone to sharp declines into midweek with gains possible late week
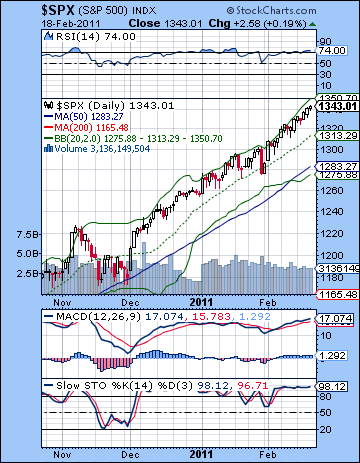 The bull party continued for yet another week as positive economic news and good earnings reports more than offset any inflation worries. The Dow closed 1% higher to 12,391 while the S&P500 finished at 1343. It seems as if we have entered some dystopian science fiction world where all risk has been eliminated by the Fed and stocks can only move in one direction — higher. While I wasn’t expecting much action from last week’s aspects, the absence of any downside whatsoever was slightly puzzling. Certainly, the midweek Sun-Neptune conjunction meant that any declines would be easily offset by some optimism that would put a floor under prices. Indeed, the largest gains of the week occurred on Wednesday and Thursday which was very close to this conjunction. We saw a tiny pullback on Tuesday which roughly correlated to Monday’s Mercury-Saturn aspect although like most Saturn aspects lately, it was underwhelming. In keeping with the bull rally autopilot, however, Friday’s Venus-Saturn aspect only translated into an absence of gains rather than any significant loss.
So the QE2 rally remains very much in place here as inflation is not generating much concern just yet, despite last week’s 3.6% core reading. Lingering high unemployment combined with inflation no doubt makes for the Fed’s nightmare stagflation scenario where growth is too slow to improve the jobs picture but is still enough to fuel higher prices. But we’re not anywhere near that point yet, as most economic and earnings data show the recovery is underway. As the recovery builds steam here, it may well reduce the need for the Fed’s stimulus and we have heard of some Fed members wondering if the rest of the treasury purchases need to go ahead as scheduled. In this sense, more economic good news could be bad news for equities since it would increase the likelihood that the cheap liquidity tap would be turned off. This would be a blow to many bullish investors who have been relying upon the liquidity to reduce risk. The other key factor to watch for is when good news no longer pushes the market higher. While we haven’t quite reached that point yet, this is usually a signal that all the bulls are in the market and there is no one left to buy. From an astrological point of view, this bullish stance still seems to be on its last legs as Saturn’s opposition to Jupiter on March 29 is likely going to coincide with growing caution and fear (Saturn) of inflation (Jupiter).
 From a technical perspective, the wedge is still king. The late week gains pushed up against resistance of the upper trendline suggesting that some kind of downward drift is likely this week. This week’s support comes in around 1310 and any violation of this level would be highly significant since it has been tested twice in previous corrections in November and late January. Of course, the most probable situation would be a third test of this rising support line and then a bounce back up. But the market is so overbought now, it seems more likely that a correction will be fairly sizable and thus break below the 1310 support line. Despite its current lofty level, RSI (74) has reached as high as 80 on the daily SPX chart and therefore it is conceivable that we could get another run to 80. (It’s worth noting that the Dow daily RSI has already reached 78.) I very much doubt this will happen, but that may be the thinking of the QE2 bulls who are riding this rally for all its worth and throwing all caution (and risk) to the wind. Stochastics have reached 98 and can’t climb much higher without rewriting the laws of mathematics. Meanwhile, MACD is still in a bullish crossover and bulls can well point to this as an indication of the legitimacy of the rally. Moreover, it has reached a level where it has essentially erased the bearish divergence with respect to previous highs.
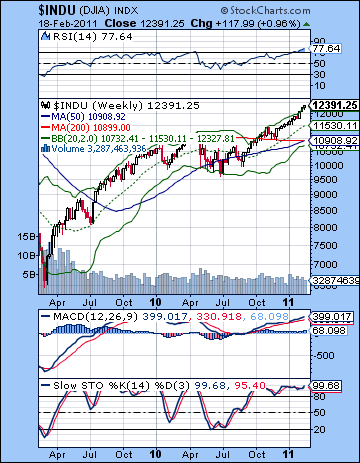
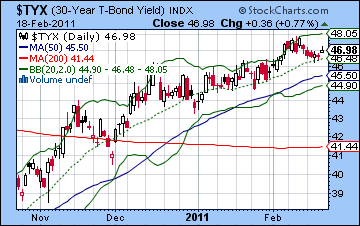
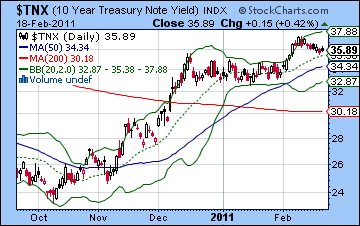
If the wedge does break down in the near term, the next obvious level of support would be near the 50 DMA at 1282. This also roughly corresponds with the bottom Bollinger band. This strikes me a plausible scenario since it would then set up a subsequent rally attempt back up to the wedge support line. This support line would therefore become resistance and would now be at a somewhat higher level, something like 1320 before the next leg of the correction would occur. Of course the initial breakdown of the wedge could be deeper than 1282, but it is hard to say just where support could kick in other than the 50 DMA. The weekly Dow RSI (77) is massively overbought and should be likened to a ticking time bomb. Of course, the weekly chart can exist in such a state for an extended period but it nonetheless paints a precarious and unsustainable picture. Support here is likely around the 200 WMA at 10,908 (about 1180 on SPX) although it is unclear to me if that level will hold over the next two months. Certainly, it will provide a comfortable port for bulls in any corrective storm and we should expect buyers to move in when it approaches this line. Meanwhile, bond yields held their own last week as the 30-year treasury remained near an inflection point at 4.7%. A move lower would suggest that bonds are again a viable investment, even if it comes at the expense of the equities market. A push to 5% would likely attract many buyers and could spark a sell-off in stocks. The chart of the 10-year yield looks like a series of bull flags which points to higher yields in the near future. This would be bad news for stocks.
 With the markets closed Monday for Presidents’ Day, we nonetheless have a good opportunity for some downside this week. Tuesday features a separating Mars-Neptune conjunction that brings together two negative influences in one neat package. What makes this pair even more potentially negative is the aspect they form with Ketu, the South Lunar Node. Mercury is close at hand and will form an aspect with Ketu on Tuesday also so there really is an usually large negative potential here. Admittedly the market has been quite strong recently and has managed to resist previous Saturn aspects which were also putatively bearish. But this pattern involves the nodes, so we could see a new dynamic here. I am expecting two down days here on Tuesday and Wednesday, and there is a good chance the move will be fairly large. So we could well test support of the rising wedge at 1310 — that would amount to a 3% pullback. Not much, but given the nature of the market lately, it would be noteworthy. It could be more than that, but it’s hard to say. The end of the week looks more bullish, however, as the Sun conjoins Mercury and both planets will move into a positive alignment with Jupiter. Perhaps the more important question is whether the early week decline will be greater than any late week recovery. I tend to think it will be so the week will be net negative. So a bullish scenario here would be a decline Tuesday and Wednesday to 1310-1320, and then a recovery by Friday to 1340. A more bearish scenario — which is also more likely — is a decline to 1310 or below (even 1280?) and then a modest recovery by Friday back to 1320, although much will depend on how low we go by midweek.
 Next week (Feb 28-Mar 4) looks like it will begin positively on the Venus-Uranus aspect and this may well deliver two days of gains going into midweek. Perhaps this will produce more upside to the resistance/previous support line. The late week looks more uncertain although the minor aspects involving Saturn and Pluto seem to suggest a mixed outcome at best. The following week (Mar 7-11) looks negative as the Mercury-Uranus-Rahu alignment could correspond with sudden moves. That said, I do admit that the negative potential is more equivocal than some, so this would reduce the probability somewhat. The market looks more wobbly after that as the Mars-Saturn aspect is likely to take it lower mid-March and then set up the Jupiter-Saturn opposition on March 29. While the market is likely to fall into late March, it is less clear what happens in April. We could see a meaningful low in the first week of April and the Sun-Jupiter-Saturn alignment or it will continue to fall into April 18 and the Mercury-Mars-Saturn alignment. While both of these combinations will likely correspond with lows, it is unclear which will produce the lower low. What I can say is that the market looks healthier after Mercury turns direct after April 23. This should begin a significant rally that carries on into May, June and July. Where we end up in the summer is hard to know, although I would not rule out a higher high. I don’t think it’s a probable outcome but it is a possibility worth considering. In percentage terms, a higher high in July would be about a 20% probability, with a matching high of approximately 1350 about 30%. A slightly lower high of perhaps 1280 would be 30% and 1200-1220 about 20%. After August, the market looks bearish again with September’s Saturn-Ketu aspect the likely focus of bearishness and then December’s Jupiter-Saturn aspect taking the market down to an even lower low.
5-day outlook — bearish SPX 1310-1330
30-day outlook — bearish SPX 1250-1280
90-day outlook — bearish SPX 1200-1280
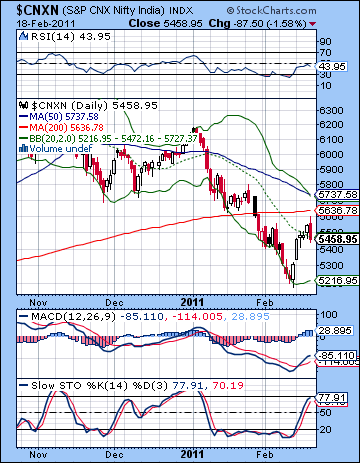 Stocks rebounded strongly last week fueled by bargain hunting and positive earnings reports as a pre-Budget rally appears to be underway. Despite Friday’s decline, the Sensex climbed almost 3% to close at 18,211 while the Nifty finished the week at 5458. While I expected some upside on the Sun-Neptune conjunction, the extent of the gain was a little surprising. I had generally allowed for some gains to take place in the late February and early March time frame, but did not realize they would come so soon and in so concentrated a manner. Monday was the most disappointing outcome as the expected downdraft from the Mercury-Saturn aspect actually coincided with a major gain. The bulls actually racked up positive outcomes on four days out of five last week, which at least showed some of the influence of the Sun-Neptune conjunction. I thought this was likely to manifest more midweek but the larger gains arrived on Monday, Tuesday, and Thursday. At least Friday’s Venus-Saturn aspect did coincide with a significant decline as the Nifty dipped below 5500.
The Union Budget is due on Saturday 26 February and is likely to put the inflation issue front and centre. Rising costs threaten to squeeze the corporate bottom line and the prospect of poor earnings and higher interest rates are making equities less attractive. It is worth noting that the budget will be released on a day of a close alignment between the Sun, Jupiter and Pluto. This is quite a positive and optimistic combination which may mean that the budget is well received, at least initially. Since Jupiter symbolizes expansion, it is perhaps appropriate that the budget will focus on growth and the dangers of inflation. The Jupiter-Pluto pairing is associated with major financial plans so we can expect some significant new initiatives that should be applauded by the market. That said, the fact that the budget release occurs on the day of a Sun-Jupiter-Pluto pattern suggests that the budget may ultimately prove to be inflationary in its long term implications. I don’t expect the market to immediately reject the budget, but it may only prove to be ineffective over the course of time. In any event, we do seem to be entering a sideways or very short recovery period before the market makes another leg down. This is likely to coincide fairly closely with the Jupiter-Saturn aspect on 29 March and could well carry over into April.
 Last week’s rally boosted the bullish technical case as Friday’s close set close to the 20 DMA. While this is a modest achievement, it nonetheless suggests there may be signs of life in the Nifty. Price has bounced off the bottom Bollinger band here and is venturing to perhaps take a run towards the upper band at 5750. More interesting are the Fibonacci levels. The previous week’s low at 5176 almost exactly matched the 76.4% retracement from the May 2010 low (4811) to the November 2010 high (6343). This increases the likelihood that this is a plausible support level going forward. Since I am expecting some more upside, it’s worth noting that the 50% retracement level is 5577 and the 61.8% level is 5758. At the upper end of potential rebound rally targets, the 23.4% retracement at 5980 is also worth considering as resistance. But if we look at the Fib levels just based on more recent moves from the January top (6182) and the February bottom (5176), the 78.6% retracement is 5966. This is very close to the 5980 level from the previous highs and lows. This is perhaps reinforces this approximate 6000 level as the upper limit of any rebound in the event it is quite strong. The 50% retracement level is 5679 so that is more easily achieved in the days and weeks ahead, while the 61.8% level is 5797. With the 50 DMA now close by this level at 5737, this is a fairly attainable retracement level in the event that the rally continues after the budget.
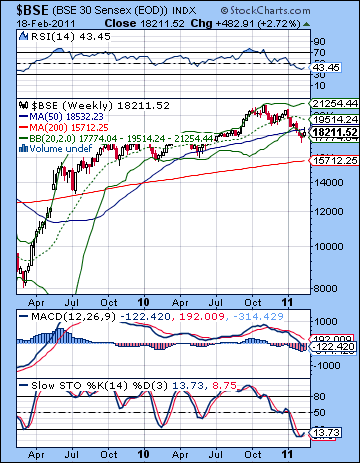
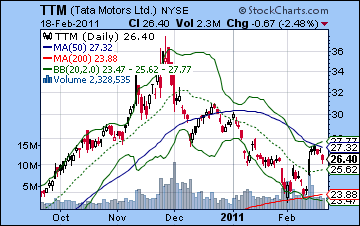
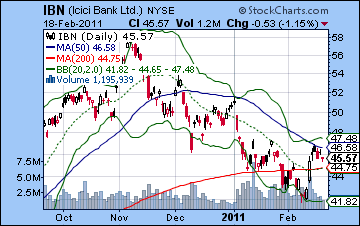
Stochastics (77) have run up quite high already and are close to being overbought. RSI (43) has moved up smartly from being oversold but is not giving any clear indications of its next move. The weekly Sensex chart has climbed back to the 50 WMA but needs to climb over this resistance level if it is going to avoid a larger decline. 18,000 is a potentially important level in this respect since it has been an important resistance level in the past. For the Sensex to avoid further declines, it needs another weekly close above 18K or else it could fall more sharply, perhaps all the way back to the 200 WMA at 15,700. This notion that the market is at a crossroads is evidenced in the chart of many stocks such as Tata Motors (TTM). While it previously bounced off support of its 200 DMA, last week saw its apparent rejection of the 50 DMA as it fell back in Friday’s session in New York. This does not preclude another run at the 50 DMA resistance level, but it is nonetheless cause for some concern for bulls. It was much the same story for ICICI Bank (IBN) as the rebound rally failed to move above the 50 DMA. A close above the 50 DMA would be quite bullish and might open the path to further gains, but until that time, the technical situation looks cautious. In sum, the Nifty’s reversal lower on Friday created a bearish engulfing pattern which suggested an unsuccessful test of the 200 DMA. This would increase the likelihood for further down moves, at least until another rally attempt. A close above the 200 DMA at 5636 might increase the likelihood of a run towards 6000. Until that happens, the Nifty will likely stay in a range between 5650 and 5200.
 This week looks likely to test support further as there are a few tense aspects early in the week. Mars conjoins Neptune on Monday and Tuesday so this should have a bearish effect on the market. Worse still, this conjunction will occur while in close aspect with disruptive Ketu so there is a possibility of a sizable decline. This bearish bias may continue through to Wednesday as Mars will still receive the unpredictable energy of Ketu at this time. While I do not expect three down days here, this three-day period does look to have a negative bias and two down days are quite possible. The late week period improves substantially as Mercury conjoins the Sun while forming a nice aspect with confident Jupiter. Thursday perhaps looks more reliably bullish than Friday although we should net positive for the end of the week and we could have two up days. Overall, however, I think the market will not be able to recover current levels so we could see a down week. A bullish scenario would see a down trend into Wednesday bottoming out around 5350-5400 and then a recovery back to current levels. However, the bearish scenario would see a sharper fall all the way back to 5200 with support tested sometime midweek followed by a partial recovery by Friday to perhaps 5300-5350. I would favour the bearish favour here, although it may well end up somewhere in between the two. In both cases, we are likely to see a consolidation process where bulls regain more confidence before launching another rally attempt in March.
 Next week (Feb 28-Mar 4) looks like it will extend the late week bounce and continue higher on the Venus-Uranus aspect. There is a good chance for two up days here at least before the steam runs out of the rally. I do not foresee any major declines at the end of the week, although it may be more mixed. Perhaps we will have another test of the 200 DMA here, and I would not rule out a test of the 50 DMA. The following week (Mar 7-11) looks very unpredictable due to a Mercury-Uranus conjunction that occurs in close aspect with Rahu. This could see gyrations in both directions although the overall tone of the market looks negative so I would lean towards a bearish outcome here. Moves could be large. The rest of March looks increasingly bearish as Jupiter approaches its opposition with Saturn on 29 March. This is not to say that the market will decline until that date. It may do so, but the late March period has an increased likelihood of a potential medium term bottom. The first week of April also looks quite bearish on the Mars-Uranus conjunction so that may well bring lower prices. And I would not rule out bearishness lasting until 22 April and the Mercury-Saturn opposition. Given the uncertainty of the market through April, that last configuration may be a possible time when it is safer to take long positions in the expectation of a durable rally into May and June. In terms of levels, we could well see 4800 on the Nifty in April. We could see the market recover significantly into July, although it is likely to make a lower high, perhaps less than 6000. Then another corrective phase is likely starting in August which will carry through to much of the rest of 2011. 4000 on the Nifty is possible here by the end of the year.
5-day outlook — bearish NIFTY 5300-5400
30-day outlook — bearish NIFTY 5200-5400
90-day outlook — bearish NIFTY 5000-5300
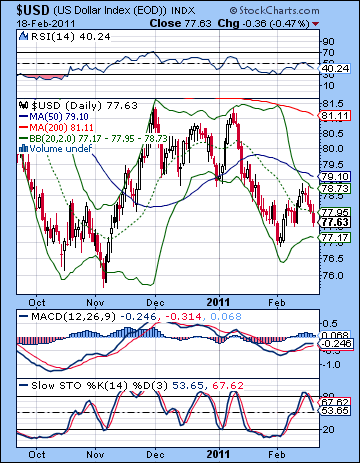 The Dollar fell last week as risk appetite increased on improving economic data. The USDX closed below 78 while the Euro added a cent closing near 1.37 and the Rupee climbed to 45.1. I had been more bullish on the Dollar on the expectation that two Saturn aspects might generate a little more fear in currency markets. While I expected some midweek declines on the Sun-Neptune conjunction, the Dollar ended up significantly lower than expected. While the decline reflected negative sentiment on the Dollar, the technical situation did not suffer unduly. Friday’s close matched the intermediate low from the recent rally and price is still above the February 1st low of 77. Certainly, a close below 77 would be very bearish but we still have a ways to go before that happens. The close below the 20 DMA was also quite negative, although this line has not proven to have much technical significance in the recent past. The Dollar is close to the bottom Bollinger band here, so that offers some increased likelihood of a bounce. Stochastics (53) have fallen from the overbought area and may be trending lower here. RSI (40) has slipped a bit from recent highs but is still in good shape for tracing higher after the double bottom. MACD is falling but still in a bullish crossover and below the zero line. Interestingly, all three key moving averages are falling here, as if to underline how bearish the recent action on the Dollar has been. The daily chart does not offer too much hope to bulls, although the weekly chart is somewhat better.
This week has a reasonable chance of a move higher owing to the tense conjunction between Mars and Neptune. This should make things more difficult for the Euro and spark a movement back to the Dollar out of safety. However, there is an absence of confirmatory hits in the USDX horoscope that makes me somewhat less confident in a bullish outcome here. The late week period looks more difficult for the Dollar as the Sun-Jupiter aspect will likely benefit the Euro. The Euro chart bears close watching over the next two weeks due to the close Rahu-Uranus square aspect across the ascendant in the 1999 chart. This is an extremely volatile influence that may move the Eurodollar sharply. It seems like a bearish influence, although I would admit there is a little more possibility for a rise than one would find in a Saturn transit. I am generally quite bullish on the Dollar as we move deeper into March and closer to the Jupiter-Saturn opposition at the end of the month. For this reason, I would not be overly concerned if the Dollar continued to sag here at the end of February. I don’t think it will, but in the event that it does, a sharp recovery seems more likely in March. The Dollar rally should continue into April and perhaps May but tend to decline after that as June and July look bearish. A strong rally in September will likely accompany the next major move down in equities. This rally in the Dollar may well last until the end of 2011.
Dollar
5-day outlook — bullish
30-day outlook — bullish
90-day outlook — bullish
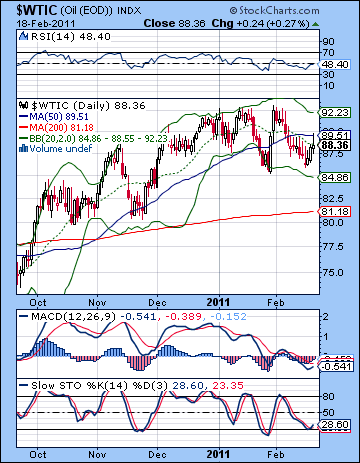 Crude was buoyed by further unrest in the Middle East as prices rose by 3% to close above $88 on the continuous contract. While I had been more bearish overall, the week roughly conformed to expectations as the early week period did see further losses on the Mercury-Saturn aspect. Declines were fairly modest, however, and that set the stage for the gains that corresponded to the Sun-Neptune conjunction midweek. I thought we might see more downside on Friday’s Saturn influence but crude ended slightly higher. Technically, crude is betwixt and between as it rejected the 50 DMA above $89 during Friday’s session and finished well below it. This was a potential indication of weakness going forward. If the 50 DMA has become significant resistance, then support remains at the $86 level and the previous low. A break below this level would likely hasten a decline to $80-82 and the 20 DMA. Meanwhile, the upper Bollinger band has come down somewhat and now stands around $92. This is below the recent high and would appear to be carving out the possibility for a bearish head and shoulders pattern. I don’t think this is a probable outcome in the near term, but traders may be looking at the pattern with a wary eye. MACD is falling here and is forming a negative divergence despite attempting to crossover. Stochastics (28) offer the bulls some solace as price has bounced off the oversold line and may be moving higher. RSI (48) is also moving higher here after forming a bullish divergence or double bottom with respect to recent lows. However, failure to reach the 60 level would be quite bearish as it would set up a negative divergence with the previous high.
This week looks quite bearish at the outset after Monday’s holiday closing. Tuesdays’ Mars-Neptune conjunction does not bode well for crude, which is partially ruled by Neptune (liquids). Wednesday could see further turbulence as Mars is in aspect with Ketu. So there is a good chance for two down days here, and a sizable decline is quite possible. Support at $86 will be tested, and I would not be surprised to see crude traded lower than that. Some recovery is likely at the end of the week on the Sun-Jupiter aspect although this is unlikely to recapture current levels above $88. Next week looks bullish to start but may end more mixed. A short rally is possible into early March and the Mercury-Uranus-Rahu alignment on the 9th but prices look more bearish to mixed after that. Late March appears to have the most bearish patterns and therefore will likely mark the sharpest decline in price.
5-day outlook — bearish
30-day outlook — bearish-neutral
90-day outlook — bearish
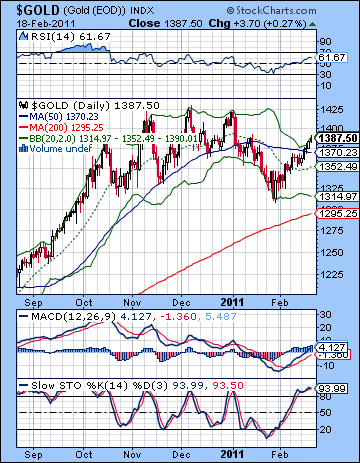 Gold continued to shine here as more Middle East unrest boosted its safe haven status and further evidence of US inflation didn’t hurt either. Gold finished the week at $1387 on the continuous contract. This bullish outcome was in keeping with expectations as I thought the midweek Sun-Neptune conjunct would correspond with significant gains. I was uncertain how Monday and Friday would end as there was some potentially bearish Saturn influence at that time. As it turned out, both days brought modest gains while the larger gains occurred during the key midweek period. I thought gold had a good chance to hit $1370 or higher and it certainly took flight as it closed above its 50 DMA. Gold has pushed all the way to its top Bollinger band here and therefore may be more vulnerable to pullbacks. MACD remains in a bullish crossover and has now crossed above the zero line. If it does not advance further, it will set up a negative divergence with respect to previous highs. The same negative divergence is evident in the RSI (61) chart as current levels are below their January high and thus display a series of falling peaks. A climb above 65 would change the situation significantly, however, and create a bullish divergence. We shall wait and see if that is possible. Stochastics (93) have climbed into the overbought area and do not look appealing for gold bulls looking for more upside. The key support level is found in the rising trendline off the 2009 and 2010 lows. This line is now around $1330. If this is broken, gold could tumble back to $1250 fairly quickly. Below that, medium term support may be found near the $1000-1050 level.
After Monday’s holiday closing, this week could be quite bearish for gold as the Mars-Neptune conjunction will also bring in unpredictable Ketu into the mix. There is a real potential for sizable declines here on Tuesday and perhaps Wednesday. It seems likely that gold will fall at least back to $1350 and the 20 DMA although it is quite possible it will test support of the rising trendline near $1330. Thursday and Friday look more bullish as the Sun and Mercury conjoin while in aspect with Jupiter. This is likely to correspond with a significant gain, although I cannot see gold returning to its current level at $1387. Gold will undertake another rally attempt as we head into March. The first half of March could be choppy with gains and declines creating a sideways movement. Nonetheless, I would expect a bearish bias here. The more reliably bearish period looks like the second half of March as we approach the Jupiter-Saturn opposition. If gold has conclusively failed to reach $1400 in early March, then the sell-off could be quite sharp. The downtrend will likely stay in place until late April at least. I think it’s quite probable gold will test $1250 by this time, and it is even possible it will be lower than that.
5-day outlook — bearish
30-day outlook — bearish
90-day outlook — bearish

