Summary for week of February 28 – March 4
Summary for week of February 28 – March 4
- Stocks trending higher early in the week but may weaken later in the week
- Dollar may decline early but firm up later in the week
- Crude to moderate this week with gains more likely early
- Gold may rise early in the week but losses more likely as week progresses
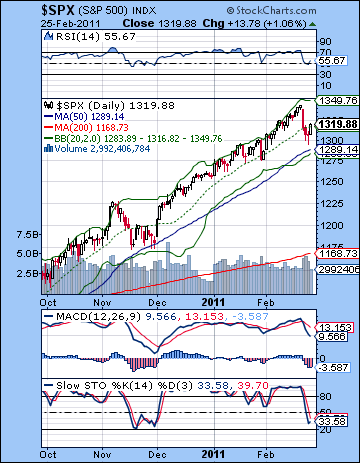 What a difference a week makes. As Libya moved perilously close to an all-out civil war, stocks tumbled as rising oil prices and the prospect of inflation threatened to derail the economic recovery. While stocks bounced back on Friday, the Dow had its worst week since November as it lost more than 2% closing at 12,130 while the S&P500 finished at 1319. This bearish outcome was very much in line with expectations as I thought there was a good chance the midweek Mars-Neptune-Ketu alignment would be very bad news for stocks. As always, there were some wrinkles along the way as Monday overseas was bullish, despite the fairly close Mercury-Mars conjunction. This pushed global markets higher while US markets were closed for the holiday. Nonetheless, my forecast for two down days on Tuesday and Wednesday did come to pass as we saw stocks drop by 3% and thereby test support of the rising wedge. I also thought we would see some recovery at the end of the week on the Sun-Mercury-Jupiter pattern as the S&P bounced off support at 1295 intraday on Thursday and then rallied back to 1320 by Friday’s close. It was a heartening confirmation of a high-probability bearish pattern.
I think the chances are fairly good (60%?) that we’ve seen the top and that we will get a lower top in early March before heading lower. While a certain level of Libyan instability has been discounted by the markets here, the approaching Rahu-Uranus square aspect may be indicative of more chaos for a little while longer. The Rahu-Uranus aspect is exact on 4 March but due to the relatively slow velocities of both bodies, its effects are somewhat diffused. Last week’s turmoil was certainly partially reflective of the Rahu-Uranus influence as fast moving Mars and Mercury acted as triggers to release of its pent-up energy. (Remember that the Moon’s nodes, Rahu and Ketu, are often two sides of the same coin so an aspect with one is also an aspect with the other.) Rahu symbolizes interruption of order and a break with routine while Uranus is the planet of rebellion and revolution par excellence. Uranus seeks freedom and independence from authority and so its combination with unpredictable Rahu here encapsulates much of the ongoing unrest in the Middle East. But once that aspect begins to separate by mid-March, Jupiter will move into position against Saturn for the end of March. This is another clearly bearish influence which still should pack quite a punch. While it is possible that both of these influences could meld into a single bearish energy, I tend to think that we will see two separate down moves. The first one occurred last week, and after a "wave 2" relief rally in the coming days, we will get the larger "wave 3" down that takes us into late March and probably early April. At the same time, I would not completely rule out a higher high in early to mid-March. I would say, however, that this is not probable. Even if we would make a higher high in early March, I would still expect a significant correction in the second half of March and into April. Perhaps that might even create a head and shoulders pattern with the early March high as the head and Feb. 18th high as the left shoulder.
 The wedge was very much in play last week as Thursday’s intraday low of 1295 provided a significant test of support. According to the standard logarithmic scale, this was a piercing low that violated the support line at 1310. But using a non-logged scale, we can see that 1295 was almost exactly on the support line of the wedge. So it is more a mathematical matter whether we broke the wedge support or not. It’s also worth nothing that we broke above the resistance of the wedge on Feb 18 using the non-logged scale. This overthrow of the wedge is often considered a bearish development, so it may have hastened last week’s correction. No matter which parameter one chooses to use, last week’s action was quite bearish as it was the first break of the 20 DMA since November. Friday’s rebound was significant obviously as the possible first test of the 50 DMA at 1289 was successful. Bulls may actually be in a celebratory mood now that they believe that the correction is out of the way and the market is poised to climb higher. The indicators offer a mixed picture with MACD still in bearish crossover and RSI (55) turning higher. Certainly, there is room for another run to the 70 line if the market is going to push up to a higher high. Stochastics reversed at 33, a possible sign that downside is more likely than upside since a reversal below the 20 line is more reliable.
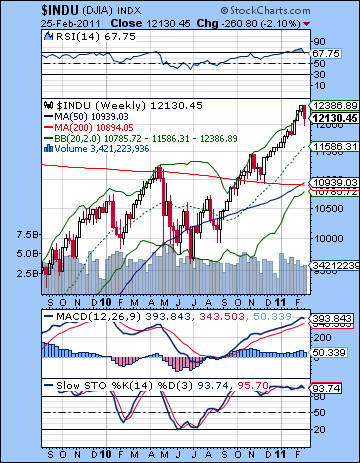
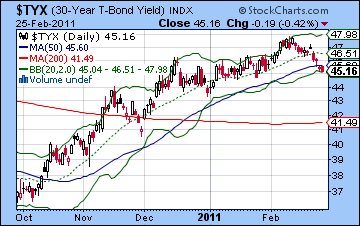
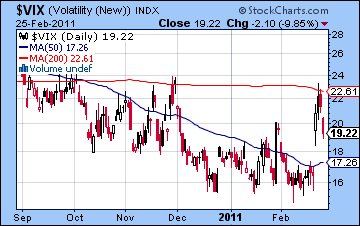
The weekly Dow chart is still going strong as RSI (67) has only now slipped below 70. MACD is still in a long bullish crossover although it may be showing signs of weakness. Stochastics (93) are still very overbought and do not offer a compelling reason for going long for the medium term. Moreover, this chart does not provide evidence that this market is going to go significantly higher because it has not bottomed close to any significant level. Even a modest correction would likely test the 20 WMA at 11,586 and we are still 5% above that. A more thoroughgoing correction would test the bottom Bollinger band at 10,785, which is also in the proximity of the 200 WMA at 10,939. In the event that the rising wedge in the daily chart breaks down, this 10,939 area would likely be a significant line of struggle between the bulls and the bears. This equates to about 1179 on the SPX. We should note that support of the non-logged rising wedge will stand at about 1300 this week, while the support line in the logged wedge will be at around 1320. If we are using the logged wedge support line, then Friday’s gain could represent a successful back test. Wednesday and Thursday broke below it, and Friday came back to kiss it good-bye. That would suggest that there is very little further upside room left this week before the waterfall downwards begins in earnest. So those are two views of the same pattern with very different implications. Meanwhile, all the bearishness in equities pushed more investors towards treasuries as yields moved lower. The 30-year yield declined to 4.52 and is now right in the that congestion area. It could very easily reverse course here and move back up. Predictably, the $VIX shot higher last week but was turned back around 23 and the 200 DMA before easing off again. If stocks continue to rally this week as I expect, then that big gap at 17-18 may fill. This would set the stage for perhaps another breakout higher or alternatively, a somewhat longer period of consolidation.
 The planets this week lean towards the bulls, especially in the early going. Monday’s Venus aspect with Neptune and Uranus looks quite positive so that is an 80% probable up day. Tuesday will still see Venus quite close to Uranus so it is possible that could also be a bullish day, although the chances seem more uncertain. That is perhaps more like a 40% up day, with 30% down and 30% neutral. Mercury will be a close minor aspect with Saturn on Tuesday and Wednesday, so that may invite some selling. Perhaps Tuesday will see an intraday reversal that takes the market lower at the close. The rest of the week looks more difficult to call. If Wednesday is down, then Thursday has a somewhat increased chance of a positive day as the Moon conjoins Neptune. At the same time, there is still significant downside risk as we move through the rest of the week. It’s almost as though there is a shrinking middle ground here, with the chances for more neutral days diminishing. Friday’s New Moon is a bit of a toss-up, although the proximity to Mars may put a bearish spin on things, even if it’s more in the morning. A bullish scenario would be a rise to 1330-1335 by Tuesday and then a flat Wednesday with perhaps some profit taking at the end of the week so we finish somewhere between 1320-1330. I’m not convinced we will have a positive outcome here, however. A more bearish scenario would see 1330 by Monday with a reversal Tuesday back down to 1315 by Wednesday. The end of the week could be mixed with but have bearish bias so that we finish lower than current levels, say between 1310-1320. That said, there is significant risk for some sudden downside moves here although I would not say they are probable. But the medium term indicators are quite bearish here so it is important to be prepared for downside.
 Next week (Mar 7-11) could be quite choppy with the Mercury-Uranus-Rahu alignment exact on Tuesday. While this is not as theoretically negative as last week’s Mars-Neptune-Ketu, there is a higher possibility of volatility and sudden declines here. While I am leaning towards a bearish outcome here early in the week, I recognize that it could also be positive. In that sense, it increases the magnitude of the move, without giving clear indication of market direction. The rest of that week could have a bullish bias on the Venus-Jupiter aspect. The following week (Mar 14-18) may begin positively on the Mercury-Jupiter conjunction but the bears may move in again on the Venus-Mars aspect later in the week. The second half of March looks more solidly bearish so it is possible we may only get a major break of the wedge then. That would be the most bullish scenario. That could mean a bottom in April sometime, perhaps around 1180/10,900 depending on whether we get a higher high here in early March. If we do see a higher high, then the bottom may be above 1200. More bearishly, however, we may form a lower high in March and then head down from there. This creates the possibility of more downside in March and into April. I would not rule out 1040 here on the SPX although I admit that is extreme. Whatever low we eventually see, a rebound rally should be quite powerful and may last from May to July. As I’ve noted previously, I don’t know if this will be a higher high for 2011 but the market is likely to fall significantly after that. The second half of the year seems more bearish as the Saturn-Ketu aspect in September will likely coincide with some major declines.
5-day outlook — bearish SPX 1310-1320
30-day outlook — bearish SPX 1200-1250
90-day outlook — bearish SPX 1200-1280
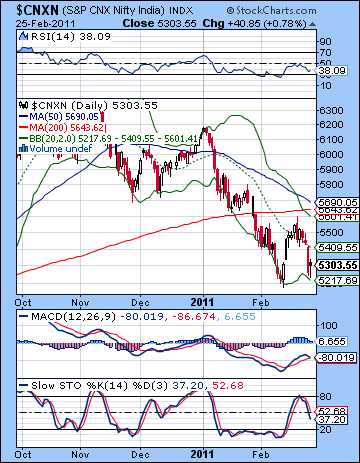 Stocks fell sharply last week as the events in Libya drove up oil prices and again moved inflation fears to the front burner. This was the last thing the already jittery market needed as many FIIs headed for the exits. The Sensex closed below the crucial 18K level, finishing Friday at 17,700, while the Nifty finished at 5303. This bearish outcome was in keeping with expectations as I thought there would be some nasty fallout from the midweek Mars-Neptune-Ketu alignment. Admittedly, Monday’s solid gain was a little anomalous, although I recognized that there would be some mixture of up and down days in the early going. The late week period also provided its share of surprises as Thursday turned out to be very bearish indeed. While I thought the late week period would see some recovery, I had marked Thursday as actually holding more positive potential than Friday. Certainly, the late week Sun-Mercury-Jupiter configuration did deliver some upside, although it was quite modest and it only occurred on Friday.
This most recent pullback is very much a reflection of the dominant aspects. In previous newsletters, I had noted the likelihood of "sudden changes and eccentric behaviour" around the Rahu-Uranus aspect which becomes exact on 4 March. Since both are slow moving planets, we are no doubt seeing the effects of this pairing now as uncertainty and instability are making many investors nervous. Rahu represents breakdowns in order and routine and it is often implicated in changing circumstances. Similarly, Uranus also symbolizes change, although it is usually more rapid and sudden than Rahu. Significantly, Uranus is also the planet most associated with rebellion and freedom and for that reason it is frequently prominent at times of social transformation and revolution. Since the aspect will still be very close for the next two weeks, we should expect more instability from Libya. Whether this creates more market fallout is another question, however, as investors typically discount future events. The market may only react negatively if there is a protracted civil war. Astrologically, I still expect significant downside bias for the next month or more, although it may be quite a roller coaster ride. But if all eyes are on Libya and the continuing chaos there, India may get a dose of good news with Monday’s Union Budget. (Btw, in last week’s newsletter I mistakenly dated it for Saturday 26 February.) Since there is usually a bullish bias around the budget period, many analysts are expecting the budget to give a lift to the market. Usually, this bullish period begins before the budget but it seems as if the situation in the Middle East has robbed the market of its usual rise. So it is somewhat more likely that the bullish optimism around the budget will manifest only in the days following. Even with a small post-budget boost, the overall market trend still looks negative.
 The technical situation grew much more grim last week as the market fell away from its 20 DMA and headed towards its previous low of 5200. While the higher low at the end of the week bouncing off the bottom Bollinger band was a somewhat bullish development, this may only be a short period of sideways consolidation before another move lower. Previous down moves have been followed by bear flags — gentle rises in price that eventually collapse to new lows. Although it may be likely that the market will move sideways or higher in the coming days, it will be critically important to see how it handles the 5700 resistance trend line. This is a very busy junction of several lines including the top Bollinger band (5601), the 50 DMA (5690) and the 200 DMA (5643). A continuation of this bear flag pattern may see a rebound back towards 5700 and then another breakdown of support and a move lower, perhaps below 5000. The short term perspective does offer the bulls some comfort as we can see MACD forming a positive divergence, albeit against a backdrop of yet another incipient bearish crossover. RSI (38) may well have bottomed here and formed a higher low which could signal higher prices in the near term. Stochastics appear to have more downside, however, and more ominously the 50 and 200 DMA may soon form a death cross. These are not always immediately bearish, but they often occur ahead of a major corrective phase.
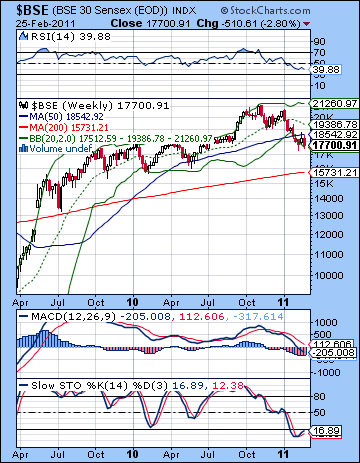
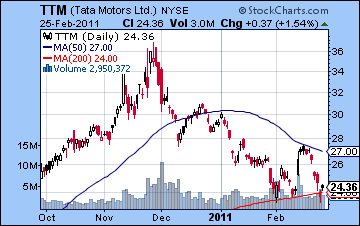
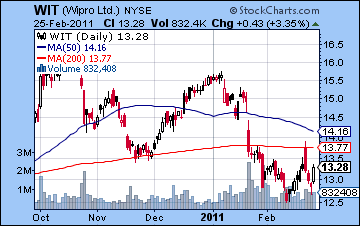
The weekly BSE chart shows just how far the correction has moved thus far. RSI sits at a lowly 39 but incredibly still has some room to fall further before providing medium term investors with a reason for committing money to the long side. What is especially noteworthy about this chart is the inability of the BSE to stay above 18,000. This was a significant resistance/support level dating back to 2009 and it provided some support recently as the early February decline appeared to have arrested just a little below that level. But the rebound rally attempt was stopped very close to the 50 WMA at 18,542 so that may be a key resistance level now. This is equivalent to 5563 on the Nifty and should be regarded as the first important level of resistance in the event of another rally attempt. If it fails to hold above this level, there is the very real danger that it will fall quickly towards the 200 WMA at 15,731. If it does start to break down here, there is no guarantee that even this level will provide support. 13,500-14,000 would be more of a failsafe level of support which roughly corresponds to the big gap up from May 2009. Individual stocks similarly show considerable weakness but are playing the waiting game as they will either break above the 50 DMA or fall below the 200 DMA. This is clearly seen in the Tata Motors chart (TTM) where price fall away from the 50 DMA last week and may have found support here at the 200 DMA. As the Rupee continues rising, outsourcers like Wipro (WIT) remains very weak as it cannot even break above its 200 DMA. This is a significant resistance level for the days ahead. There will likely be another rally attempt to push through it, but it is unclear if it can succeed. No doubt sellers will move in once again as it approaches this obvious resistance level.
 With the Union budget due on Monday, this week could see some large price moves. Since Venus will be in good aspect with Uranus and Neptune, it seems quite likely that stocks should rise, perhaps significantly. I would not rule out a 2-3% gain here. Tuesday is more interesting, however, since Venus will still be in the driver’s seat although slightly weakened by virtue of the fact that it is now moving past its exact aspect. The Moon will be just past a conjunction with Venus so that may also support some buying action, but there appears to be a greater risk of a midday reversal. It’s a difficult outcome to predict, although I would still lean slightly bullish. Nonetheless, I would expect the first two days of the week to be net positive, with Monday looking more reliably bullish than Tuesday. After Wednesday’s holiday closing, however, sentiment may turn cautious as the Moon conjoins Mars in Aquarius. If the first days of the week incline towards the bulls, the last two days of the week tilt towards the bears. With the medium term outlook so grim, it’s hard to forecast a bullish week since these short term influences may be overridden by longer term aspects at any time. Nonetheless, I do think there is a somewhat greater chance of a positive week here. A more bullish scenario would have a rise to 5500-5600 into Tuesday and then some modest profit taking going into Friday to take the Nifty back down to 5400-5500. A more bearish unfolding might see a shallower rise into Tuesday to 5400-5450 with some late day weakness. The late week period would see more declines with the Nifty finishing closer to 5300-5350. As I said, I would favour the bullish version here but rebound rallies do not look stable or reliable here.
 Next week (Mar 7-11) could be quite telling as the Mercury-Uranus-Rahu alignment on Wednesday could move the market significantly. This is quite an intense energy that may correlate with a large price move. Generally, this looks like a bearish influence, although I would note a greater level of ambiguity here than what we saw last week on the Mars-Neptune-Ketu alignment. Stocks may well rise into this midweek aspect and then tend to fall afterwards. 5700 seems fairly doable in early March and I would not even rule out 5950. The following week (Mar 14-18) starts very bearishly on a Mars-Saturn aspect that should set a negative tone for the week. This may well usher another major leg down. The second half of March looks generally bearish with the largest declines likely in the last week near the Jupiter-Saturn opposition on the 29th. This would be the earliest possible date for investors thinking about taking on a medium term long position, although it would be quite risky. April would also appear to have its share of difficult planets as Mercury turns retrograde while in aspect with Rahu and then ends up in opposition to Saturn. This does not look like a positive situation for Mercury. A possible low here might be April 22 or 25 right around the Mercury direct station. I would not be surprised to see the Nifty trading at 4800 in April and it could easily be lower than that. After that, stocks should stage a significant rally that lasts into July. This looks like a lower high than January’s lofty levels. I would expect only a partial retracement from the April lows. Sentiment is likely to worsen again in August and September as Saturn comes under the aspect of Ketu. This is likely to produce a lower low sometime in Q4. Nifty 4000 may well be in play here.
5-day outlook — bullish NIFTY 5400-5500
30-day outlook — bearish NIFTY 5000-5200
90-day outlook — bearish NIFTY 5000-5400
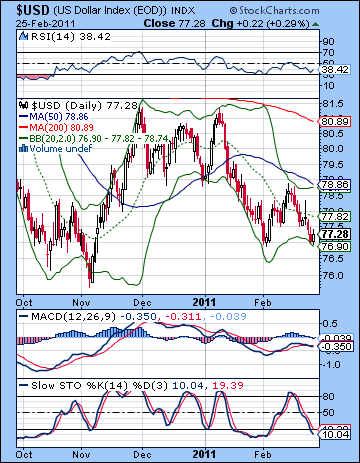 The Dollar took it on the chin again last week as it drifted lower against most major currencies. While the Dollar usually acts as a safe haven in times of geopolitical uncertainty, the Libyan crisis places oil front and center so scarce commodities become a more valuable hedge. I had been more bullish, although I did sound a note of caution since the charts did not quite line up as bullishly as I might have hoped. The Dollar is sitting in a very vulnerable position here as it has matched its previous February low. If it falls through 77, it will likely quickly sink back to the November low at 75.5. On the bullish side, MACD is forming a positive divergence, albeit in the context of a bearish crossover. RSI at 37 is also ambiguous as it may be heading back down to the 30 line or continuing its move higher after the double bottom. Stochastics (9) are oversold here and offer some evidence, however fragmentary, that the next move may be higher. Bulls can also point to the fact that the Dollar is near the bottom Bollinger band and may well reverse course and move higher. But it is certainly a chart that is filled with negative momentum as all three moving averages are falling and price has fallen below the 20 DMA. From an intermarket perspective, the Dollar looks vulnerable to declines as long as the turmoil in Libya continues and the price of oil stays up. With Rahu squaring Uranus later this week, it seems likely that the Libyan situation will remain volatile so the Dollar will continue to struggle for the near term.
This week could well be a make or break week for the Dollar as the Rahu-Uranus square culminates on Friday. This aspect falls exactly across some key positions in the Euro chart so we could see a significant price move. Since the Euro has been rising recently, one possible scenario would be a rise into the aspect and then a reversal. As I said last week, I would not be surprised to see the Dollar stay weak up to late February so we are likely getting close to the proverbial inflection point both technically as the Dollar lurches towards its recent lows and astrologically as we get this Rahu-Uranus aspect over with. Monday’s Venus-Uranus aspect is likely to boost stocks but it is uncertain if it will help the Dollar. While stocks have recently moved inversely to the Dollar, that relationship has been interrupted of late. I also note that this aspect lines up fairly well in the Euro chart, so I am inclined to think the Dollar could sink early on this week. This pattern may well continue more or less in place for the rest of the week. However, March is likely to see a reversal in the Dollar’s fortunes. It may reverse here at 77/1.37 or it may even end up reversing around 76/1.39 but a reversal does seem to be in the cards as the Jupiter-Saturn aspect at the end of the month lines up quite well in the USDX chart. For this reason, I would expect the Dollar to rally starting in March. This seems likely to continue into April and perhaps into May. It seems likely to consolidate again through to July, although I am unsure just where. There is a high probability of a major Dollar rally in August and September.
Dollar
5-day outlook — bearish-neutral
30-day outlook — bullish
90-day outlook — bullish
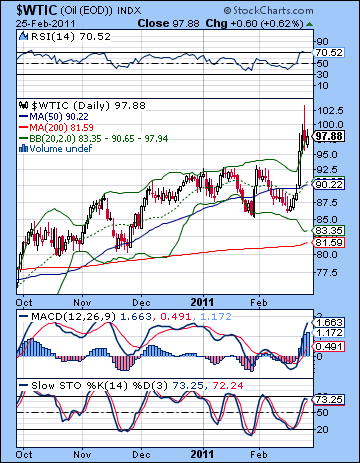 As Libya descended into chaos, the price of crude spike towards $100 finishing near $98 on the continuous contract. I frankly missed this move as I thought the nasty Mars-Neptune-Ketu alignment would take both stocks and commodities lower. While the move was appropriately big, I got the direction exactly wrong. There are no easy explanations for this rise other than recognizing that Ketu acted in a very unpredictable and powerful fashion. The Mars-Neptune conjunction certainly highlighted oil since Neptune rules liquids, but instead of its more customary bearish effects, Ketu reversed its polarity and sent prices soaring. I did expect some possible upside going into early March but never envisaged anything of this magnitude. Technically, crude’s breakout from its rising channel was bullish but it is unclear just how much further it could move. Thursday’s intraday trades above $100 exceeded the resistance level of the rising channel but the inability to close the week at or above this level was telling. RSI topped out around 71 at midweek and has fallen back to 65. This brief flirtation with the overbought area does not preclude additional runs above 70, but it makes the bullish case somewhat less appealing. MACD is now in a swollen bullish crossover but even now remains in a negative divergence with respect to previous highs. Stochastics (69) did not even reach the 80 level and may have turned around here. If price can break above resistance of the rising channel this week, then it may be more bullish for crude. But if it fails to close above $97-98, then it risks a downward retracement, perhaps all the way back to the bottom Bollinger band. Support from the rising channel remains around the $86-87 level.
This week could see crude stay firm, although I do not expect any further significant upside. Monday’s Venus-Uranus aspect is likely to boost economic sentiment generally, but that may not help crude which is now driven by chaos and violence. Venus tends to have soothing influence, so I would expect a calming of the market with further downside more possible. Some gains are still likely at some point this week, especially later in the week. This may see crude stay above $90 and could keep it closer to $95. Next week’s Rahu-Uranus aspect will be very important to crude as this may represent a peaking in chaos and turmoil that has driven prices up. I would expect to see another spike sometime around March 7-9 following by another calming of the market afterwards. It is unclear if this second spike will be higher or lower than last week’s spike, although I would lean towards a lower high. This will likely mark a significant high for crude and the price will begin to slide. This downtrend will likely last through March and extend into April. While last week’s events were very unexpected, I am still fairly bearish in my outlook for crude for the medium term.
5-day outlook — bearish-neutral
30-day outlook — bearish
90-day outlook — bearish
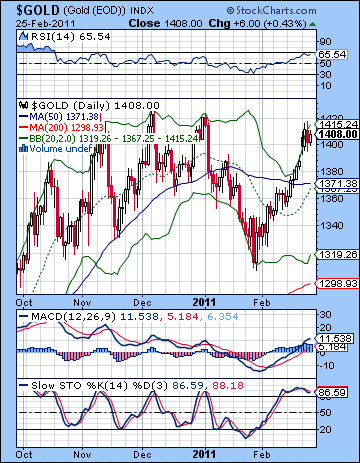 Gold took flight last week as the unrest in Libya spiraled out of control and threatened to interrupt world oil supplies. For all the sound and fury, gold rose a fairly modest 1.5% and closed at $1408. Given how bearish I had been, this was a very unexpected outcome. I thought the tense aspect of Mars, Neptune and Ketu would have forced prices lower. While stocks sold off sharply, my error lay in extrapolating from that specific aspect cluster. So while I did see a big move, it was the wrong direction. Nonetheless, I did foresee some further gains into early March so this was a somewhat surprising fulfillment of that expectation. What’s interesting is how weak gold remains here in the middle of all this turmoil. Note how it failed to break above $1420 on three straight days last week. There is quite a bit of resistance around the previous highs, and it may take some truly unbelievable Libyan scenarios to push it to new highs. Equally problematic is the fact that the RSI did touch 70 midweek and then retreated to 65. While gold may stay overbought for a while, its other signs of increasingly vulnerability make this a much less appealing long prospect. MACD is in a bullish crossover and is now roughly on par with previous peaks. Stochastics (86) are overbought now so this is further evidence for the bearish case for gold. If resistance is now at $1420, then support is likely near the 50 DMA at $1379. This line has acted as support recently and it may well do so again in the event of a pullback. The next level of support is then around the bottom of the long term rising channel, now around $1330. This is fairly close to the bottom Bollinger band. Below that, $1250 may bring in some buyers, although there is the chance that gold could eventually tumble all the way back to $1000-1050.
This week is likely to begin fairly positively as Venus aspects Uranus on Monday. It is possible that gains could persist into Tuesday. Of course, previously bullish combinations like Venus and Uranus may be somewhat less reliable here since gains have resulted from tense aspects. In any event, the bullishness is unlikely to last too long as Wednesday’s Mercury-Saturn aspect will likely correspond with some significant selling pressure. The late week period also seems fairly mixed with some bearish potential around Friday’s New Moon. This will occur in fairly close aspect to Saturn so Friday has a somewhat more likely chance of a decline. Overall, I would lean towards a bearish outcome this week. Next week (Mar 7-11) is likely to see gains going into midweek on the Mercury-Uranus conjunction but prices are likely to fall after that. Gold may become more vulnerable to declines after that as we approach the Jupiter-Saturn opposition on March 29. I expect a breakdown of rising trendline at $1335-1340 by that time, although it may occur earlier. April looks quite bearish and the down trend could conceivably continue into May. The correction should be quite substantial. Some rebound is likely in June and July but it is very unlikely to recapture $1400.
5-day outlook — bearish-neutral
30-day outlook — bearish
90-day outlook — bearish

