Summary for week of March 21 – 25
Summary for week of March 21 – 25
- Early week gains more likely, esp. Monday, followed by mixed end of the week
- Dollar likely to fall early in the week with possible recovery late in the week
- Crude to stay firm with possible declines later on
- Gold may rise on Monday but moderating after that; Friday could be higher
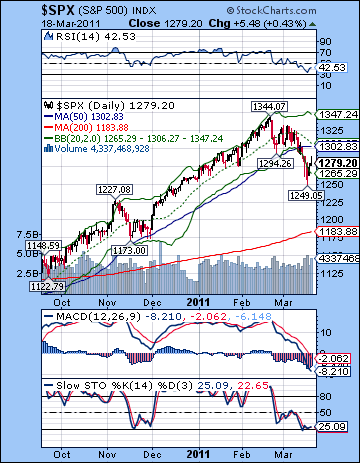 Japan’s nuclear crisis cast a shadow over markets last week on fears that there could be significant manufacturing and supply interruptions in the global economy. The Dow broke decisively below the 12K level and lost almost 2% closing at 11,858 while the S&P500 finished the week at 1279. This bearish outcome was largely expected, although how we got there was quite different from my forecast. I had thought there was a good chance that Monday would be lower on the Mars-Saturn aspect and we did see a moderate pullback. But things went off the rails on Tuesday’s Mercury-Jupiter conjunction. While I was a little unsure about how it would play out, I did think that gains were the more likely outcome since we had two positive planets coming together. I pointed out that the area of ambiguity lay in the fact that this bullish conjunction occurred quite close to the opposition with Saturn. Since the Jupiter-Saturn opposition would likely be acting as a drag on the market during March and perhaps into April, I wasn’t as confident that this nice Mercury-Jupiter combination would produce gains. Well, it didn’t. Instead, it acted as a magnet for all the negative planetary energy last week as we fell right through Wednesday. The bounce arrived on Thursday and continued into Friday, despite the usually gloomy Mercury-Saturn opposition. The whole thing was humbling lesson in probability, if nothing else.
So now we are in the throes of the Jupiter-Saturn opposition due to become exact on March 28. The correction entered a new phase last week as we fell way below the wedge support and tested some early support levels. These two giants of the solar system often do not get along very well and often mark corrective phases and interim lows. Saturn’s pessimism usually wins out over Jupiter’s optimism due to Saturn’s slower velocity and hence, greater power. And things are quite pessimistic right now as a significant portion of Japan’s manufacturing is now off-line and has been effectively removed from global production. The imposition of a no-fly zone over Libya is another area of uncertainty, although it is very unclear just what may emerge from that situation. But the key question is: are we nearing the end of the correction once Jupiter begins to pull away from Saturn on March 29? While I do think it we need to be more cautious about inferring more downside once we move onto the backside of this Jupiter-Saturn opposition, I still believe there is a good case to be more continued weakness and more downside. April still has its share of bearish-looking planetary patterns so it at least increases the chances that any snapback rally will fade quickly. A more bullish view would see a period of consolidation through April somewhere between 1220 and 1260, while the bearish view of significantly lower lows is still a very real possibility. The Mars-Saturn opposition on April 18 is key in this respect as it is not only bearish in its own right, but it also happens to occur in exact square aspect to January’s solar eclipse point. The Japanese earthquake/tsunami/nuclear crisis are arguably linked to this recent eclipse through a similar Uranus transit to the preceding lunar eclipse in December, so we need to be aware that there could be a similar type of situation that could accompany this Mars-Saturn pattern. Of course, it may not necessarily have market implications (e.g. the recent New Zealand earthquake), but it is nonetheless something to be watched carefully.
 Now that the wedge is history, what pattern might the market follow next? Bulls would insist that a we’ve had our correction and reached the bottom at 1249 and rebound rally is already underway as we try to hit the underside of the wedge resistance at 1320-1330 before perhaps moving. This may have a certain appeal, especially since the indicators are suggested we’re very close to being oversold. RSI (42) got as low as 33 before turning higher at the end of the week. That offers a plausible argument that we have reversed and will proceed on our Bernanke-appointed flight path to 1400. Stochastics (25) also touched below the 20 line last week so that similarly increases the appeal of the bullish technical case. MACD is moving fairly deeply below the zero line although it remains in a bearish crossover. A critically important level would likely be the 50 DMA at 1302. This has acted as support in the past and if we have indeed shifted gears towards the bears, then this should now act as resistance. A close above 1302 would therefore be very bullish and would likely signal a move back towards the wedge, somewhere over 1320. But another rally attempt that fails to reclaim the 50 DMA would once again give the bears the momentum. This is what happened in May after the Flash Crash — the market rallied back to the 50 DMA but sold off afterwards. Such a failed rally would likely see the SPX make lower lows, at least to 1220. Below that, a more medium term dividing line would be the rising trend line off the 2010 lows now at 1175. This closely matches the 200 DMA so it should be seen as line that separates the current bull market from a new bear market. A break below 1175 would be quite bad and would increase the possibility that the mid-summer highs we are expecting would be lower than those in February (1344/12,391).
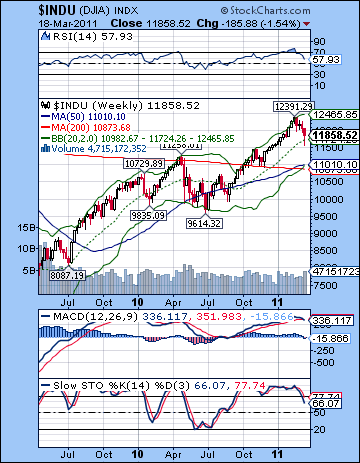
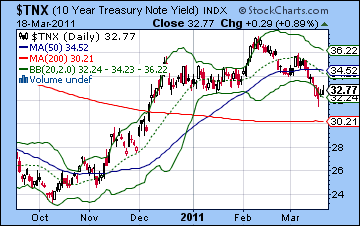
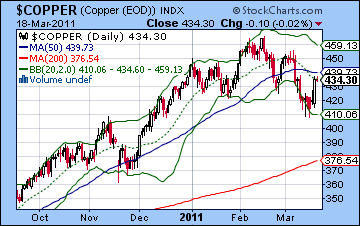
If the daily chart offers the prospect for a bounce, the weekly chart still tilts bearish for the medium term. MACD now shows the beginning of a bearish crossover while both Stochastics and RSI are heading south in a hurry. Last week’s lows may have bounced off some support at the 20 WMA (11,724) so that may give bulls some solace. Alternatively, that 200 WMA at 10,873 still looms large as the most likely destination in the event that we get the next leg down as I expect. But there are some potential anomalies in the bearish case. Treasuries have done well as a safe haven on all the Japan anxiety, but last week saw a decline in yield very close to the rising trend line off the 2010 low and the 200 DMA (3.02%). While we could see lower yields over the next week, one wonders if yields will reverse higher once the 10-year hits 3.10%. But if that is the case, then how can one make the case for a longer and deeper correction in equities? Normally, treasury yields move the same way as stocks. There could be exceptions, but if yields start to rise again, it definitely weakens the case that the correction can continue. If they began to move inversely (yields rising, stocks falling), it may signal a new and dangerous endgame in the financial markets as the unsustainability of the US economy becomes more transparent. I’m not sure we’re quite there yet, but tracking the relationship between bonds and equities will be key. Similarly, copper suggests the bulls aren’t dead yet as it broke above its H&S neckline at 425. The rally in copper and stocks would likely be quite significant if copper manages to break above its 50 DMA at 439. In other words, the technical picture looks quite mixed. If copper breaks above resistance, then it seems likely that stocks will follow suit, at least for the short term. This would suggest a protracted sideways or upwards move in stocks with the possibility of a second bottom forming in late April or early May before moving higher in earnest.
 This week looks likely to begin positively, at least in the early going as the Sun conjoins Uranus on Monday. This is a high probability bullish aspect although I should note that its effects may not last long since it is exact just before the open of trading. Once it begins to separate, it could lose some of its upward thrust so that is something to be aware of. The most likely outcome is a positive day Monday (60/40) although it may only result is a positive opening after which sellers move in. It will be interesting to see how much upside we will see this week since 1302 looms quite large. I would not rule out a run to that level at some point here. Tuesday and Wednesday seem more negative although I should note that the aspect picture is not clear. Nonetheless, the close proximity of the Jupiter-Saturn aspect this week (just 2 degrees now and closing fast) ought to be seen as an underlying bearish bias. We should see at least one down day from the Venus-Ketu aspect this week. The most likely candidates are Wednesday or Thursday. Given last week’s jumble, however, the probability of the market following the timing of this aspect is only a little better than chance maybe 60/40. Friday offers a slightly clearer picture as Mars enters Pisces. This is more likely to be bearish although here again there is a potentially offsetting influence evidence from the approaching Venus conjunction with Neptune. So while the bearish Jupiter-Saturn aspect sits in the background, the short term picture looks quite mixed this week. I would therefore not be surprised by any outcome here. I would tend to favour the bulls, but not by much. A bullish scenario would see a gain Monday and into Tuesday to 1290 or 1300 and then a pullback perhaps Wednesday but basically moving sideways for the rest of the week. We could close around 1280-1295. A more bearish scenario would see Monday’s gain erode by the close and then moving lower to retest last week’s lows by either Wednesday or Friday. I doubt we have enough bear juice to see 1249 again, but it’s not out of the question. Even if Friday ends lower, a more plausible bearish target this week would be 1270-1280. While I am uncertain about much of this week, I’m less inclined to think we will get a lot of downside here.
 Next week (Mar 28-Apr 1) has the potential to be quite bearish indeed as the Jupiter-Saturn aspect is exact on Monday after the close. This aspect is not the kind you can set your watch to so it’s important to think of it as a medium term influence that is weighing down on the market. That said, it can often correlate with declines fairly close to its exact aspect. As an added timer, Mars will aspect Rahu on Monday and Tuesday and this increases the likelihood that 1) these days will be net negative and 2) these days may see a larger move down. Both are high probability outcomes (80/20), especially if the market has not yet fallen sharply in the previous trading days (Mar 24-25). This is a good candidate for at least retesting previous low at 1249 with a reasonable chance that we break below that level. A crash is possible here, but it’s not something I would bet on. Some rebound is likely later in the week. The following week (Apr 4-8) looks like a rebound week as the Sun conjoins Jupiter, although we could see a negative start to the week. After that, the picture gets a little murky. Jupiter is gaining strength as it moves away from Saturn, but Mercury and Mars are set to oppose Saturn April 18-22. I would tend to think this will correspond with another move down. It may only retest the lows of late March or early April, or it will go lower. At this point, I’m still uncertain what is the more likely outcome. The treasury chart looks quite bearish, however, so if stocks do fall, they may fall by quite a bit since both stocks and bonds would be falling together. This is sort of the nightmare scenario for Bernanke. It seems a bit soon for this abandonment of all US assets, but it is possible. The Dollar seems flat on its back here but if and when it comes back from the dead, it will be another factor that will weigh on stocks.
5-day outlook — neutral-bullish? SPX 1280-1290
30-day outlook — bearish SPX 1200-1250
90-day outlook — bearish-neutral SPX 1200-1250
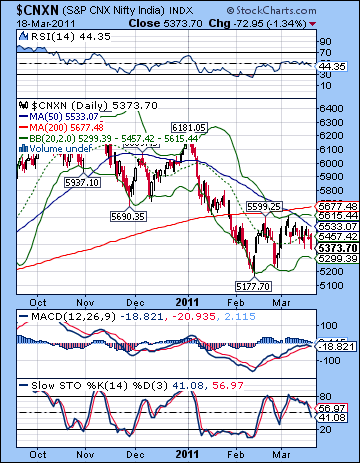 Stocks slumped again last week as the RBI raised interest rates and the Japanese nuclear crisis threatened to spiral out of control. Despite some early week gains, the Sensex lost more than 1% closing at 17,878 while the Nifty finished at 5373. This ultimately bearish outcome was in keeping with expectations, although the week unfolded a little differently than anticipated. I had expected more immediate downside on Monday’s Mars-Saturn aspect but what we got instead was a surprisingly strong up day followed by an equally convincing sell-off on Tuesday. As expected, the bulls were running again on Wednesday’s Mercury-Jupiter conjunction which took prices higher, although they did not match Monday’s high. This set up the end of the week decline that also conformed with the forecast bearishness on the Mercury-Saturn aspect. I had thought there was a reasonable chance we would see the 5400 support broken at some point, and it did so on Friday.
The ongoing nuclear crisis in Japan is yet another reminder of the power of the planets and how the current period suffers from significant planetary afflictions. For many weeks now, I have noted that the upcoming Jupiter-Saturn opposition on 29 March is an important aspect that would likely cast a pall over the market. These two giants of the solar system symbolize opposing poles of energy — positive/negative, good/evil and light/dark. Their current encounter in the sky is a time when these opposite forces clash and can cause disturbance both on a psychological level in the form of negative market sentiment and on a real event level such as what we have seen in Japan. The pessimism of Saturn usually triumphs in its battles with Jupiter because it is more distant and moves at a slower velocity and hence is more powerful. In market terms, this means that rallies will tend to be short-lived and declines may be larger than expected as long as this aspect is close to exact, say until early April at least. Of course, the recent wave of shocking and disruptive events around the world is not all the result of the Jupiter-Saturn aspect. The eclipses of December and January also played a key role as both contained serious afflictions which have become manifest in recent weeks. It is quite possible that we could see more fallout from these eclipses in the weeks ahead. Mars will oppose Saturn on 18 April and this will set up in a near-exact angle with January’s solar eclipse point at 19 degrees of Sagittarius. The presence of this potential Mars-Saturn contact to the eclipse point is another important reason why the markets will likely continue to have a bearish bias. Even if another rally is attempted before this mid-April aspect, it is unlikely to be sustainable.
 From a technical perspective, it was a difficult week. Not only was the 5400 support level broken, but the upside was easily contained by the 50 DMA (5533). Failure to break above this line for the second week in a row was a significant victory for the bears. Indeed, the picture is made worse by the fact that the 20 DMA is now close to ‘testing’ resistance of the 50 DMA just as it did in January. The last time this happened, stocks fall sharply in a correction that lasted for a whole month. If the Nifty cannot break above the 20 DMA (5457) and the 20 DMA remains below the 50 DMA, it may invite a similar rapid sell-off. Although MACD is already well below the zero line, it is on the verge of another bearish crossover. Stochastics (41) are falling back towards the 20 line and RSI (44) shows signs of already topping out in the near term. While the bullish double bottom is still in play, the inability to push above the 50 DMA definitely weakens its influence. A close below 5200 would naturally be very bearish and herald a new move down, presumably to 4800. As long as the Nifty trades below its 20 and 50 DMA, there is very little compelling case for the bulls. Even then, it would require a close above its 200 DMA at 5677 for a more convincing case for further upside.
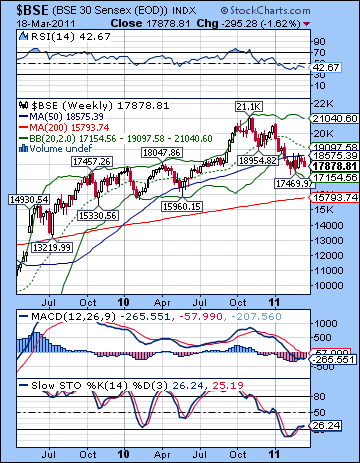
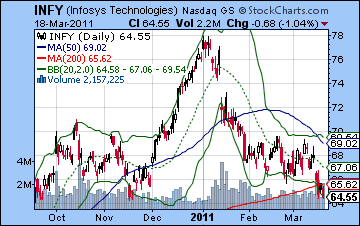
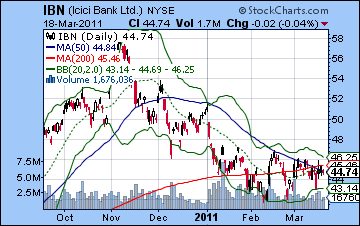
The weekly Sensex chart shows both the promise and the pitfalls of the current situation. The bulls can argue that as long as the rising trend line dating back to August 2009 (14,684) remains intact, then the rally is intact. Despite last week’s loss, the Sensex still trades above this line, now around 17,500. We can also see a succession of higher lows dating back to 2009 which should give long term bullish investors some comfort. But if this line is broken, then prices could fall quite rapidly all the way down to the 200 WMA (15,793) and perhaps even lower. For their part, the bears can show that the Sensex has been unable to break above the 50 WMA (18,575) and therefore may eventually fade back down to the 200 WMA. Both sides have good evidence for their cases, although I would tend to favour the power of the trend line here over a moving average. But the indicators still favour the bears as MACD is below the zero line and in a bearish crossover. Stochastics (26) appears to have bounced off the 20 line so that is mildly bullish, but RSI (42) may not be finished with its bottoming process. The bulls need to take the BSE above 50 WMA before they have any hope of changing the fundamental dynamic of the market. Indian stocks have suffered due to the recent weakness of the US Dollar, and none more so that Infosystems (INFY). Outsourcers and exporters are feeling the pinch here, as INFY is in a clearly bearish head and shoulders pattern. To make matters worse, it has failed to rally above its 50 and now sits perilously clinging to its 200 DMA. This is an extremely bearish set up that seems likely to go much lower. ICICI Bank (IBN) is in better shape, but even here it has yet to close above its 200 DMA. It’s in the neighbourhood but it’s mostly in a sideways move here. Perhaps its consolidating for a breakout higher, but until it does, it is not that attractive for long positions.
 This week looks to have a more bullish bias, although much of it may occur early in the week. Monday begins with a positive Sun-Uranus conjunction. Uranus is a risk-seeking planet so this combination may well correlate with aggressive buying. The bullish sentiment may continue into Tuesday although I expect there to be some moderating along the way as we head into midweek. As we go deeper into the week, I would expect a greater probability of down days, as Venus is aspected by Ketu on Thursday and Friday. While I don’t expect any sizable down days here, I think we should see at least one, possibly two. Overall, we could well finish higher but it’s certainly not clear. A more bullish scenario would see gains Monday and Tuesday to perhaps 5500 and then sliding back down towards current levels or a little above. I wouldn’t rule out the all-important resistance level of 5600 either, but that seems like a stretch. A more bearish unfolding would see less early week upside perhaps only to 5450 and then sideways and then lower into Friday around 5300-5400. I do acknowledge that some of the intraweek moves are harder to call here as some of the key patterns are not high probability ones. Venus-Ketu tends to be bearish, but it can sometimes surprise on the upside also. And yet since we’re still so close to the Jupiter-Saturn aspect, any up moves will take place against the drag of this bearish pairing. If the week is a little uncertain, it does seem less likely that we will see a large move in either direction here.
 Next week (Mar 28-Apr1) may well begin with a bang. Jupiter will oppose Saturn in the early morning hours of Tuesday, 29 March, while Mars is in a close aspect with Rahu. This is a fairly unusual simultaneous occurrence of two bad aspects. For this reason, there is a fairly high probability of a down move early in the week here. Since there are two aspects at work, there is also the chance that this move could be large. While nothing is certain in astrology, this early week period could well break support again and we could see the previous lows of 5200 tested. The late week period has the possibility of a strong rebound as Mercury turns retrograde. The following week (Apr 4-8) begins on a close Sun-Jupiter-Saturn alignment which also has the potential for significant downside. A quick reversal is possible here so I would not be surprised to see stocks bounce sharply. April would seem to be more bearish at least until the week of April 18-22 is out of the way. The Mars-Saturn opposition could be another nasty aspect that has the potential to take stocks significantly lower. Even if the Nifty has bounced before this date, this aspect will likely depress prices. Some kind of sustainable rally is likely to begin in late April and into early May as Saturn recedes from view. This rally should have enough power to run into June and July but the highs will likely be below the all-time high. In fact, I tend to think that we could be well off the high of 6350 although we shall see. Then another corrective phase is likely to begin in August and continue into September. Lower lows are quite possible in the second half of 2011.
5-day outlook — neutral-bullish NIFTY 5400-5500
30-day outlook — bearish NIFTY 5000-5300
90-day outlook — bearish-neutral NIFTY 5200-5600
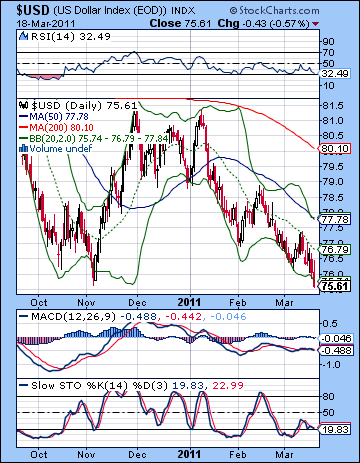 The Dollar broke through major support last week closing below 76 and appears to be in trouble here. The Euro jumped over the 1.40 barrier and finished near 1.42 while the Rupee appreciated towards 45. Despite all the problems in the world, the Dollar is not acting as much a safe haven. But US Treasuries are, and that is perhaps another variant of the story. Mostly, the US is reaping what it has sown as government deficits continue to rise without any plausible way of getting them under control. As is the case with most indebted countries throughout history, the US seems intent on devaluing its currency in order to reduce its debt burden. While the slump in the Dollar makes sense on a fundamental level, I had expected more upside from the Dollar in March. Thus far it has shown no ability to break out of its downward slide. And now it has broken its trend line support going back to 2007. While this is an important technical move, the Dollar will have to breach previous lows of 75.5 for the trend to continue to the downside. After that, the previous low of 74.5 beckons. And if that falls by the wayside, then 2008 low from 71 would be the point of no return for the greenback. A break there and Bernanke would be inviting a plunge into uncharted waters. While I don’t think such a plunge is imminent in the coming weeks, it is a scenario that could occur in over the next few years. Meanwhile, the situation at the moment while dire, offers some technical evidence for a bounce. RSI (32) is close to a bottom here but it is not out of the question that it could fall a little more before the 30 line is hit. That would increase the appeal of long positions considerably. MACD is back in a bearish crossover while Stochastics (19) are again visiting the Hotel Oversold. Certainly such a low level sets up the possibility for a breakout higher but these oversold situations can go on for a while.
The medium term indications continue to look quite bullish for the Dollar although whether the rally begins in earnest this week is unclear. The early week Sun-Uranus conjunction looks likely to boost risk appetite which may depress the Dollar further. The rest of the week is harder to call although the odds of a bounce would be somewhat higher. Next week looks like a better set up as the Mars-Rahu and Jupiter-Saturn aspects are likely to shake things up. Admittedly, the Dollar has fallen in tandem with stocks lately, but there is some reason to expect the Dollar could get a jolt of energy. But I would not expect the rally to really get going until early April, however, and the triple conjunction of Sun-Mercury-Jupiter. The second half of April and most of May look favourable to the Dollar so I would expect some kind of significant rally to occur then. But if it keeps falling lower before it reverses, then this may lower the upside target somewhat. I’m unsure if the Dollar will reverse around 74.5 but I would favour that as a bottom over, say, 71. If it does reverse at 74-75, then 80 seems very likely by the end of May with previous highs of 81.5 an obvious testing area.
Dollar
5-day outlook — bearish-neutral
30-day outlook — bullish
90-day outlook — bullish
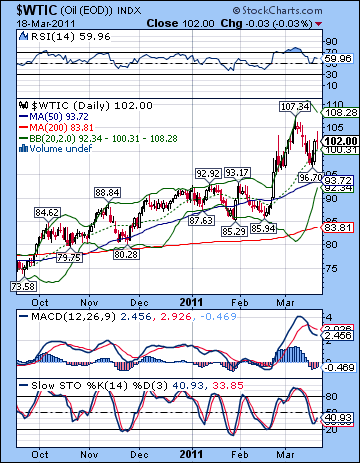 After trading below $100 early in the week, crude resumed its recent bull run after news that the US-led no-fly zone over Libya had been passed in the U.N. So after previously looking like things might return to normal under bloodied but intact Gaddafi, the prospect of a protracted conflict is again very much in the cards and crude closed mostly unchanged on the week near $102. Since I had expected prices to remain over $100 here, this outcome was not too surprising, although I thought we might have seen more early week upside. As it happened, Monday was only slightly higher before Tuesday’s significant sell-off on the Japan scare. Also I thought we might see more downward momentum towards the end of the week but that was not the case as prices rebounded into Friday. Technically, crude is still very bullish as it tested support on the rising top trend line at $97 and then bounced back over $100. This was an indication that crude isn’t quite ready to give up its current levels. The current upward move will only be in trouble if it can close below $97. Until that time, it may continue to test resistance, first at $105, then perhaps moving to $110. The indicators continue to offer only limited insight as the recent price spike has interrupted previous trends and patterns.
This week may see crude make another rally attempt with Monday perhaps being the most reliable up day on the Sun-Uranus conjunction. I would not be surprised to see $105 or higher on Monday and perhaps continuing into Tuesday. I would also note rule out higher prices in the short term. We could see some midweek pullback although this is unlikely to break below $100. The end of the week is harder to call with a mixture of bullish and bearish influences. I would lean towards a bullish outcome here as Venus is approaching Neptune on the weekend. While it will not yet be exact on Friday, it will be very close. Next week (Mar 28-Apr 1) looks quite volatile with some downside likely early in the week on the Mars-Rahu aspect. It could be a fairly large move although it is unclear if crude will break below $100. Early April may well be last hurrah for crude at these levels as Jupiter moves past Saturn. It is conceivable that it may hang on to $97 until mid-April but the momentum would seem to be on the wane. The mid-April Mars-Saturn aspect could be significant in this regard as it is likely to send crude significantly lower. This may well be the break down in the recent bullish trend and a return to more normal price range. May looks mostly bearish for crude so it may dip to the bottom of that range at that time. Some recovery is likely in June, but July and August look bearish again and the down trend could continue into September.
5-day outlook — neutral-bullish
30-day outlook — bearish-neutral
90-day outlook — bearish
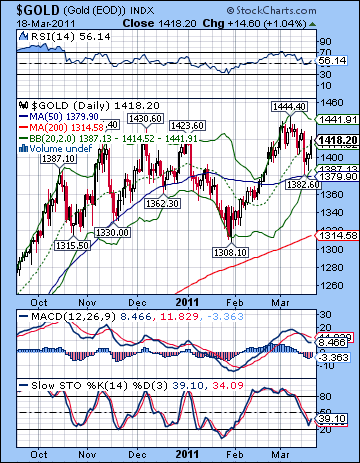 Although it may have lost its safe haven status lately, gold did manage to ride the wave of Dollar dumping late last week to close mostly unchanged near $1418. Like most other asset classes, gold got sideswiped by the Japan nuclear crisis where its vulnerabilities where revealed to all who cared to see. This is not something people buy when they’re scared; it only seems to be operating as a currency hedge against the falling Dollar. I had been fairly ambivalent last week so this outcome was not wildly unexpected, although the extent of Tuesday’s down draft was surprising. Prices soon recovered on the heels of the Mercury-Jupiter conjunction, so I was a little off the mark there. I was also incorrect in my expectation that the late week Mercury-Saturn aspect might coincide with lower prices. Gold’s inability to make any more headway was perhaps a sign of fatigue in the bull camp, although I would note that it bounced off the 50 DMA ($1379) quite smartly on Tuesday. So the bulls seem very much in control, although they may not be exactly gleeful. Friday’s close was above the 20 DMA although MACD remains in a bearish crossover. RSI (56) moved higher last week but it has the appearance of a technical bounce as it may be bumping along lower here. Stochastics (39) may have temporarily bottomed and are pointing up, a possible sign of some short term bullishness. Resistance here is the previous high at $1444 and after that around $1500. Support would again be at the 50 DMA ($1380). A break below this line could signal a test of the previous low of $1308. Based on my astro analysis, this is quite possible by late April or May.
This week could well see the bulls running in the early going as Monday’s Sun-Uranus conjunction could enhance bullion’s appeal. While this may take it back up to $1430, it seems unlikely to stay there and it is quite possible that it could make the high Monday morning and fade by the close. Some pullback is more probable going into midweek and the Venus-Ketu aspect so that could test the $1400 level again. The late week period appears to tilt towards the bulls again, especially in Friday’s session so we may well end up at or even above current levels. Gold is getting pretty close to an inflection point here as my medium term influences are waiting in the wings. April and May would seem to call for a significant correction but it is unclear exactly when that correction will begin in earnest. One possibility is next week and the Mars-Rahu aspect on Monday and Tuesday. While there is a good chance for a decline it may not be enough to break the trend decisively. We shall see. The Sun-Jupiter conjunction on April 5 may figure prominently in the ultimate failure of the gold rally. It could be the high, or more likely, it may emerge as the an interim lower high, perhaps around $1400. I am expecting gold to take a beating in May so we will likely test that $1308 low and perhaps lower. The period around May 16-20 looks particularly bearish.
5-day outlook — neutral
30-day outlook — bearish-neutral
90-day outlook — bearish

