

Summary for week of April 4 – 8
- Stocks vulnerable to selling pressure early in the week; some recovery likely midweek
- Dollar may rise early in week; rally seems likely in weeks ahead
- Crude could fall early in week but recover later
- Gold may decline this week; correction looms in coming weeks
The bulls were out in force again last week as improving employment numbers provided the justification to push up prices. After bouncing off support early on Tuesday, the Dow climbed more than 1% last week closing at 12,376 while the S&P500 finished at 1332. Well, my hopes for a down week were dashed as the full force of the early week Mars-Ketu aspect didn’t amount to much downside at all. We did get a test of 1300 on Tuesday as expected, but bulls came in and dutifully bought the dip as they so often do at the 50 DMA and sent the SPX back above 1330. The other misfire was the lack of any decline on Friday which I had thought might provide a little more selling pressure on the Mars-Neptune aspect. We did see some upside around Wednesday’s Moon-Venus conjunction and, as expected, it did not extend into Thursday. So a pretty disappointing week, although I have to admit I was not shocked that a big drop failed to materialize.
What seems to be happening is that the markets are rallying despite the Jupiter-Saturn opposition as other planets form temporary alignments. The Sun’s proximity to Jupiter is one possible source of bullish sentiment, since it is a well-known positive influence on sentiment. I did not expect it to manifest so strongly here as stocks now approach their Feb 18 high. The first quarter has now ended on a positive note as stocks have put up impressive gains despite all the problems in the world and the effect of the putatively bearish Jupiter-Saturn and Rahu-Uranus aspects. I had been quite bearish for Q1 so I have to admit defeat on this score. While we did get the expected correction in Q1, it has so far not lived up to my expectations as stocks have only pulled back a measly 7%. While we are still in the shadow of the Feb 18 peak at 1345, only a sharp reversal this week will keep that top intact for any time to come. Such an abrupt reversal is still possible even in this Bernankean world of bottomless pockets. So what lies ahead in Q2? As the date of the expiration of the Fed’s bond buybacks nears at the end of June, there is good reason to believe the market will be increasingly reluctant to trend higher unless there is an announcement of QE3 somewhere along the way. If there is no QE3 forthcoming, some investors may get jittery the closer we get to June 30 and will look for reasons to get out and lock in any gains. For this reason alone, the prospects for the second quarter would seem mixed at best with relatively modest upside potential. From a fundamental perspective, then, there are less compelling reasons to go long or even be long. And if the Dollar and treasuries continue strengthen as they have lately, there will be even less reason to be in stocks. Astrologically, April features some noteworthy bearish aspects, although most of them will be fairly short-lived. For this reason, April may be mixed, although I would retain a bearish bias.
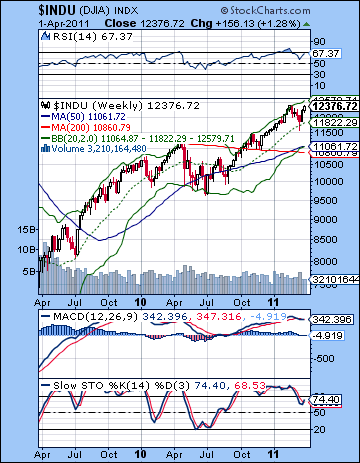 The bulls must be well pleased with their efforts last week as the 50 DMA at 1305 was well defended in the early going. This will now become a significant level of support in the event of any move lower. Below that, the rising channel comes in around 1270-1280 this week so that may also bring in some buyers. A breach of this rising channel would be very bearish here and would convince many bulls that something big was changing. Until this channel breaks, however, bulls will likely continue to buy the dips. The SPX is reaching for its top Bollinger Band here at 1342, which also happens to be very close to the February high. Obviously, this will be a key resistance level. However, we can also note that the current level of 1332 is almost exactly in line with a falling trend line dating back to the 2007 high. This line goes through the February high. A close above this line would weaken the case of the bears — if it isn’t already sufficiently weakened — as it would add credibility to the notion that we are not in a bull rally in the bear market, but rather a bonafide bull market.
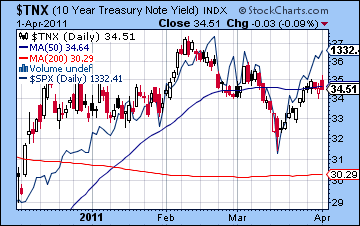
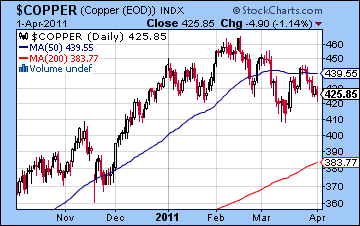
The indicators would seem to favour the bulls here as RSI (60) still has a ways to go before it becomes overbought. MACD has climbed over the zero line and retains its bullish crossover. Stochastics (94) are overbought, but this does not hold as much weight as the other two. The weekly Dow chart shows that the RSI (67) is again verging on overbought status, although hard core bulls may wish to hang on for the final push to the 70 line. The Dow actually has equaled its February high, so a close significantly higher than 12,400 would be quite bullish in the short term. A failure to move higher, however, would increase the perception that the market has formed a bearish double top pattern. So we are at something of an inflection point. As the chart of the 10-year treasury shows, there is a divergence between stocks and yields as last week saw yields move lower despite the extension of the rally. As long as it continues to hug the 50 DMA at 3.50% and cannot move above it, this would seemingly increase the likelihood of some kind of move lower in equities. While the Dollar stumbled lower last week, I am still anticipating more upside for the greenback which would further weaken the appeal of stocks. Another significant bearish divergence is evident in copper which also didn’t follow stocks higher last week. Copper is holding steady in a range between the 50 DMA at 439 and the recent lows of 420. But a breakdown below 420 would be even more bearish for stocks.
 This week offers up another manifestation of the Jupiter-Saturn opposition as the Sun will oppose Saturn on Monday and conjoin Jupiter on Wednesday. While Sun-Jupiter conjunctions are usually bullish affairs, the presence of a Sun-Saturn opposition early in the week increases the likelihood of some kind of decline. The early week period has the added burden of a Mars-Uranus conjunction (exact on Sunday) which may serve to amplify energy available for the market. Trading volumes on Monday may well be higher than they have been of late as the Mars influence here often correlates with a sense of urgency. I will admit that the aspects this week are quite clustered and therefore they may not come off as expected. So while the early week does seem to be the most likely time for declines, it is conceivable that the market will rise into Wednesday and then fall thereafter. In both cases, Wednesday could well be the turning point. I would favour a bearish outcome overall here, with a sizable (>2%) decline somewhat more likely than it otherwise would be. If the early week decline scenario occurs, then it’s possible we could retest support at 1310 and the 50 DMA. That would perhaps make everybody happy as bears could feel like they have some hope for a lower market as we enter a new quarter while bulls can protect their recent gains. Perhaps the most likely scenario is that we finish somewhere between 1305 and 1332.
 Next week (Apr 11-15) may begin with a significant gain as Mercury conjoins Jupiter. The Mars-Pluto may be a somewhat offsetting influence, but if stocks move lower as expected beforehand, then this gain may attempt to recapture previous highs of 1332. The second half of the week could well be lower as the Sun is aspected by Rahu. Perhaps we will remain somewhere in the current range between 1300 and 1335, although I would tend to think we will be closer to the bottom half of that range. The following week (April 18-22) features a very volatile looking trinity of Mercury, Mars and Saturn. These definitely have some downside potential especially in the first half of the week. The late week looks more bullish as Venus conjoins Uranus so we could well end up going sideways. The late April period looks mixed as Mercury returns to direct motion while in opposition to Saturn but is then followed up by a bullish Venus-Pluto square. I would lean towards a bearish outcome for April overall, although that is definitely not as clear as I would like. May is likely to begin negatively as Jupiter aspects Rahu (North Lunar Node). The first week or two could be very bearish given the added weight of the Mars conjunction with Jupiter. We may put in a meaningful low sometime in May and it may well be lower than anything we see in April. June looks like a month of recovery, with the second half looking more positive on the Jupiter-Pluto aspect.
5-day outlook — bearish SPX 1300-1330
30-day outlook — bearish SPX 1250-1300
90-day outlook — bearish SPX 1250-1350
 Stocks extended their March rebound rally last week as FII came rushing in to scoop up relatively under priced equities. Posting gains on four out of five sessions, the Sensex rose by 3% closing at 19,420 while the Nifty finished the week at 5826. Needless to say, this rise was a big disappointment as I had expected more early week downside on the Mars-Ketu aspect and the Jupiter-Saturn opposition. While I admitted being somewhat less certain about the decline that I would have liked, the relentless bullish push into Friday inflicted some serious damage to the bearish case. One possible source of error was the very unpredictability of Ketu. Although it is a malefic planet by nature, its associations with other planets are somewhat less reliable than say, Mars or Saturn. The second half of the week was also generally bullish although I had expected mostly positive sentiment in the wake of Mercury turning retrograde and the Moon-Venus conjunction on Wednesday and Thursday. As expected, Friday was more bearish on the Mars-Neptune aspect, although the decline was negligible.
The extent of this March rally has been quite surprising given the apparent strength of the Jupiter-Saturn opposition. This is usually a bearish influence but the market bottomed a full month in advance of its exact aspect last week. As I have noted previously, aspects between slow moving planets such as Jupiter and Saturn can sometimes act as background influences and may not manifest when they form their closest angle. As one of the major aspect influences in the past quarter, it is not surprising that stocks have fallen since the beginning of January, even if they have partially recovered lately. But what lies ahead for April and Q2? April will still likely see the continued influence of the bearish Jupiter-Saturn aspect, although its effects may not be felt at all times. We will see a number of fast moving planets act as potential triggers for this aspect through the month so there are several opportunities for significant down days. Some gains are also likely but the bearish aspects appear to outnumber the bullish ones here. The rest of Q2 (May, June) looks more mixed. May looks more bearish as the next major aspect involves Rahu and Jupiter. This is another bearish pairing as the distorting effects of Rahu tend to undermine the optimism of Jupiter. At the same time, it is a somewhat less reliably negative influence than aspects involving Saturn, so the probability of further downside is lessened. June seems mixed as the first half of the month looks less positive while gains are more likely in the second half as Jupiter approaches its aspect with Pluto. Overall, Q2 looks choppy at best, but I would think there are still significant downside risks so that we could well finish below current levels by 30 June. And I still think that there is a good chance we will test 4800 on the Nifty at some point in Q2. The least likely scenario would be significant higher prices above Nifty 6000.
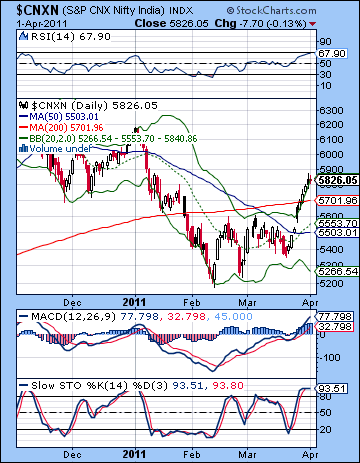
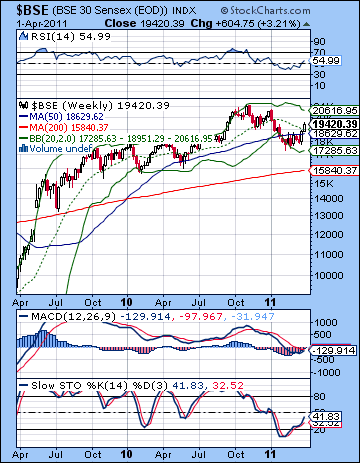 The bulls took control with a vengeance last week as the key indices crossed above the 200 DMA. This is the proverbial ‘line in the sand’ between bulls and bears so now that the Nifty is above it, bulls will have to defend 5699 in order to keep the ball in their court. Good luck to them because they are going to need it. The RSI (68) is getting very close to the overbought area and this makes long positions less enticing. More bullishly perhaps, MACD is still in a bullish crossover and now exceeds the level of the previous high in January. This creates a positive divergence which increases the likelihood of higher prices in the medium term. Stochastics (94) are overbought and would tend to dissuade new buyers into the market. But while the bulls have undertaken an impressive run higher above key resistance levels, there remains one last level: the falling trendline off the November and January highs. This currently comes in around 6000 and may well be the last line of defense for the bears. Any close above this line and the bulls could realistically insist that the correction is over and the rally is back on for real. Until the Nifty gets there, however, this will remain a technical bounce within a larger correction.
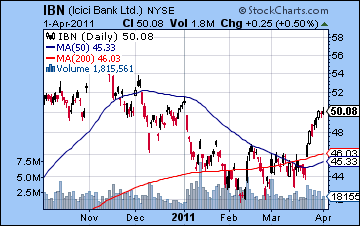
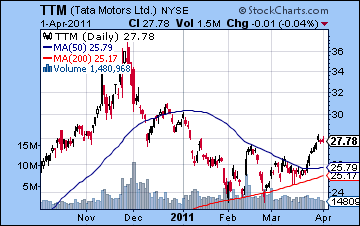
The weekly BSE chart continues to show signs of life as it closed above the 20 WMA. Even more bullish was the prospect of a bullish crossover on the MACD. This would definitely be an achievement that might point to higher prices in the medium term. It has yet to cross above the zero line, however. Stochastics (41) are on the rise here as is RSI (54) which would have to hit the 60 level in order to create a positive divergence with the previous peak. It is quite a way from that still. The falling trend line is now at 20K and may be seen as a potential target for this rebound rally. We’re only 2-3% from that point, so it is quite possible it will be tested in the days or weeks to come. Support on this chart is now provided by the 50 WMA at 18,629 while the 200 DMA offers long term support at 15,840. As always, the gap from May 2009 remains a lingering Achilles’ heel in the chart that may or may not be filled in the months or years to come. ICICI Bank (IBN) rallied strongly last week but has yet to recover its January high. Certainly the bulls can take heart from the clear break above the 200 DMA. But to give the rally more force, they will have to push prices above the previous high of 51 otherwise the chart will show a bearish pattern of a series of lower highs. Tata Motors (TTM) has fared less well in this relief rally. It has climbed above its 50 and 200 DMA but also needs to move above its January peak to give the rally legs. Volume has also been fairly indifferent.
 This week appears to tilt to the bears, although there will likely be some upward moves in the mix somewhere. The Sun may act as a triggering planet for the Jupiter-Saturn aspect here and thereby release some of that bearish energy. The early week shapes up as somewhat more likely to be bearish as the Sun opposes Saturn on Monday. Monday has the added distinction of a Mars-Uranus conjunction that could amplify the mood of the market. Mars and Uranus are an explosive combination that can channel huge amounts of energy. While not all of it will be relevant to the market, there is nonetheless an a chance that sentiment could suffer due to some sudden exogenous event. There is therefore an increased likelihood for a larger decline here. Some recovery is likely around the time of the Sun-Jupiter conjunction on Wednesday. Generally, the second half of the week looks more bullish, although we could still get a negative day tossed in. Thursday’s Venus-Saturn aspect is perhaps the most likely culprit in that regard. Admittedly, the clustering of planets and aspects this week makes its specifics somewhat harder to call. The approach of the Sun-Jupiter conjunction is usually bullish but here may be harmed by Saturn’s aspect. So I would not rule out any scenario here, although the early week negativity appears to outweigh the positive. So the more probable scenario would see a decline Monday and perhaps into Tuesday that takes the Nifty back down towards 5600 and the support from the 200 DMA. The midweek may spark a reversal and we could finish up somewhere between 5600 and 5800. A less likely scenario would be that we run up towards 5900 and the area of the falling trend line in the early going this week and then fall back to current levels. While this seems like a technically neater unfolding, I am less likely to think it will happen in that way.
 Next week (Apr 11-15) looks more positive, especially due to a likely bullish Monday on the Mercury-Jupiter conjunction. Some of the optimism may peter out by Friday but there is still a reasonable chance for a winning week. It is therefore possible that we could hit that falling trend line here, depending of course on how much of a tumble that might precede it. The following week (Apr 18 -22) offers another chance for the market to rally up to the trend line, although the planets would suggest that it is less likely to do so. Apr 18-19 feature a very tense Mercury-Mars-Saturn alignment that could correspond with a significant decline. Again, some upside is likely towards the end of the week, but it may not be enough to erase the damage done by this previous alignment. After that, the market looks more vulnerable as the final week of April begins with Mercury returning to direct motion while under a heavy affliction of Saturn. The swoon in stocks should extend into early May and the Jupiter-Rahu aspect. We may get a potentially significant low around May 10-12 as Mercury, Venus and Jupiter all conjoin while aspected by Rahu. The second half of May could see some consolidation that lasts into June. While a rally may begin during this period , a more reliable upturn is likely after mid-June when Jupiter aspects Pluto. July also looks bullish, although it seems fairly unlikely that any rally here could approach 6000.
5-day outlook — bearish NIFTY 5600-5800
30-day outlook — bearish NIFTY 5200-5400
90-day outlook — bearish NIFTY 5400-5800
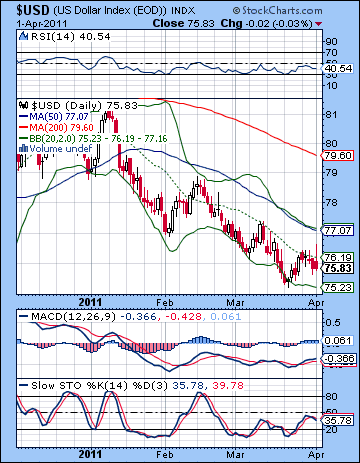 The Dollar returned to its woeful ways last week closing below 76 as the Eurozone debt problem was temporarily upstaged by higher than expected inflation figures in Europe. The Euro ended the week at 1.423 while the Rupee continued to rise finishing at 44.44. Two steps forward, one step back. I thought the Dollar was on firmer footing with the Mars-Ketu aspect but it actually only treaded water early in the week. As expected, it showed more weakness later and so it fell back below 76 and may be in the process of testing its previous low at 75.5 The 20 DMA acted as strong resistance as Tuesday failed to punch above that level. Similarly, the falling channel continues to act as strong resistance. But Friday’s action was intriguing because of an intraday spike that was well above the falling channel line. A sign of things to come? Dollar bulls will have their hands full keeping it from falling below 75.5 in the coming days. MACD is still in the narrowest of bullish crossovers, while RSI (40) stubbornly hangs on to its modest gains since the double bottom. There is no doubt the Dollar is in trouble here as it has fallen below its rising trend line support from 2007. Bears contend that it may only be able to rise back up to the trend line before heading down in the much-anticipated death spiral to 70 and below. While one sees the logic to the argument, it assumes that trend lines are more powerful than horizontal support lines. This is hard to know with any certainty as each instance is unique.
This week offers a good chance for some upside especially around the early and middle part of the week. The Sun-Jupiter conjunction on Wednesday forms a nice angle with the ascendant in the USDX chart so that increases the likelihood of gains. There is also the possibility that these gains will be substantial. The late week period looks less impressive so we could see some retracement. Perhaps the Dollar will rise back to Friday’s intraday level at 76.5 (1.40). It could even conceivably go beyond that level. It seems likely that the previous week’s high will be challenged and we should finish higher overall. Next week (Apr 11-15) looks more bearish so consolidation may be the order of the day, perhaps around 75.5-76.5. The second half of April looks more bullish as the series of tense aspects involving Saturn are more likely to enhance the Dollar’s appeal. A breakout of the falling channel seems very likely at this time, if not before. Then early May will see further gains on the Jupiter-Rahu aspect.
Dollar
5-day outlook — bullish
30-day outlook — bullish
90-day outlook — bullish
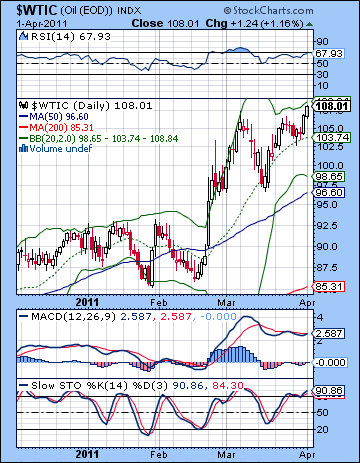 Crude oil extended its recent rise as improving demand prospects conspired with Middle East instability. After bottoming out Tuesday at $102.50 intraday, crude finished the week above $108 on the continuous contract for West Texas Intermediate. Despite my bearish expectations, crude continued to make the most of positive aspects while minimizing the damage from the negative ones. The early week was bearish as expected, although we only saw a modest decline into Tuesday. The rest of the week was mostly bullish as the Moon-Venus conjunction fueled higher prices. While I had expected some rise here, the extend of it was a little surprising. So the previous resistance level of $105 was broken to the upside and we seem destined for $110 at least. The bulls are still firmly in control of this market as the test of the 20 DMA early in the week was followed by strong buying. RSI (68) is close to being overbought which may give some bulls concern about committing new money for long positions. However, this market gyrates so wildly that such logic may have limited application. As further evidence of the bullishness of crude, we only have to look at how the RSI pivoted exactly at the 50 level on March 16 at the low. Stochastics (91) are again overbought so that may reduce the appeal for new positions somewhat, but it is not sufficient technical grounds for expecting a reversal. Support is now likely around the $104-105 level and below that the $97 level and the rising channel would likely figure prominently in any future retracement. The 50 DMA is now approaching that level at 96 so that adds to its importance.
This week should see some pullback early in the week on the Sun-Jupiter-Saturn alignment. How low we go will be an important measure of the rally. If it only retraces to $105, then we could stay at or above current levels for another two weeks. If it manages to fall back to $100, then that might introduce some cracks in the bulls enthusiasm. I would expect gains may be more likely later on in the week although I suspect we may not return to current levels. Perhaps we will finish around $105. Next week (Apr 11-15) tilts more bearishly as Mercury approaches its opposition aspect with Saturn. Early week gains are more likely here but sentiment may turn south by week’s end. The second half of April looks more bearish again as Mars aspects Saturn so there is a chance for a significant decline at this time. Some gains are likely around the Jupiter-Mars conjunction in the final days of April but the downtrend will likely resume for the first two weeks of May, but more so in the second week. Some gains are likely to resume for the third week, but the last week of May looks quite bearish again. Just where a meaningful low point may occur is difficult to say, although May is looking more likely in that regard.
5-day outlook — bearish-neutral
30-day outlook — bearish
90-day outlook — bearish
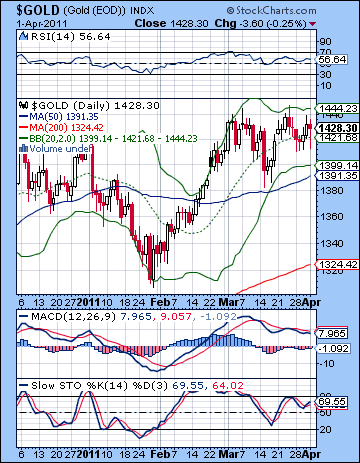 After a fairly choppy week, gold was mostly unchanged settling just under $1430. The week unfolded largely as expected although the early week down move was quite mild. The midweek recovery coincided nicely with the Moon-Venus conjunction and Friday’s mostly bearish session also appeared to correspond with the Mars-Neptune aspect. Gold’s only source of strength recently has been weakness in the US Dollar. The Eurozone inflation numbers provided the late week boost, but it is hardly in a strong upward move. Any recovery in the Dollar will therefore knock the stuffing out of gold. Last week was the third time that gold traded above $1440 intraday but failed to close above that level. While it’s not exactly bearish, it does suggest some significant resistance there. The 20 DMA ($1421) is offering some support here as any intraday pierces below that level are quickly bought. The rising channel off the 2009 low remains the critical medium term support level. This now stands at around $1375. This is firm support that has been tested several times over the past two years so it is unlikely to break at the first opportunity. In the event of the eventual correction, gold may test the channel and rebound higher and then perhaps break through after a second attempt. RSI (56) is looking quite wishy-washy as we see a series of declining peaks which often signifies a loss of momentum ahead of a reversal. MACD is also looking quite tepid here as it remains in a bearish crossover and its tilting south. Overall, the technicals on gold don’t look very strong in the short run so that would tend to increase the likelihood of some kind of correction here. Just how large it will be is the open question.
This week will see the Sun — the planetary signifier for gold — buffeted between bearish Saturn and bullish Jupiter. With both planets in play here, there is a greater chance for larger moves in both direction. The early week looks more bearish as the Sun opposes Saturn on Monday. I would not be surprised to see a large decline back to perhaps $1400-1410 on Monday and into Tuesday. We should see some reversal around midweek on the Sun-Jupiter conjunction although I suspect it may not quite bring it back to current levels. The late week period seems more bearish again as Thursday’s Venus-Saturn aspect may produce some selling. Next week looks more positive on the Mercury-Jupiter conjunction on Monday but the second half of April may see gold trend lower. Just when we test the rising channel at $1375 is unclear. The last week of April stands out as one possibility as there is higher probability of a significant decline at that time. We could get an intermediate low at some point in the middle of May.
5-day outlook — bearish
30-day outlook — bearish
90-day outlook — bearish