Summary for week of April 18 – 22
Summary for week of April 18 – 22
- Stocks vulnerable to significant declines early with rebound more likely by Thursday
- Dollar may hold its own here although possible weakness later in the week
- Crude to stay firm although declines possible early in the week
- Gold may experience selling early on but recover later; correction more likely in May
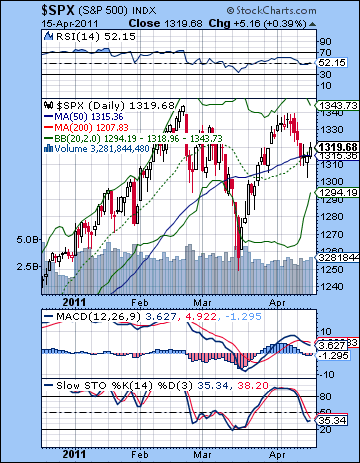 Stocks edged lower last week as disappointing earnings results reduced hopes for a robust recovery for 2011. The Dow bounced off support at 12,200 midweek before closing at 12,341 while the S&P500 finished Friday at 1319. The overall outcome was in keeping with expectations as I thought we had a more likely chance to finish lower. However, the intraweek pattern was more or less opposite from my forecast. The early week Mercury-Jupiter conjunction coincided with declines rather than gains while the late week Sun-Rahu aspect saw stocks rebound. That was one solution to the dilemma I faced given the technical resistance at 1345. If the early week was positive, I was puzzled how the market could rise despite some fairly significant resistance. As it turned out, Monday saw some intraday gains but they fizzled by the close. Tuesday and Wednesday therefore saw a pullback off resistance before hitting support at 1300 and rebounding higher by Friday.
So the lingering effects of the Jupiter-Saturn opposition appear to be in evidence here as the market looks like it could be in a topping formation. Obviously, it’s nowhere near as bearish as I had envisaged a couple of months ago, but these longer term aspects do not manifest as exactly as one would like. In keeping with Saturn’s jaundiced view of all things Jupiterian, inflation remains a going concern here, although the Fed insists that long term risks are low as long as wages are not rising. While this may be true, Bernanke is not acknowledging other factors in the inflation equation, namely, that the falling Dollar means that $100 oil may be with us for some time and it is unlikely to be helpful for the economy. If Jupiter alone symbolizes inflation without consequences, Jupiter with Saturn is inflation with nasty consequences and increasing skepticism. The current circumstance represents a pivotal moment in the diverging opinions about the Fed’s inflationary QE2 policy. Bulls of course see it as the tide that lifts all boats, with or without inflation. Bulls seem prepared to accept the possibility that a falling Dollar will create some inflation but not enough to derail growth and recovery prospects. Bears are informed by Saturnian sobriety so they take a dim view of this recent run-up in oil and doubt the economy can expand in a sustainable way given the rising price of imported commodities. The astrological indicators would appear to favor the bearish view of the risks of inflation here as Jupiter-Saturn is still fairly strong. The next major influence is likely to be somewhat different as Jupiter teams up with Rahu, the North Lunar Node. Rahu is a more unpredictable influence and it can produce both speculative gains and huge sell-offs. While I still incline towards the latter bearish view of its effects over the next month or two, I cannot completely rule out some significant rally attempts in May.
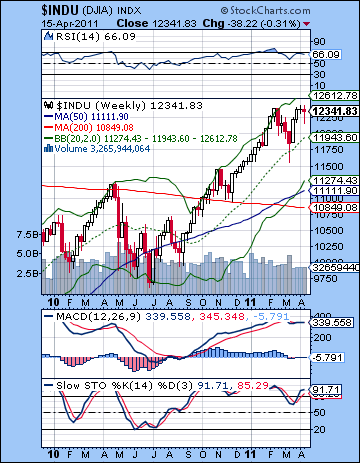 Despite the small loss on the week, bulls could actually claim some sense of victory in their successful defense of support levels at 1300 on the SPX (12,200 on the Dow). Of course, this came a couple of days after a significant achievement by the bears as the SPX could not close above 1340 and challenge its previous high. Perhaps there is a stalemate of sorts underway as the market is range bound between 1340 and 1300. The defense of 1300 was close to the 50 DMA at 1315 so that may be seen as an increasingly important source of support. The Dow perhaps illustrated this defense more dramatically as Wednesday saw a re-test of the 50 DMA at 12,185 after which the market turned higher. While the SPX is at the bottom part of the range, it is still a little ways from testing support from the rising channel at 1285.
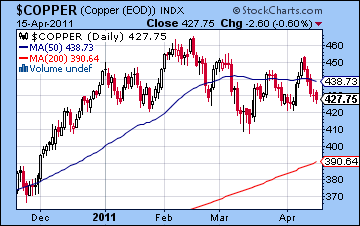
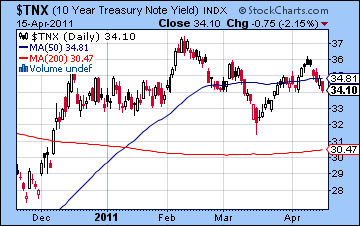
The technical indicators are not that helpful on the daily SPX chart. RSI (52) is fairly middling but not providing many clues about future direction. Stochastics (35) may have a little lower to go before touching the oversold line but that may only suggest one or two more down days which may end up only testing support at 1300 once again. MACD is still in a bearish crossover, perhaps indicating the fragility of this bounce. The weekly Dow chart still shows a chart that seems too overbought to be very appealing for medium term longs. Price is close to the upper Bollinger band and RSI (66) is still in proximity to the overbought area at the 70 line. MACD is flat lining here and is actually in a slight bearish crossover. Bulls are no doubt counting on the largesse of the Fed to keep the ball rolling uphill. But if QE3 will not be forthcoming, then it seems somewhat less likely that stocks can rise much further, even while Bernanke’s last $100 Billion is being spent to buy back treasuries until June 30. At some point before the end of June, there will be a significant number of investors who will not want to take that chance and will exit the market. Meanwhile, copper is still treading water but it’s worth noting that it is not keeping up with equities here as it is trading below its 50 DMA. If it closes below 420 and it may run the risk of falling back to its 200 DMA at 390. Treasuries are also suggesting imminent weakness in stocks as the yield on the 10-year fell through last week and closed below its 50 DMA. There is a very rough head and shoulders pattern here that may well foretell of lower yields in the near future. Lower yields will likely mean lower stock prices.
 This week offers both bearish and bullish astrological influences, although the bearish aspects would seem to be more significant. There is a fairly rare and potentially nasty alignment between Mercury, Mars and Saturn early in the week. Both Mars and Saturn are considered bad planets, so when they dominate a 3-planet alignment, it increases the likelihood of declines. On Monday, Mars opposes Saturn so that increases the chances for a pullback in the early going. On Tuesday, Mars will conjoin retrograde Mercury just one degree from an exact opposition to Saturn, so that is another tense influence that could be bearish. By Wednesday, Mercury will still be approaching its difficult opposition to Saturn so that is an argument for still more downside but this seems somewhat more uncertain. At the same time, a more bullish looking pattern is setting up for Wednesday and Thursday (Friday is closed for a holiday) as both the Sun and Venus are in alignment with Neptune. Generally, the bearish aspects look more dangerous here and there is an increased possibility for a large (>2%) decline at some point along the way. The clustering of aspects makes it somewhat harder to call daily outcomes, although I do think the period between Monday and Tuesday should be net negative while Wednesday-Thursday has a decent chance of being net positive. One possible bearish scenario would see a decline into early Wednesday and a test of the rising channel support at 1285 before a rebound into Thursday to perhaps 1300-1310. A more bullish outcome would see a re-test of 1300 by Tuesday and then a reversal higher into Thursday to perhaps 1320. While the bullish scenario is quite possible, I expect a lower week overall with the bearish scenario looking somewhat more compelling. It will be interesting to see how that nasty Mars-Saturn aspect actually turns out.
 Next week (Apr 25-29) begins with Mercury again opposite Saturn. Actually, Mercury will return to direct motion on the preceding Saturday and will begin to move away from Saturn’s influence by the start of the week. However, it will still be moving quite slowly so it could be adversely affected. I would therefore expect a bearish start to this week although the rest of the week could be more bullish. The following week (May 2-6) looks more volatile as both Mars and Jupiter come under the aspect of Rahu. This could produce a significant move in either direction although I am expecting downside to prevail. The rest of May looks somewhat more bearish at this point, although I would not rule out a sideways move. The market looks more likely to reverse higher in early June when Jupiter aspects Neptune, Uranus and Pluto in fairly quick succession and Saturn makes its direct station on June 13. Just where the SPX will be at that time is very much a guess although I think it could be anywhere between 1040 and 1200. The summer will likely see another rally attempt which will last into August. This should be strong enough to add 10-20% to the SPX . Depending on how low we go beforehand, we could conceivably rise to new highs — perhaps even to 1400. This would not be my most likely scenario, however. The fall looks more bearish again as the Saturn-Ketu aspect could bring stocks tumbling in a hurry. I am expecting lower lows by Dec-Jan 2012.
5-day outlook — bearish SPX 1300-1320
30-day outlook — bearish SPX 1240-1280
90-day outlook — neutral SPX 1280-1350
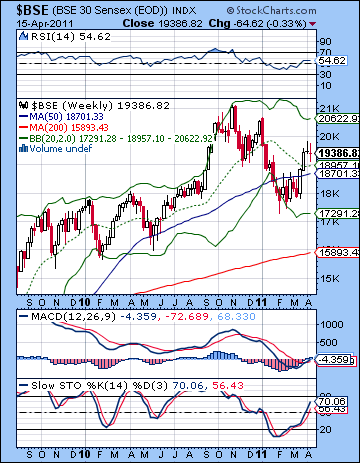
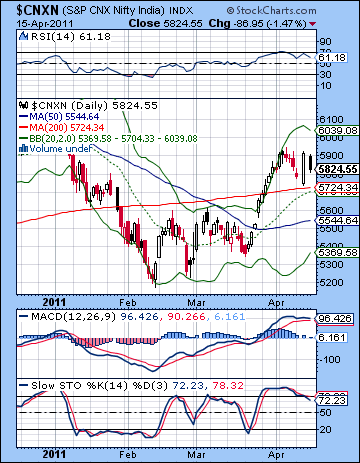 Inflation fears returned last week as higher than expected data sent a chill into the market. Despite a midweek rise, the Sensex ended the week 70 points lower closing at 19,386 while the Nifty finished at 5824. This outcome was a little more bearish than expected, mostly because Monday was down rather than up. Nonetheless, the Mercury-Jupiter conjunction did propel stocks higher across Monday and Wednesday which was very much in keeping with expectations. I also thought there was a good chance we would test resistance of 5950 on the Nifty by midweek we came very close to that level on Wednesday. Friday was lower as expected as the Sun-Rahu aspect caused problems associated with government (Sun). Clearly, the news that inflation was almost 9% despite repeated rate hikes by the RBI was disappointing and convinced many investors to take profits.
It is perhaps no surprise that the market continues to be susceptible to inflation worries. Jupiter is still quite close to its opposition aspect with Saturn, so we may tend to have situations that highlight the negative consequences (Saturn) of expansion and growth (Jupiter). Of course, 2010 was the year of worry-free inflation policies. The second half of 2010 in particular was the time when the Fed’s QE2 program boosted asset prices all over the world. At that time, Jupiter was in close proximity to risk-seeking Uranus, so the natural inflationary tendencies of Jupiter were magnified by the energy of Uranus. Without a strong Saturn presence to temper enthusiasm, it led to higher inflation and stock prices, as investors took turns drinking from Bernanke’s punch bowl. As Jupiter lost its ally in Uranus after the conjunction, the enthusiasm for inflation began to wane and Indian stocks came off their highs. All of the sudden, the party was over and the hangovers began in earnest. What would be the cost of all this cheap money on the corporate bottom line? As ebullient Jupiter moved into its aspect with sober Saturn, all that expansion began to look dangerous and unsustainable. Saturn introduced a skepticism to the quick growth model and the result is that stocks have been unable to more above key resistance levels. As the Jupiter-Saturn aspect loses influence in the coming weeks, it will be replaced by a Jupiter-Rahu aspect in May. While Rahu can also be a negative influence, it operates somewhat differently than Saturn. Where Saturn stifles optimism, Rahu distorts it. Rahu is a more unpredictable energy and therefore we cannot absolutely rule out some rally attempts through May. But it is a potentially disruptive force nonetheless, and for that reason we should remain very cautious about equities in the weeks ahead.
 The technicals continued to look vulnerable last week after the bulls failed to cross above key resistance at 5950. This is a critical dividing line in the market because two major resistance lines intersect at this level. The falling trendline from the November highs cuts through 5900 while the rising broken trendline from 2010 lows is also now located in this 5900-6000 area. This line was previously support and is now poised to act as resistance. Wednesday’s high was a successful test of the resistance from the falling trend line as Friday’s reversal lower was proof positive of the efficacy of this line. If the Nifty can close above 5950, then it will be a significant victory for the bulls. Of course, they will then also have to break above the rising trend line at 6000, but it may be enough to give bulls the momentum to do so. Until that time, the market seems vulnerable to more downside. Friday was the first chance for the bears and they did not squander it. The market will remain in bearish hands unless or until the Nifty closes above 5950. Given the angle of the falling trend line, however, this resistance will fall with each week, so it is possible it could be broken to the upside next week at a somewhat lower level, e.g. 5900.
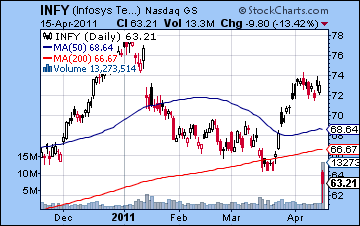
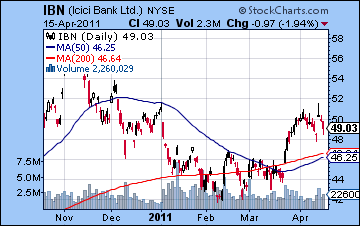
In the event of a pullback this week, bulls will attempt to defend the 200 DMA at 5724. They successfully defended it last Wednesday so we will see if they can repeat it on the next test. The indicators are looking flabby here as RSI (61) is trending down after a recent push to the 70 line. Worse still is that the RSI has made a second lower high below the 70 line as if to underscore the instability of the current rally. MACD is flat here and is on the verge of a bearish crossover. Stochastics (72) are slumping lower now and have fallen below the 80 line. All of these indicators do not present any obvious reason to be bullish. The weekly Sensex chart has not changed substantially as price remains above the 50 WMA at 18,701. This is at least a moderately bullish signal. Meanwhile, Infosys (INFY) suffered the slings and arrows of the outrageously high Rupee as investors dumped the stock on high volume Friday following a disappointing revenue announcement. It has now taken out its previous March low and is trading below its 200 DMA. This is a very bearish indication that increases the likelihood of more downside to come. ICICI Bank (IBN) struggled to equal its previous January high last week. While the rebound is significantly bullish, one wonders if it is running out of gas here as Wednesday’s session produced a bearish shooting star candle. It may require another period of consolidation closer to the 200 DMA before attempting another rally which challenges its January high.
 This week tilts bearish due to a fairly intense alignment of Mercury, Mars and Saturn. Mars and Saturn are both malefic planets and their aspects are a fairly reliable indicator of declines. The presence of Mercury in the mix would appear to increase the tension and perhaps magnify the potential downside. On Monday, Mars opposes Saturn so this increases the likelihood of a down day. On Tuesday, Mercury conjoins Mars while still in opposition to Saturn. This is another probable negative influence. While I would not rule out an up day somewhere along the way here, there is a greater probability of declines from Monday to Wednesday due to this alignment. There is also a somewhat greater chance for larger declines (>2%) around these aspects. But sentiment could shift around midweek as the Sun and Venus align with Neptune on Wednesday and Thursday. (markets are closed Friday) This increases the likelihood that we could see at least one up day and I would not rule out two up days. A bullish unfolding of these patterns would see a retest of last Wednesday’s low at 5725 before it reversing higher to perhaps current levels (5800-5850). A more bearish outcome would see a steeper decline to perhaps 5600 and then a recovery back to 5750 by Thursday. I would favour the bearish outcome here, although I’m not that confident the Nifty will trade as low as 5600 this week. The medium term astrological indicators are turning more bearish here so larger declines are more likely as time goes on. I tend to think we will have to wait until next week and into May before we see anything dramatic on the downside, however.
 Next week (Apr 25-29) begins with Mercury again in opposition to Saturn. Mercury returns to direct motion on the preceding Saturday, but it will be moving quite slowly still and could create a pessimistic mood. While some up days are likely later in the week, this looks like a bearish week overall that may take the Nifty below 5700. The following week (May 2-6) also looks difficult as Mars conjoins Jupiter while in aspect to Rahu. This is a volatile combination that could spark some widespread selling. I would not be surprised if we tested support at 5300 here. May generally looks fairly bearish, although some rebound is likely around mid-month. The end of May and early June look bearish again, so I would not rule out a lower low here. 4800 on the Nifty is quite possible. A significant rally is likely by mid-June as Jupiter will aspect Neptune, Uranus and Pluto. The rally should extend into July and perhaps August. After that, the Saturn-Ketu aspect will weigh heavily on the markets and take prices lower once again in September. The end of the year is likely to continue the sell-off so lower lows are possible in Q4. I would not rule out 4000 on the Nifty by this time. We will likely see a more sustainable rally take hold as we move into 2012 so that might be a better time to consider entering some medium term long positions.
5-day outlook — bearish NIFTY 5700-5800
30-day outlook — bearish NIFTY 5200-5400
90-day outlook — bearish NIFTY 5600-5900
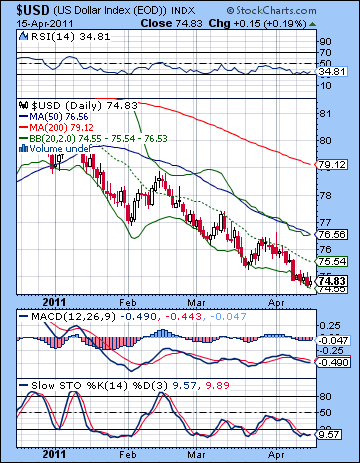 The Dollar edged slightly lower last week as the Fed continued to argue that inflation could be contained and there would be no need to raise rates anytime soon. After an up and down week, the USDX finished at 74.86 while the Euro lost a little ground to 1.443 and the Rupee closed at 44.34. My expectations had been fairly bearish for the Dollar so this outcome was not surprising. I thought the Mercury-Jupiter conjunction would see some selling in the greenback and Tuesday was lower, although Thursday saw the Dollar fall lower still. While the Dollar skidded lower, RSI (35) actually climbed off the 30 line and showed the beginnings of a possible positive divergence that could turn things around. MACD is still in bearish crossover but is no longer falling. Price has been sliding down the lower Bollinger band for the past week thus raising the possibility for some kind of bounce, if only back to the 20 DMA. 76.5 would be a more significant resistance level in the event of a rally as it is the upper Bollinger band, the 50 DMA. The falling trend line is a little below that level at around 76. A break above this line would definitely invigorate the Dollar in a big way, although it still seems like a tall order for the forlorn greenback. This critical trend line is now around 1.43 for the Eurodollar.
This week offers the possibility of some upside for the Dollar, although I acknowledge there are mitigating factors that may delay it for another week. The early week Mercury-Mars-Saturn alignment has the potential to move currency markets sharply. The trouble is that the alignment does not take place in a sensitive spot in the key horoscopes of the Euro or the USDX. For this reason, I’m less convinced that the Dollar can climb here, although I have a bullish bias in the first half of the week. The second half of the week looks more bearish for the Dollar as the Sun-Venus aspect is likely to increase risk appetite. Next week looks more promising for the Dollar so we may finally see some kind of lasting reversal then. I am expecting May to see further gains in the Dollar to 76 and beyond so that we could see the Euro break below 1.40 fairly soon. The Dollar rally should continue into June. After another pullback to a probable higher low into August, the Dollar should rally once again in the second half of the year with the biggest gains in Nov-Jan.
Dollar
5-day outlook — neutral
30-day outlook — bullish
90-day outlook — bullish
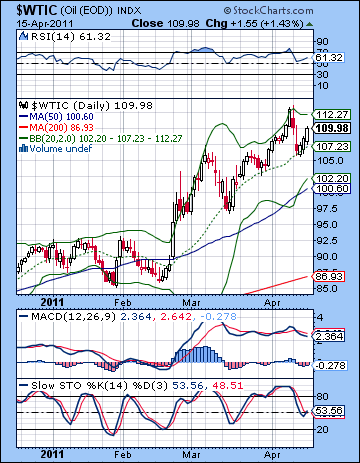 Crude oil came off its recent highs as hopes for a cease-fire in Libya sent futures tumbling under $110. It was a confusing week in terms of my forecast as I had expected the decline to occur later in the week rather than on Monday and Tuesday. I thought that the Mercury-Jupiter conjunction would push prices higher going into Wednesday but as it turned out we saw declines early with only Wednesday registering a gain. Nonetheless, the key support level at $105 held firm, suggesting that the bulls are still in control. The bulls also successfully defended the 20 DMA at $106 for the third time in the past month and this was another indication that crude still has significant upside momentum. After $105, support is likely around the $100 level which is also near the 50 DMA. The rising channel of previous resistance now also runs through this $100 level so that is likely to provide major support in the event of a pullback. A close below $100 would likely mean the end to this breakout and a return to the previous trading range for crude between $80 and $92. RSI (60) is well below the overbought level but this does not preclude another run-up to the 70 line. The low of 55 was higher than the previous RSI low suggesting that more strength is possible in the near term. Resistance will likely be provided by the previous high at $112. Failure to surpass that level might bring about a little more bearishness and compel some investors to take some money off the table. If it does climb above $112, the next level of resistance would be from the rising channel, now around $115.
This week offers some possibility of another pullback in the early going as the Mars-Saturn aspect has the potential to be bearish for crude. Monday and Tuesday would therefore be somewhat more likely to be down days around this aspect. While it is conceivable that we will see large decline, I’m not expecting anything too dramatic. Perhaps we will only test the $105 support level. And there is still the chance that prices will stay firm despite this apparent bearish aspect. The late week period looks bullish again as the Sun, Venus and Neptune form an alignment. I would expect at least one up day from this pattern, probably on Thursday and Wednesday may well be positive also. So these two influences could largely offset each other and we could end up somewhere between $105 and $110 once again. Next week looks bearish to start as Mercury returns to direct motion opposite Saturn. The end of the week looks fairly bullish, however, so it seems unlikely that the up trend will be broken. May is more mixed as Jupiter is aspected by Rahu, so that may bring significantly lower prices. While the decline could start in the first week, I tend to think that most of the downside will only occur after the Jupiter-Rahu aspect is exact on May 7. The second half of May and early June look perhaps more bearish in this respect. This is the most likely time that crude could return to its normal trading range.
5-day outlook — neutral
30-day outlook — bearish-neutral
90-day outlook — bearish
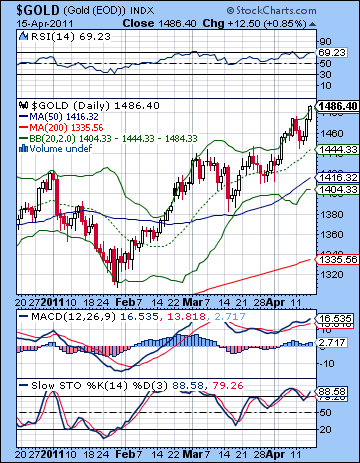 Gold extended its recent advance last week as it benefited yet again for a flagging US Dollar. After a brief early week pullback, it finished the week on a winning note closing above $1485 on the continuous contract. While I was open to more upside here and the possibility of $1500, the week unfolded quite unexpectedly. I thought the early week Mercury-Jupiter conjunction would tend to lift sentiment but in fact the opposite occurred as gold tested support at $1450 by Tuesday. The Sun-Rahu aspect took gold higher once more as it pushed up towards resistance from the rising channel. As persistent as this climb has been, gold is once again running up against some significant resistance here. In addition, the RSI (69) is again venturing into overbought territory. Of course, it could move higher still, but it does not make an attractive candidate for investors seeking an entry point to go long. The RSI is also in overbought territory at 71 on the weekly chart thus further reducing the appeal of long positions. At the moment, gold is a pure momentum play. MACD is once again in a bullish crossover and rising and Stochastics (88) are overbought. Gold is closely adhering to a steeply rising channel off the January low. Support from this channel is around $1450 — roughly the same place as the 20 DMA. This will be a key area that will be tested in the days ahead. As long as gold can stay above that level, the rally will continue. Below that, the 50 DMA at $1416 may also provide some support.
This week gold is likely to stay fairly strong with more upside possible. The early week Mars-Saturn aspect may be bearish for equities but I’m less certain about its effects on gold. That said, I think the most likely scenario is a day or two of declines from Monday-Wednesday and then some recovery later. Wednesday would be the most likely candidate for an up day as the Sun and Venus are in aspect with Neptune. This pattern will stay largely in place for Thursday also. So the simplest scenario here for gold would be two down days, perhaps retesting $1450, and then two more up days which takes us back towards current levels or a little below. Again, I would not rule out a quick run to $1500 at any point this week or next. Bears are clearly swimming upstream here and will continue to do so until that rising channel is broken around $1450. Next week looks fairly mixed with more upside possible, although not probable. Gold could begin to top out at this time in preparation for a more significant decline in May. The Jupiter-Rahu aspect in the first week of May is likely to see the beginnings of such a decline and it could be larger than many people expect. $1320 should be quite doable by early June and it is likely to go lower than that. Gold is likely to recover by mid-June and the Saturn direct station on June 13. This should set up a significant rally that extends into July. Whether we see a higher high is hard to say at this point. August and September look more bearish.
5-day outlook — neutral-bullish
30-day outlook — bearish
90-day outlook — bearish

