Summary for week of July 18 – 22
- Stocks choppier this week with a possible bullish bias
- Dollar to stay firm with possible upside; Euro unlikely to break support at 1.40
- Crude could move higher at midweek but weakness possible by Friday
- Gold looks more bearish as Sun enters Cancer this week
Summary for week of July 18 – 22
- Stocks choppier this week with a possible bullish bias
- Dollar to stay firm with possible upside; Euro unlikely to break support at 1.40
- Crude could move higher at midweek but weakness possible by Friday
- Gold looks more bearish as Sun enters Cancer this week
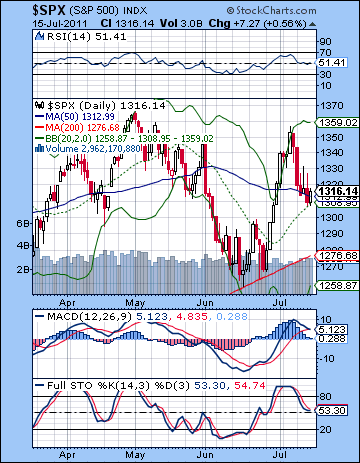 Not even the grand bull poobah himself Ben Bernanke could talk up stocks last week as worries over government indebtedness around the world continued to weigh on the market. The Dow extended its reversal lower from the previous week and declined by 2% closing at 12,479 while the S&P500 finished at 1316. This bearish result was in keeping with expectations as I thought Monday’s Mercury-Mars aspect and Tuesday’s Venus-Saturn aspect would take the market lower. I thought we had a good chance to test support at 1320 on the SPX and we did as Tuesday closed near 1315. Wednesday was higher as expected as I thought the Moon-Jupiter aspect could correspond with some buying. Also Thursday was lower as expected as we got the second phase of that Venus-Saturn aspect as the SPX traded below 1310. Friday’s gain was somewhat unexpected, however, as I thought the planets looked somewhat listless. Nonetheless, the Thursday-Friday combination did produce a lower close than Wednesday which is what I was looking for.
The financial media seems to be focused on the debt 24-7 these days. In the early week, it was all about the Euro-drama as Ireland’s debt was downgraded to junk while Italy began to shows signs of joining its fellow Club Med members as yields spiked. Austerity talk is all the rage these days, but it usually comes in exchange for more bailout money as the EU tries to finesse both the carrot and stick in order to get its financial house in order. A similar tale is unfolding in Washington, DC as debt ceiling negotiations carry on into their 11th hour without a deal in sight. As a reflection of the growing power of Saturn in 2011, there is a growing admission on both sides that cuts need to be made. But the question is: how deep and will there be a corresponding tax increase? Bullish Jupiter was the cosmic enabler to all that Keynesian stimulus from 2008 to 2010 as the post-crash rally was heavily dependent on government largesse. Along the way, there was more than a little collateral damage in the form of rising inflation, especially in commodities, and a stubbornly high level of unemployment. It was as if all that borrowed money seemed to bypass Main St and enter one of Wall Street’s back alleys, to be unloaded by from a while panel van by men in black balaclavas under the cover of night. Now that Jupiter is less able to call the shots, stimulus is no longer a sure thing. Bernanke himself opened the door for QE3 but only if the economy weakens further. This is more in line with the EU’s more balanced approach of austerity measures and bailouts. The government deficit needs to be cut in order to maintain the US’s AAA debt rating, but stimulus money will only arrive if things get worse. So the balancing act of the carrot and stick is more evidence of a relative stalemate between Jupiter and Saturn, and as a result we have a market stuck in a range. I do expect the economy to get worse over the next two years, and stocks will largely follow suit. Equity corrections usually forecast recessions by several months, so it seems likely that one more month of little or no job growth would spark a larger sell-off.
 While the bulls fumbled the ball last week, the bears did not exactly run with it. The decline may well only be part of a consolidation before the market heads higher. Or at least, that is what many bulls are saying here as the key support levels are still intact. The rising trend line off the 2010 lows comes in around 1285-1290. As long as the market stays above that level, there is very little for the bulls to worry about. Last week’s action showed the SPX drawn to the 20 and 50 DMA around 1310-1315. This would be a very shallow consolidation indeed if the market were to reverse higher from these levels. What’s also moderately bullish is that this pullback stopped very close to the falling trend line from the May and June highs. A classic case of resistance turning into support.
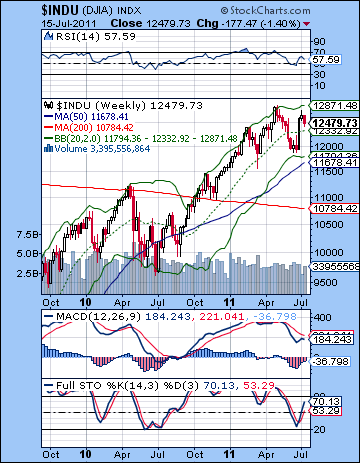
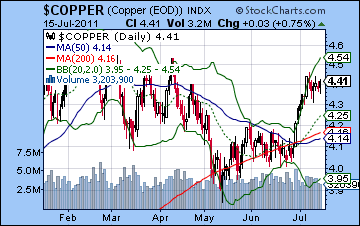
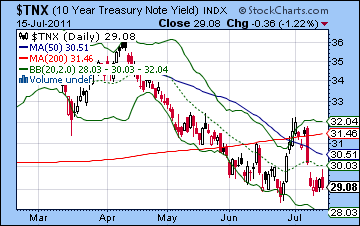
Bears have to hope that 1330 turns into resistance or else the market may take another run higher and test the previous high at 1360 and the upper Bollinger band. A new breakout high above 1370 might not be long in coming in that case. Bears can point to the beginnings of a bearish crossover in MACD as well as an almost-flat RSI at 51. Stochastics (53) have come down substantially but have more room to fall before becoming overbought. But that’s not exactly a compelling case for being short. But bulls can argue that if support holds at the 20 DMA at 1308, then we could move higher. The absence of any clear overbought status does not make that a high percentage move, however. The weekly Dow chart looks similarly equivocal as Stochastics have risen to 70 but are not overbought enough to tilt the odds in favour of the bears. Given the close proximity of the previous high to the upper Bollinger band, bears might suggest that the correction is still in place. It might be, but it’s really not much to go on on either side. As long as the 50 WMA and the 200 DMA continue to have a clearly marked upward slope and the main rising trend lines are in place, there is not a compelling technical case for the bears. There is astrologically, but that’s another matter! Meanwhile, copper took a breather last week from its recent meteoric rise. Even with the pause in the rally, it still looks quite strong as it remains above the falling trend line from the February high. It may back test that line in the weeks to come. Bulls will be betting that the line will hold at 420-430, although I suspect it won’t. All this wrangling over the debt ceiling has put the focus on treasuries as investors try to discount the possible outcomes. Yields on the 10-year tested recent lows near 2.9% and suggested that most players do not expect a default and a significant reduction in spending. Less spending, of course, will reduce the supply which will tend to drive up prices. The horoscope of US bonds looks somewhat bearish, however, so I tend to think there will be some reason to sell treasuries over the next few weeks. It may be that the final deal is less ambitious than Obama hopes and this would suggest fewer cuts and more debt issuance in the near term. Alternatively, it is possible that an equities rally might be enough to explain any upcoming bond sell-off.
 The planets this week are particularly hard to call as there is a real mix of influences. The Full Moon that we saw at the end of last week marks a potential low in the lunar cycle which ought to provide some baseline support for stocks over the next two weeks. But as we know, the lunar cycle is only one of many, so aspects will often have a stronger say. The early week looks somewhat bearish. Monday’s Mercury-Rahu aspect could go either way, although it can reflect situations of uncertainty and false information. Perhaps a negative outcome is slightly more likely on Monday and Tuesday. I doubt we would get two down days at the beginning of the week. Tuesday is perhaps more prone to declines than Monday. Mercury enters Leo on Wednesday so that may boost sentiment somewhat, especially if the market has been lower beforehand. This could well extend into Thursday although that is a big question mark. Friday looks more bearish, however, as Mars conjoins Ketu (south lunar node). If we do see some early week declines, they do not seem to be very strong. I would therefore not expect the trendline to be seriously tested at 1285. We could see 1300 though before it reverses higher. If Monday turns out to be higher, Tuesday is more likely to be lower so that would likely maintain current support at the 20 DMA at 1310 or so. Some upward move is likely midweek but I doubt the SPX could hit 1330. We’ll see. Friday is likely to take stocks lower again, with a greater chance that the down move could be large. So while there is a chance of a testing of support at 1300 or slightly below, I don’t think it’s a high probability. It could happen, but it’s not something I can see clearly. It’s more likely that we finish around current levels, say between 1300-1320. When in doubt, regress to the mean.
 Next week (July 25-29) looks somewhat more bullish, although Monday’s entry of Mars into Gemini could correspond with a decline. The midweek looks quite bullish as the Sun is in aspect with Uranus and this should mostly continue into Friday and the Mercury-Venus-Neptune alignment. I would therefore expect some kind of bounce but probably nothing too huge. Perhaps in the range of 2-3% overall. The following week (Aug 1-5) could be significant given that Mercury turns retrograde right around midnight on Tuesday, August 2. This is a very interesting coincidence given it occurs at the same time as the debt ceiling deadline. The retrogradation of Mercury opposite Neptune at this time definitely increases the odds of some kind of unexpected outcome in the debt ceiling negotiations. I still don’t think the US is going to default here, but I think the odds are fairly good that there will be a sense of disappointment, and since Neptune is involved, some kind of confusion or deception. It’s definitely not a good pattern to have at a crucial moment. In any event, that is likely a bearish indication for the market for the week. Then there is the rather nasty Mars-Uranus-Pluto t-square set for August 9-10. This is another bad pattern that should correspond with further declines. Assuming the rebound into the end of July doesn’t climb too high (1330?), this second week of August could see a serious test of support around 1260-1280. The symbolism here is for a violent and sudden situation so it may speak to some military or shocking action somewhere in the world. The USA horoscope is closely afflicted by this pattern, so there’s a good chance it will involve the US directly. While it’s conceivable that the market could shrug it off, I still think the most likely outcome is a bearish one. Some mid-August bounce is possible but the planets don’t look very bullish after that. I wouldn’t rule out some sideways moves into September, but the bearish influence will likely grow with the Mars-Saturn aspect on August 25. All in all, I do think the market is getting ready to sell off hard in the coming weeks, although I am reluctant to suggest any specific downside target. 1220 is very possible by October, but then again, so is 1120 or even 1040. Hopefully, I will have a better idea about the magnitude of the upcoming correction before August. There should be a significant rebound rally starting in October and continuing into November. December would then see the start of another leg lower.
5-day outlook — neutral SPX 1300-1320
30-day outlook — bearish SPX 1250-1290
90-day outlook — bearish SPX 1100-1200
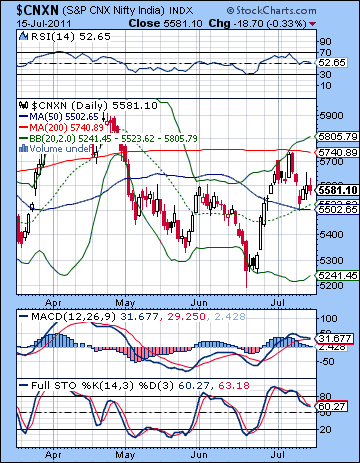 Stocks slumped lower last week as the ongoing sovereign debt problem offset corporate earnings. The Sensex lost almost 2% closing at 18,550 while the Nifty finished the week at 5581. This bearish result was largely in keeping with expectations as I thought the Nifty would be hard pressed to finish above 5600 here. The cluster of negative aspects early in the week did coincide with two down days on Monday and Tuesday. Monday’s Mercury-Mars aspect saw the Nifty retrace back to the 5600 support level, while Tuesday’s Venus-Saturn aspect took out that critical technical level. As expected, the market began to reverse on Wednesday although this continued only into Thursday. My call for a rise on Friday was mistaken as we instead saw a modest sell-off as 5600 now acted as resistance.
Last week’s decline affirms the importance of Saturn’s bearish influence here as the passing aspect with Venus made clear. Certainly all the talk about sovereign debt and the various austerity plans in Europe and America are very much a reflection of a Saturnian solution to the current economic problem. Ireland’s debt was downgraded to junk, while Italy showed signs of succumbing to the same debt contagion that has engulfed the other weaker European economies. And we got still more debt and austerity talk out of the US as debt ceiling talks got bogged down and now raise the spectre of a default. It’s not very likely, but the inability for the politicians to come to an agreement reflects perhaps the tentativeness of the current round of austerity. After two years of a Jupiter-fueled stock rally that was built on borrowed government stimulus, 2011 has thus far seen more of a sober, Saturnian approach to the world’s financial problems. All of a sudden, there is a growing awareness that debts have to be repaid. But even here, we can still see hesitation in fully embracing Saturn’s austerity solution. The EU continues to offer bailouts, whether it be to Ireland, Greece (two and counting) or Italy, even if they are contingent on the adoption of austerity programs. Fed Chair Bernanke has signalled that he will only undertake further easing with QE3 if the economy gets measurably worse. So that suggests more of an even mix of austerity and potential stimulus down the road. That’s pretty much what one would expect from the current balance of power in the sky as neither Jupiter nor Saturn appear dominant. Aside from some fairly short term moves, it seems that Saturn is still in line to take the reins in August and September when it forms an aspect with Ketu. This suggests that the next major move will be lower.
 It was not a good week for the bulls as they failed to defend the 5600 support level early in the week and then again on Friday. The technicals appeared to be lining up bearishly as the 5600 level looked fairly precarious. Tuesday’s follow through on the downside was a reminder of the incremental nature of the market, especially in this heavily contested area around 5600. Bulls came in and bought the Nifty to prevent damage and pushed it higher through Thursday but after an intraday spike to 5650 had to settle for a close right at resistance at 5600. That was a bad sign for bulls and Friday’s decline broke through support once again. On the bright side, however, bulls can rightly point out that Tuesday’s slide arrested at the confluence of the 20 and 50 DMA — a sign that the market may have some upside. Stochastics (60) have come off their overbought levels but have much further to fall before they offer any evidence for a bullish stance. MACD is on the verge of a bearish crossover which could encourage weak bulls to sell their positions. It will be interesting to see if it actually crosses over in the coming days.
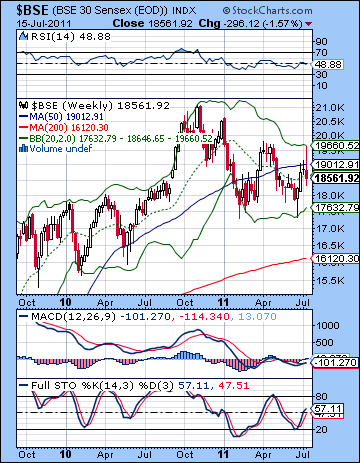
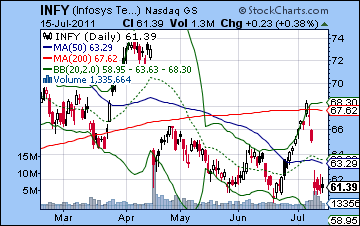
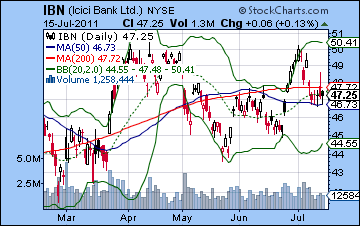
The market looks increasingly range bound as 5500 is now support and resistance is 5600. That’s not much turf to fight over. Another test of the 200 DMA at 5740 is obviously very possible still, but only if we first get a close over 5600. The BSE weekly is now sitting at support on the 20 WMA. Another close below this level would be quite bearish and might increase the likelihood of more downside. The 20 WMA is actually a surprisingly good level of support and resistance over the past several months. All those closes in May and July were below the 20 WMA, and the recent pop above this line created a situation were it acted as support. Technically, it failed as support with Friday’s close although only by 100 points. We will see if this is a problem in the upcoming week. Disappointing earnings news from Infosys (INFY) sent the stock sharply lower last week. We can see how support has been found near the June lows of $61. A close below current levels would be bearish as it would note the start of a new leg lower. But if current levels hold, then it may endeavour another run up to the 50 DMA and perhaps again to the 200 DMA. The picture is somewhat rosier for ICICI Bank (IBN). Although it followed the broader market lower, it appears to have found support at the 50 and 200 DMA. It is forming an ascending triangle pattern which features a series of equal highs and progressively higher lows. While this is a bullish pattern, it is not a certainty and can fail and break to the downside. The key will be a close above the resistance level which will mark a breakout higher.
 This week looks like a mixed bag albeit with a bullish bias into midweek. The early week could be susceptible to more downside as Monday’s Mercury-Rahu aspect is often troublesome. If we do get a down day on Monday or Tuesday (likely not both), it may not be too severe. So it seems more likely that 5500 will hold as support in the event of any down move. Tuesday looks somewhat more positive so I would not be surprised to see a positive close. Wednesday also leans towards the bulls as Mercury enters Leo while the Moon joins Uranus in Pisces. I would expect to see 5600 tested as resistance at some point, and there is a good chance that the Nifty will close above 5600. The end of the week looks less bullish, however as Venus is in aspect with Mars on Thursday and then Mars approaches its conjunction with Ketu on Friday. Both of these aspects look bearish, although Friday’s looks somewhat worse in terms of likelihood of a down day and the possible size of a down move. There is enough negative planetary energy to erase the earlier gains on the week. And yet if the Nifty has risen over 5600, then this suggests a messy reversal back below support. In other words, the astrological evidence does not fit well with the possible technical picture. Whenever this occurs, we need to take extra caution, as the odds diminish for a correct forecast. If the Nifty closes above 5600, then it is less likely to do an about-face and reverse lower by Friday below 5600. It could happen that way, but I may be missing something in my astro analysis. In any event, there is a reasonable chance we will finish near current levels.
 Next week (July 25-29) tilts bullish although Monday may begin negatively as Mars enters Gemini. Tuesday’s Sun-Uranus aspect may well begin three or even four positive days here as the end of the week also looks bullish on the Mercury-Venus-Neptune alignment. This looks likely to push the Nifty higher, perhaps up to resistance of the 200 DMA. The following week (Aug 1-5) will see the fallout, if any, of the US debt ceiling negotiations. What is important to note here is that Mercury will turn retrograde on the same day that the deal must be reached. Mercury will be in aspect with Neptune at the time of its retrograde station, so this is a negative factor that increases the odds that something will disappoint or surprise the market. Mercury-Neptune contacts are often situations of confusion and deception so it is possible that the situation may be unresolved in some way or not quite what it appears to be. For this reason, I am expecting some selling to begin in the aftermath which should continue into the following week. There should be enough bearish energy to propel the Nifty below 5600 again, even if it is from a higher level of 5750. I would not be surprised to see 5400 or lower here as we move into mid-August. After one week of rebounding higher, stocks may weaken again as we head into the Mars-Saturn aspect of 25 August. This is a very bearish pattern that could take the market down 5% or more over a couple of days. September also looks bearish on the Saturn-Ketu aspect so we could easily see 4800 on the Nifty at some point. A rebound will likely begin some time in October and continue into November. This will be followed, however, but more downside and perhaps even the lows of the year although the corrective move will likely last into January 2012. December-January looks extremely bearish.
5-day outlook — neutral NIFTY 5500-5600
30-day outlook — bearish NIFTY 5200-5400
90-day outlook — bearish NIFTY 4800-5000
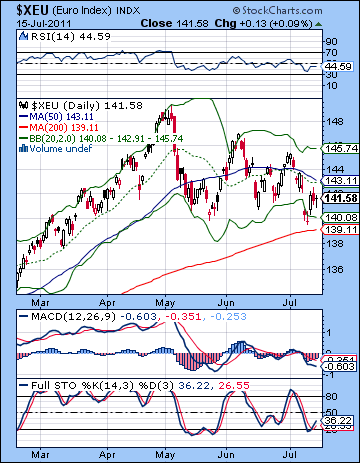 The Euro continued to come under selling pressure last week as Italy entered the sights of the bond vigilantes. After briefly trading below 1.40 on Tuesday, the Euro finished around 1.415 while the Dollar was largely unchanged at 75.13 and the Rupee weakened to 44.56. I had expected the Euro would decline on the Venus-Saturn aspect with 1.40 as a reasonable target. We broke the support of the rising line of the pennant pattern although we did not break horizontal support at 1.40. A close below 1.40 would almost certainly invite a drop down to the 200 DMA at 1.39, although it is unclear if it would act as immediate support. The rebound in the second half of the week rose towards the 50 DMA at 1.43. While such a level is quite possible in the near term, it will be more important to see if the Euro can interrupt the current series of lower highs. While the technical outlook on the Euro is quite bearish here, it has already touched the bottom Bollinger band with Tuesday’s low at 1.40 and is venturing a move higher towards the 20 and 50 DMA. Stochastics (36) were also oversold on the Tuesday low so that increases the possibility that the rally has more steam left. We can also discern a bullish divergence in MACD as last week’s low was higher than the previous low. Even with some upside likely in the near term, the Euro will only turn bullish if it can close above 1.44. This would break the series of declining highs. Conversely, a close below 1.40 would likely start a new leg down for the Euro. Given the shaky nature of the Eurozone these days, it could fall quite quickly, perhaps all the way back to 1.30.
This week looks bearish to start with some relief likely midweek. The Mercury-Rahu aspect on Monday and Tuesday looks like it could represent more debt jitters in Europe so we could see a quick retest of 1.40. Some upside is likely into Wednesday and perhaps even Thursday as Venus forms a nice angle with the Euro chart. But the end of the week could be bearish, perhaps intensely so. Friday’s Mars-Ketu conjunction in particular may be enough to erase any preceding gains from this week and retest 1.40 yet again. I’m not sure it will hold this third time. Next week may begin bearishly but I am expecting some significant upside as we approach Friday and the Venus-Neptune aspect. So even if we break below 1.40 to 1.39 (or lower), the last week of July should be bullish enough to take the Euro back up into resistance levels of perhaps 1.42.-1.44. August looks mostly bearish with some steep falls for Euro possible during the first half of the month. I’m not expecting it to fall back to 1.30 in August, especially since some kind of rally is likely in the second half of the month. September looks more amenable to the bottom falling out as the Saturn-Ketu aspect will set up right atop the natal Mars in the Euro horoscope. This is an extremely nasty contact that will likely ensure the Euro trades closer to 1.30 by this time. By December-January, we could be seeing the Euro back to 1.20.
Dollar
5-day outlook — neutral
30-day outlook — bullish
90-day outlook — bullish
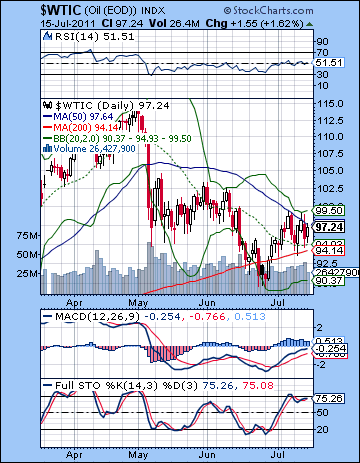 Crude oil edged higher last week buoyed by demand prospects in China and ongoing supply concerns in the Middle East. After trading as high as $99.50, crude closed the week just over $97. I thought we might see more downside with the effects of the early week Mercury-Mars aspect and the midweek Venus-Saturn aspect. While we did get two down days on Monday and Thursday, the up days more than offset the bearishness. Friday was higher as I suggested it might. Technically, crude appears to be strengthening lately as it has been trading around the $97 level — the old resistance level from the head and shoulders pattern. It has not yet traded above $100, but it may be consolidating here before making another move higher. However, it is coming into some fairly significant resistance between $97-100, as this matches both the upper Bollinger band and the 50 DMA. Tuesday’s intraday low found support at the 200 DMA. It may be that if it fails to close above $100, it will resume a downward push and complete a messy, but still recognizable head and shoulders with a downside target of $86. MACD is still in a bullish crossover and is building on a positive divergence with respect to the previous low. It may well also have more upside. On the other hand, it’s important to note that the MACD is approaching the zero line. Rallies can sometimes reverse lower near the zero line, especially if Stochastics are overbought. Currently, Stochastics sit at 75, while quite lofty, it has recently come down from being overbought. This is a somewhat inconclusive measure. RSI (51) appears to be venturing to stay above the 50 level after forming a bullish double bottom.
This week looks fairly choppy with the early week looking somewhat bullish on the Mercury-Rahu aspect. This is not a bonafide bullish influence, however, so it is possible it could go the other way. Wednesday Mercury enters Leo while the Sun is in watery Cancer so that augurs more bullishly for crude. Thursday could also tilt bullish as the Moon transits Pisces but I would be very cautious as Mars approaches it conjunction with Ketu. This conjunction will hit a very sensitive point in the crude futures horoscope so there is a possibility of a large decline Friday or in the after-hours market over the weekend. I would expect crude to trade mostly in last week’s range. Next week looks more bullish, although Wednesday’s Moon-Mars conjunction could see a nasty decline. The late week looks more bullish again. August is hard to call as there is a bullish Jupiter aspect in the Futures chart alongside a bearish Saturn aspect. The first half looks bearish, but the middle and second half could see some recovery. It could be that crude trades within a range of between $90 and $100 for most of the month, perhaps until the Mars-Saturn aspect on August 25. This aspect is likely to help the bears and set the stage for a larger decline in September. $80 will be possible in September.
5-day outlook — bearish-neutral
30-day outlook — bearish
90-day outlook — bearish
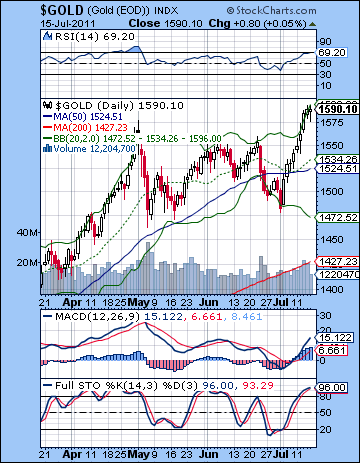 Gold benefited from all the uncertainty around the Eurozone and the US debt ceiling negotiations as it made a new all-time high at $1590. This was a stinging reminder of the unbroken momentum of the gold market these days. Worse still it tossed aside my forecast for a pullback on the apparently bearish Venus-Saturn aspect. While I expected some upside early and late in the week, the affliction to Venus was invisible to gold traders as bullion surged ever higher. Gold’s new high is very bullish obviously, although it is now almost overbought on the daily RSI (69) chart. Not that that counts for much in this market. Stochastics (96) are also grossly overbought and suggest that the easy money may be over in this up move. Gold has also moved to the upper Bollinger band suggesting that new long positions entail more risk. Despite the new high, it may not be a wise move to go long here. Resistance is likely near $1625-1650 and the rising trend line off the recent tops. Support is initially around the $1550 level and below that the 50 DMA may act as support at $1520. Perhaps the most important support level is at $1500 which is where the (logged) rising trend line now sits. The linear trend line comes in somewhat lower than that at $1450-1475 and should be seen as secondary long term support. Only a break of these trend lines will reverse the massive bull market in gold. Until that time, it’s the most reliable bull market going.
This week looks bearish again as the Sun enters the sign of Cancer. The early week Mercury-Rahu aspect may also be a depressing influence on gold, although we will have to see if this aspect is as ineffective as last week’s was. I tend to think there is a better chance for some kind of downside here now that the Sun has changed signs. The late week Mars-Ketu conjunction may not cooperate with the recent gold rally either, so it’s possible we could see a significant move lower here. A test of $1550 is possible and I would not rule out further downside to $1520 if the early week turns out to be negative. Next week looks bullish again as the Sun-Uranus aspect is likely to bring back buyers. Early August looks like there will be more headwinds as the Mars-Uranus-Pluto alignment could produce some selling. After the 11th, Sun-Venus-Mercury conjunction should push up prices back towards recent highs. Another new high is possible, although that will depend on how much downside we see beforehand. Late August and September look more bearish so that is the time when we might see that rising trend line finally broken. A rebound is likely in October and November and this may back test resistance from that line, before gold heads substantially lower in December and January.
5-day outlook — bearish
30-day outlook — bearish-neutral
90-day outlook — bearish

