Summary for week of July 25 – 29
- Stocks to remain bullish after early week pullback
- Dollar mixed with possible gains early; Euro likely to test resistance at 1.45
- Crude to stay strong this week although subject to declines early
- Gold vulnerable to pullbacks early but strong gains likely after midweek
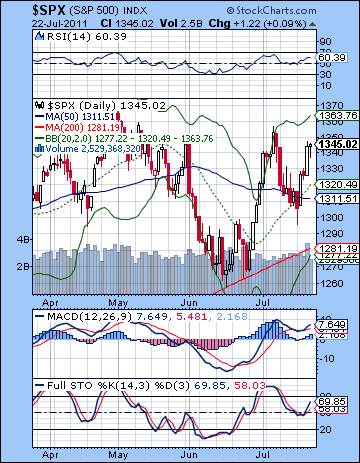 Another week, another bailout. Stocks moved higher last week as the EU agreed to reschedule Greek debt and underwrite another $200 Billion in that troubled Mediterranean country. The Dow climbed almost 2% closing at 12,681 while the S&P500 finished the week at 1345. While I expected some upside last week, I was not fully convinced the market could hold onto gains into Friday. As expected, the early week was bearish as Monday’s Mercury-Rahu aspect saw the SPX briefly trade below 1300. I thought we had a decent chance to test support at 1300 in the early week and that view was borne out by this move. I had been somewhat uncertain whether the down move could carry into Tuesday since I thought the midweek would generally be higher on Mercury’s entry into Leo. With support tested on Monday, the market reversed on Tuesday and this continued for the rest of the week. I thought we might go as high as 1330, so I underestimated the bullishness here, especially since Friday was not very bearish at all on the Mars-Ketu aspect. Without any late week sell-off, markets retained their fairly lofty levels.
Last week offered more evidence for the lunar cycle as interim lows have tended to occur near Full Moons with highs occurring two weeks later near New Moons. The Full Moon of Friday July 15 was just three days before Monday’s low. The next New Moon is due on Saturday July 30 so that somewhat increases the likelihood of an interim high occurring around that time. As I’ve noted previously, this cycle isn’t foolproof, but it is a useful guide and describes at least some of the price variation across time. The other astrological ingredients to the overall picture involve the interaction of Jupiter and Saturn. With neither planet forming any major aspects at the moment, the market seems somewhat range bound here as it meanders between recent support and major resistance from its recent high. Jupiter’s penchant for borrowed money and pain-free bailouts is running alongside Saturn’s desire for austerity and spending cuts. Not surprisingly, the latest EU bailout package includes elements of both as some Greek bondholders will suffer losses. The US debt ceiling deal is likely to include a similar blend of the symbolisms of both these planets. Cuts are likely to be substantial, but they may not be as draconian as some would like, especially in the GOP and the credit rating agencies. This is another reason why I am expecting some market disappointment from the debt ceiling deal. Default is very unlikely, but the retrograde station of Mercury that occurs on the same day does not augur well for a successful deal that will be cheered by the market. The presence of the Mercury-Neptune opposition suggests there could be some confusion about the exact terms or implications of the deal, and this could have some analysts wondering about the reliability of US treasuries as a safe haven investment or indeed the US Dollar as world reserve currency. This is one reason why I am expecting some consolidation if not an outright correction in early August.
 The bulls took the ball and ran with it last week as support was tested early on before reversing higher. The main support level of 1285 from the rising trend line was not closely tested as buyers moved in at 1295. The advance stopped at a key level — the falling trend line that connects the all-time October 2007 high with the May 2011 high. I would not expect this line to offer that much resistance, so a break above is not necessarily a big shot in the arm for the bulls. It would be bullish of course, but it would not be a game changer. Another way of looking at last week’s gains is that the indexes are moving up to back test the rising trend line off the March 2009 low. The early July high was a test of this resistance line, and therefore a somewhat higher high in the coming weeks could be a second test of this same trend line resistance. This is the way one can interpret any summer rallies from a longer term bearish perspective — they are back testing this rising trend line.
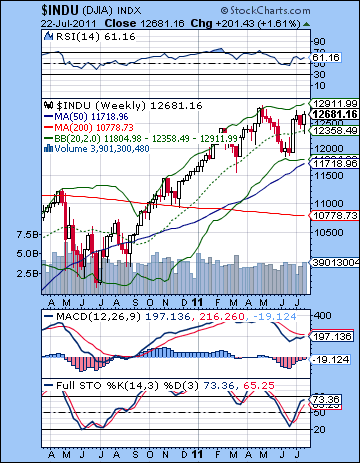
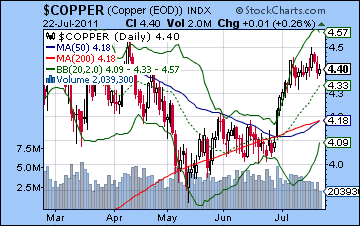
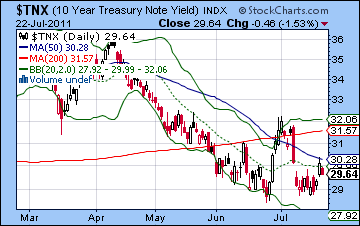
But we don’t want to fall prey to bearish tunnel vision either. While the H&S pattern is still roughly intact assuming we don’t move higher, most of the indexes have a bullish IHS pattern around the June low. The SPX has a downward sloping neckline at 1300-1310 with an upside target around 1340-1350. In other words, we have already fulfilled the IHS pattern as the market looks for new direction and perhaps takes a run at previous highs. Daily stochastics (69) are not yet overbought so that is a point for the bulls that this rally could go further. The SPX has also yet to hit the upper Bollinger band suggesting there is more room to the upside. RSI (60) similarly has a lot of space left before becoming overbought. On the other hand, we can discern a series of declining peaks in this indicator, suggesting a possible slackening of momentum. In terms of support, the entire bull market rally needs to stay above the 200 DMA at 1281 and the rising trend line at about 1290. Above that, there is likely support found near the 50 DMA at 1310. I would not rule out a short term pullback to this level before another push higher. The weekly Dow chart tested the 20 WMA last week and is moving higher once again. This increases the odds of another move to the upper Bollinger band at 12,911. Stochastics (73) have further to rise before becoming overbought. This is another piece of evidence for the bulls. Meanwhile, copper is pushing up against resistance now as it has made another lower high with respect to its all-time high in February. A new high would obviously be bullish, but the odds favour some consolidation here, at least back to the 50 and 200 DMA at 420. Despite last week’s rise in equities, treasury yields barely budged, perhaps reflecting ongoing uncertainty in the Eurozone. While yields may have bottomed for now given the inability to break below 2.90% , we cannot say that the bond bears are in control either. A bearish move in treasuries would occur when 3.1% is again breached on the upside. My sense is the next move in yields will be to the upside, so this will likely be good for the Euro and good for stocks.
 This week will likely see the bulls retain control with more upside possible. That said, there is the likelihood for some downside early in the week as Mars enters Gemini on Monday. This is arguably the most bearish looking day of the week as Mars can be a bearish influence whenever it changes signs. The negative energy from this Mars move will be echoed on Wednesday as the Moon conjoins Mars. This may spread some of the bearishness into Wednesday, although I doubt it will result in three consecutive down days. Two down days are somewhat more likely with Tuesday acting perhaps as an buffer. The bulls are more likely to assert themselves in the second half of the week as Wednesday’s Sun-Uranus-Pluto alignment could really lift sentiment significantly. And yes, I realize that Wednesday could either be strongly up or down, so I am fudging a little there. I would lean towards a bullish outcome, however, given all the influences in play. Mercury-Venus-Neptune could also be bullish on Thursday and perhaps into Friday. Friday looks harder to call, however, with some weakness creeping in by the afternoon. While there may well be two up days and two down days with one flat day, the up days look stronger here so they are more likely to set the pace and take the market higher. With the bearishness more likely to occur in the first half of the week, we could easily revisit 1320 and the 50 DMA by Tuesday or Wednesday, with 1350-1360 quite possible by Friday. Friday would take us just one day short of the New Moon and the end of the lunar cycle. This is another reason to expect the market will have an upward bias through most of the week and that a reversal lower will only arrive in early August. But is this THE top? Right now, I’m not sure. Usually tops are marked with several simultaneous aspects and we don’t really have that here. That either means that the top for the year occurred in early May (1370) or the top will occur in late August closer to the Jupiter retrograde station.
 Next week (Aug 1-5) may see some fallout from the debt ceiling deal. As I said, I think some disappointment is likely, whether it is simply the result of selling the news or because the deal doesn’t address the market’s chief concerns. The deadline is Tuesday August 2 so I would expect more weakness to manifest before or immediately after that date. The late week Venus-Jupiter aspect looks more positive so we could see some attempt to retrieve gains from the previous week. I would expect this rally attempt will not be strong enough to recapture the previous week’s high. The following week (Aug 8-12) looks more bearish with some sharp declines possible. The culprit here is the Mars-Uranus-Pluto t-square (all planets arranged at 90 degree angles from each other). This configuration symbolizes a violent and potentially shocking event that could move markets lower. The most negative day would probably be Tuesday or Wednesday. This would allow for the possibility of a rally to begin by Thursday or Friday of this week (11th or 12th). The big question is whether support will be broken at 1290-1300. It’s difficult to say, although I would err on the side of caution here and expect support to hold. If support does hold, then it improves the chances for a higher high in late August, perhaps to SPX 1400. But if support does not hold and the SPX revisits 1250 or so, then the rally will be fatally wounded. The subsequent rally leading up to the Jupiter retrograde station on August 31 would then be yet another back test of support, with a upside target of perhaps 1320-1340 depending on the exact time frame. I tend to think Bernanke and the bulls have a few tricks up their sleeve left, so a run to 1400 may be the most prudent expectation. This would set the stage for a September-October swoon on the Saturn-Ketu aspect. This looks like a high probability downside move. The only question is: how low might we go? That trend line support near the 200 DMA will almost certainly be taken out by then (if not already done in the August shock event). And we could see a much larger move down of about 15-20% here. This would equal about 1200-1250. The rebound rally in late October and November could then appear as a back test that fails to equal the previous high, perhaps topping out. Another leg down to a lower low would likely occur in December and extend into early 2012.
5-day outlook — bullish SPX 1350-1360
30-day outlook — neutral-bullish SPX 1330-1360
90-day outlook — bearish SPX 1150-1250
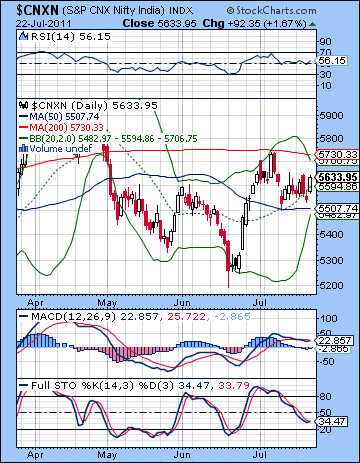 Stocks enjoyed a modest rise last week as investors welcomed the news of a new EU bailout for Greece. Despite trading in a fairly narrow range, the Sensex rose 1% closing at 18,722 while the Nifty ended the week at 5633. This bullish outcome was not unexpected, although I thought we might see more late week selling on Friday’s Mars-Ketu conjunction. As expected, Monday was lower on the Mercury-Rahu aspect while Tuesday also followed the game plan when stocks reversed higher and closed above resistance at 5600. I thought there was a good chance we would see a close above 5600 at some point along the way here. The bullishness continued into Wednesday and Mercury’s entry into Leo although the bulls could not hold onto the reins by the close. Thursday was lower as anticipated with another close below 5600. Friday’s gain was surprising, although the close above 5600 was perhaps more in line with my technical expectations.
The latest EU bailout of Greece appears to be extending the celestial stalemate between spendthrift Jupiter and disciplined Saturn. The bailout requires more borrowed money from richer EU members like Germany and France to keep the Greek economy afloat while at the same time demanding that Greek bond holders take a haircut. In other words, both the carrot and stick are being deployed here to prevent any further debt contagion. The ongoing presence of Jupiter in the picture means that the final de-leveraging of all that bad debt will be delayed for another few months. The bad debt is still out there, but instead of counting the losses, we have another Jupiterian attempt to inflate. This more or less encapsulates the strategy over the past two years or more since the meltdown of 2008. Some of the bad debt got written down, but not all of it. The various stimulus programs of the RBI, the ECB and the Federal Reserve have managed to prevent a final washout of investors for a while, but I would suggest that they will be unable to do so in the long run. I have noted in previous newsletters, the longer term aspects involving Uranus and Pluto still suggest a mostly bearish orientation until 2013. This is reason enough to remain cautious as the developed economies of the West attempt to rectify their problems. As long as Europe and America remain indebted, they will be less active consumers of Indian goods and hence India will not be able to readily expand its export sectors. Indian equities are therefore likely to be subject to significant corrections for the foreseeable future, at least until this Uranus-Pluto aspect has passed. While it’s possible that we could see some medium term bullish trends take root, they are unlikely to produce a sustained rally. In other words, it is likely too early to undertake a buy-and-hold strategy.
 From a technical perspective, the bulls won the battle last week as they pushed the Nifty above 5600 not once, but twice. And yet the bulls are likely feeling somewhat uncomfortable here as the falling trend line at 5700 has not been tested. The same goes for the 200 DMA (5730) which is now looming as a critical resistance level. As long as the Nifty stays under that level, the market will be range bound and buyers will not expect much upside. Rallies are likely to be fairly short-lived as jittery bulls exit long positions fairly quickly. The 5700-5730 level is even more important because it coincides with the upper Bollinger band (5709). We can imagine that bears will be anxiously awaiting to short any rallies that approach this level. Stochastics (34) are down and close to oversold levels, suggesting that bulls could have a decent chance to crack 5700 after one or two more down days this week. MACD is looking somewhat weak, however, as it is declining and in a small bearish crossover. We will see if 5600 acts as support this week. More than likely the stronger support level will be around the 50 DMA at 5500.
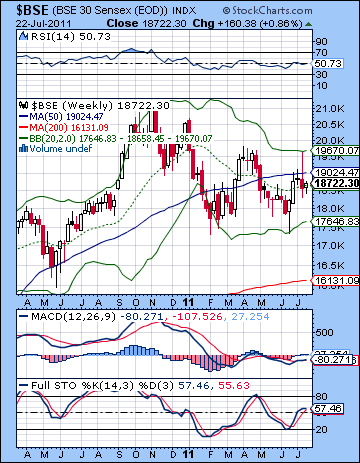
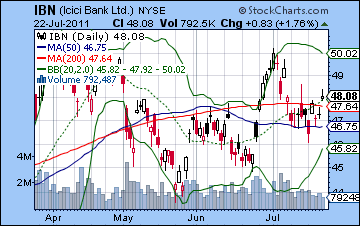
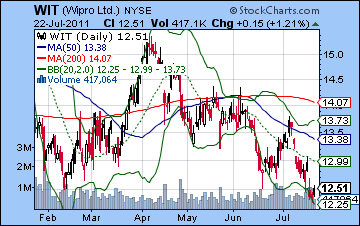
The BSE weekly chart aptly shows how the market is quickly approaching a decision about the current economic environment. A triangle pattern is forming here with a narrowing range. While bulls have now managed to boost price above the 20 WMA, the 50 WMA is becoming resistance. The indicators do not offer much to either the bulls or the bears as they are stuck in the middle range. While bulls could argue that Stochastics (57) is moving higher and has further to go, bears can point out that it is on the verge of a bearish crossover which would coincide with a move lower. In any event, longer term support is likely found near the 200 WMA at 16,000. ICICI Bank (IBN) tested the 50 DMA on Monday’s decline and actually closed below it. But it then reversed higher and climbed back to finish above the 200 DMA. This was a bullish move, although one must be cautious not to give too much importance to these moving averages. They are only a rough guide. The lack of direction of this stock is reflected in the fact that both the 50 and 200 DMA are flat. Only a close above the previous high of $50 would give the bulls something to really celebrate and could anticipate a larger move higher. Certainly, the current ascending triangle pattern is bullish, although I wonder how it will play out given my bearish forecast for the market as a whole. It was another bleak week for Wipro (WIT) as the February lows were taken out midweek. This is a very bearish development and despite Friday’s rally back up to resistance, bears may look forward to lower lows in the days and weeks ahead.
 This week looks less bullish than last week, although there are still some bullish influences in the mix. The early week looks like it could see some declines. Monday’s entrance of Mars into sidereal Gemini could be bearish. That said, there is a possibility that the bearish impact from this aspect could be delayed until Tuesday. If Monday happens to close higher, then that would increase the likelihood that Tuesday will be lower, perhaps significantly so. Wednesday is somewhat more difficult to predict. On the bearish side, the Moon will conjoin Ketu and Mars. But a very powerful alignment forms involving the Sun, Uranus and Pluto. This is likely to boost the markets worldwide on Wednesday and perhaps for the rest of the week. It seems likely it will be bullish for Indian markets also. Just when it begins is harder to say. I would expect Thursday to have the best chance of a large gain. Friday also looks bullish on the Mercury-Venus-Neptune aspect. So while Thursday and Friday are likely to be net positive — and strongly so — Monday and Tuesday combined seem net negative, with Wednesday casting a sort of deciding vote. I would lean bullish with the possibility of a reversal higher into the close. A close below 5600 seems probable before Wednesday, and I would not rule out 5500 also. But the late week looks bullish enough that the Nifty stands a good chance of finishing higher than current levels. It seems doubtful that we would rise all the way to 5700 but it is possible, especially if the early week retracement is modest.
 Next week (Aug 1-5) looks more bearish. Nervousness over the upcoming US debt ceiling deadline could spook global markets and India is unlikely to be exempt from any fallout. Monday’s Sun-Jupiter aspect could lift markets for a while, but some of the positive sentiment may ebb by the close. The problem here is that Mercury will be lining up opposite Neptune just as it turns retrograde on Wednesday. Mercury-Neptune aspects are often difficult so this could signal some significant retracement lower. I would expect a weekly close below 5600 here, and would not be surprised to see a close below 5500. The following week (Aug 8-12) also looks bearish as Mars forms a hard aspect with both Uranus and Pluto. This three-planet configuration is quite bearish and may represent some outbreak of violence somewhere in the world. It is likely to have market significance with a possible low formed on the Thursday or Friday (11-12th). After that, I am expecting some kind of rally to take place. This could last until the Mars-Saturn aspect on 25 August at least. There is a possibility that this period around the 25th is only a two day decline and that the market will rally higher all the way into the first days of September. September and October still looks mostly bearish, however, as the Saturn-Ketu aspect is likely to mark a significant breakdown of support. 4800 should hold, but it’s unclear if the correction will stop at 5200. A rebound rally is likely at the end of October and into November as Jupiter again forms aspects with Pluto, Uranus and Neptune. This is likely to be a lower high than the August high. By December, however, the bears will back in force as Saturn opposes Jupiter. The next move down could be quite sharp and may extend into January.
5-day outlook — bullish NIFTY 5650-5750
30-day outlook — neutral-bullish NIFTY 5500-5700
90-day outlook — bearish NIFTY 4800-5000
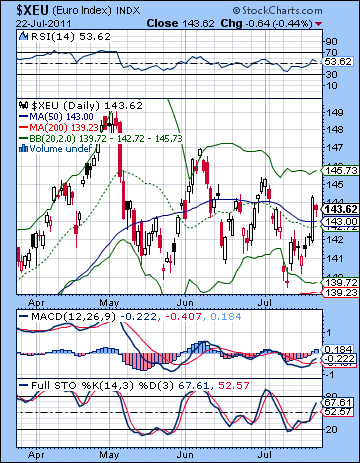 As the EU cobbled together yet another bailout for Greece, the Euro put in a winning week rising above 1.43 against the Dollar. The USDX sank below support closing at 74.2 while the Rupee strengthened to 44.4. This bullish result for the Euro was not unexpected, although the modest character of the late week decline was surprising. Monday was lower on the Mercury-Rahu and we got the expected retest of support of 1.40. Then the bulls went to work as it rose through Thursday. The gains were somewhat greater than I had anticipated. Friday was lower, although only modesty so. While the Euro has moved up to its resistance line from the recent highs, it has yet to break above. Until it does, it will remain vulnerable to declines since it is forming a bearish descending triangle. The Dollar’s breakdown of support was bearish, but without a corresponding breakout above that falling Euro trend line, the Euro could be mired in this range bound middle zone. A break above this line would be bullish for equities as it would signal the rebirth of the risk trade. More upside is possible if we look at Stochastics (67). They are not yet overbought and are rising sharply here. MACD is in a bullish crossover and we can discern a positive divergence with respect to the two previous lows. A close above 1.45 would suggest that the Euro could make another run up to 1.50 before a steeper correction occurs. Failure to break above 1.45 would indicate that another test of support at 1.39 is close at hand. We have horizontal support at 1.39 as well as the 200 DMA and the lower Bollinger band. If that breaks down, then the Euro will be headed south in a hurry.
This week could see more upside for the Euro, although the early week may see a recovery in the Dollar. We could see the Euro retrace somewhat, but there is a good chance for gains later on in the week that could again seriously retest resistance at 1.44. Early August looks more bullish for the Dollar so it’s possible that we could see fake out and then reversal back down to 1.40. I would expect that support level to hold, however. We could see the low on the Euro sometime in the second week of August. The approaching Jupiter station at the end of August should be positive for the Euro since it’s bullish anyway and also makes a nice aspect to the Sun in the Euro horoscope. I would therefore expect another significant rally attempt into at least that falling resistance line. There is a good chance the Euro will break over resistance. It may climb all the way back to 1.50 by early September but then it would become vulnerable to a major decline. September and October should be unkind to the Euro with a possible breakdown of support at 1.40.
Dollar
5-day outlook — bearish
30-day outlook — bearish-neutral
90-day outlook — bullish
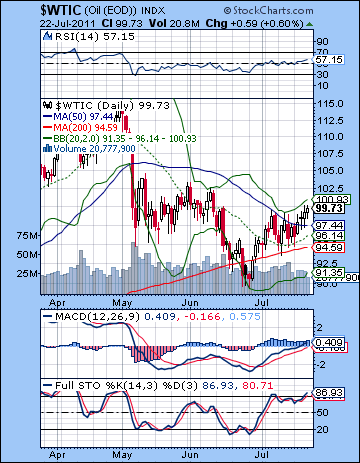 With the EU bailout of Greece, demand prospects for crude improved and the price rose 3% closing just a shade under $100. Monday turned out to be bearish on the Mercury-Rahu aspect but it was all bullish after that as the Sun’s entry into Cancer proved to be positive for the price of oil. This bullish outcome was largely in keeping with expectations although Friday did not see any decline at all on the Mars-Ketu aspect. Crude is once again threatening to break out of resistance here as it runs up against the upper Bollinger band. A close above $100 would lead to a push towards the next level of resistance at $103. Support is now offered by the various moving averages that are all converging around the $94-97 level. The bull market in oil is still very much a going concern as the 200 DMA is still rising. MACD has reached the zero line and is still in a bullish crossover. This suggests it has further to go. RSI (57) has been rising lately after being oversold and may also have more upside before hitting the 70 line. Stochastics (86) are already overbought, however, so this may increase the likelihood of some kind of pullback before another move higher. With the renewed weakness in the Dollar, crude seems set to move higher.
This week looks like a mixed bag for crude with the early week offering the possibility of a retracement lower. Mars’ entry into Gemini looks more bearish than anything and with the Moon coming to conjoin Mars into midweek, there is reason to expect that crude will test support before moving higher. I don’t quite expect we’ll see two consecutive down days on Monday and Tuesday but we could well be net negative. But this bearishness is likely to lift by the second half of the week with Wednesday as a possible turn date. The Sun’s alignment with Uranus and Pluto is likely to push up prices significantly so $101-103 may well be possible by Friday. Early August also looks mixed with Aug 1-2 looking somewhat bearish. Bulls will likely return in the second half of this week and erase any losses, however. Steeper declines are more likely in the second week of August around the 9-10th as Mars forms its nasty aspect with Uranus and Pluto. This will likely take crude back under $100 and it could well test support at $95-97. The second half of August will likely have a bullish bias so I would not be surprised to see crude again over $100. September and early October are more likely to bring another corrective phase with the possibility of a serious test of the 200 DMA. This could take prices below $90. A rebound is likely in late October and early November but December looks bearish again with the lows of the year more likely to occur at that time.
5-day outlook — bullish
30-day outlook — neutral-bullish
90-day outlook — bearish
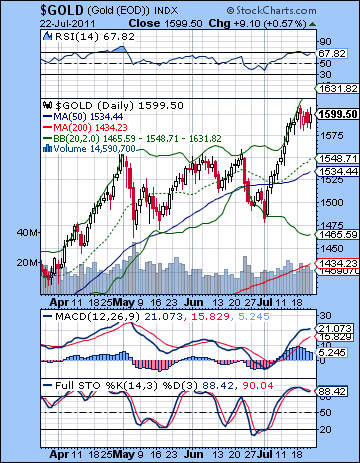 With anxiety growing surrounding the US debt ceiling negotiations, gold edged higher last week closing just a hair under $1600. This bullish outcome was unexpected as I thought there was enough bearish energy to take prices lower. While we did get some downside in the middle of the week, the long term momentum asserted itself once again and gold closer higher overall. If nothing else, he rise was less than the previous week’s. That is at least something given the tenacity of this bull market in gold. The large swath of investors seem as a keen as ever to acquire a currency hedge against all the Euro uncertainty and the devalued greenback and who can blame them. Bernanke is intent on inflating his way out of a recession no matter how much injury he does to the Dollar he is charged with defending. And yet while these currency concerns are unlikely to go away anytime soon, the potential problem with gold is that it may be susceptible to liquidation in the event that any second round of de-leveraging takes place. All those gold profits will be one of the first things to be sold off in case equities experience a significant correction. It seems quite late in the day to be acquiring gold as it’s very overbought at these levels. The daily (67) and weekly (68) RSI up nudging up against the 70 line yet again. Stochastics (88) are also overbought although they have come off their recent high. MACD is still in a nice bullish crossover, but it is showing signs of flattening out. A pullback may be just around the corner here with the 20 and 50 DMA looking like likely candidates of support around $1530-1545. The key rising trendline comes in a little below that at $1520. A pullback to that line would likely bring new buyers as gold would undertake another rally to higher highs.
This week looks mostly bullish although we could get an interesting sample of some negativity on Monday or Tuesday with the Mars ingress. The Sun’s aspects with Uranus and Pluto on Wednesday and Thursday look strong enough to offset any previous pullback. The end of the week looks similarly bullish for gold as Venus is in aspect with Mercury. So there is a good chance for a close above $1600 this week, perhaps significantly so. The first week of August could see some choppy trading with moves possible in both directions. I’m not expecting a huge sell-off here but we could get an inkling of it. The second week of August looks also looks like it could be bearish as the Mars aspect could see a sell-off in most assets. Any corrective move we see in the first half of August is unlikely to break below key support from the rising trend line. The bulls will probably take control of the market in the third week of August and run prices back up towards their previous highs. But the Mars-Saturn aspect on Aug 25 could mark a significant dip in the gold that might finally break the momentum of the rally. After some sideway movements, the second half of September looks quite bearish on the Saturn-Ketu aspect. This could well bring the first breakdown of that support line.
5-day outlook — bullish
30-day outlook — neutral-bullish
90-day outlook — bearish

