Summary for week of August 15 – 19
- Stocks should rebound further this week on Sun-Venus-Mercury conjunction
- Dollar may weaken on restored optimism; Euro looks stronger
- Crude more bullish into midweek; possible weakness by Friday
- Gold should be bullish as Sun and Venus enter Leo
Summary for week of August 15 – 19
- Stocks should rebound further this week on Sun-Venus-Mercury conjunction
- Dollar may weaken on restored optimism; Euro looks stronger
- Crude more bullish into midweek; possible weakness by Friday
- Gold should be bullish as Sun and Venus enter Leo
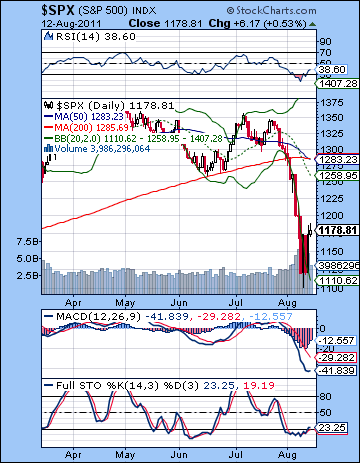 It was a nausea-inducing ride in the markets this week as stocks stepped back from the abyss following the Fed’s promise on Tuesday to keep interest rates at zero until 2013. After gaining or losing 500 points on four straight days, the Dow wound up losing less than 2% closing at 11,269 while the S&P 500 finished the week at 1178. Wow! I had expected something crazy like this to transpire given the nasty Mars-Uranus-Pluto alignment and I was not disappointed. The shock, panic and declines were very much a reflection of basic astrological principles as the bearish aspects played out more or less as expected. I thought we would close below last week’s lows of 1165 and we did on two different days. I also thought there was a decent chance for 1120 and we actually saw Monday and Wednesday closing exactly at that key support level. It was also gratifying that the market did generally rebound from Wednesday’s low in the latter half of the week although to be honest, the extent of the snap back rally was a little surprising.
But now we have witnessed this sharp correction, is it enough to say we are in a new bear market or could the market somehow recover and recapture old highs? Bear markets are typically measured as declines that are greater than 20%. As it stands now, the main indexes have corrected almost exactly 20% while the broader indexes are a little deeper in the red. So there is some interpretive wiggle room for both bulls and bears to continue to believe in their totemic animals as further upside this week would allow bulls to say that the correction was over. Astrologically, however, Saturn still looks like it is favoring the bears for the next month or two. As we have seen, Saturn’s growing strength ahead of its aspect with Ketu has correlated with the current correction. Other planets have also played a key role. We should also recognize that the correction can be more immediately explained in terms of the Mercury-Neptune opposition and the Mars-Uranus-Pluto alignment. These patterns occurred in close sequence and provided the spark to release some of that deeper energy in the Uranus-Pluto square. Last Friday’s surprise downgrade of US debt from AAA to AA+ by the S&P ratings agency reflects some of these different planetary patterns well. A stricter view of debt obligations and rising risk from excessive levels of debt is exactly what one would expect from a strong Saturn. Saturn does not like to take chances and is not optimistic about the future. Its pessimism and caution usually coincides with a reduction of risk and a preference for cash or some other safe haven such as gold. But the larger historic importance of the S&P downgrade also cannot be underestimated. This is a potential turning point in world history — at least on a symbolic level — where the US is increasingly seen as on the decline as the world’s leading economy and reigning superpower. While it retains military superiority for the moment, its economy is stagnating and it is currently on an unsustainable path. This kind of fundamental reorganization of the world economy is embodied in the ongoing Uranus-Pluto square aspect. I have been writing about the long term impact of this slow moving aspect for the past couple of years as I expect it will highlight a significant disruption and shift in the balance of power around the world. While the aspect is in effect from 2010 to 2013, we will likely see some of these historic changes play out right before our eyes. Many people have talked about the inevitability of the decline of the US hegemony ever since the Vietnam War, but this debt downgrade was an especially symbolic moment that aptly illustrated that argument.
 The bears inflicted significant technical damage on the bull market as the indexes were brought to the very cusp of the definition of a bear market as losses flirted with 20% since the May high. The support from 1120 matched the 50% retracement from the all-time high to the March 2009 low. The coincidence of these levels offers the possibility of more support going forward. If 1120 is broken, I would not expect 1103 to offer any support. It would seem more likely that the SPX would hit 1080 initially and perhaps as low as 1014 which is the 2010 low and the 38% Fibonacci retracement level. I am not expecting 1014 to happen this week, although it could very easily happen in September and October since I do expect more downside in this overall bear move. More immediately, 1170 held quite well in Friday’s trading and that could be tested on Monday. If it breaks, then the bulls could be in trouble as it would suggest that the rebound rally might be an illusion. I think there is likely another layer of support around 1150 which will hold in the event of some bad news over the weekend. In the event of an up move, resistance is likely around 1200 at first, and then 1225 or so. There will likely be some shorting opportunities for bears if the SPX rallies into this 1220-1270 area. 1237 is the 50% retracement level from the May high to last week’s low. 1268 represents a 61% retracement. Both are plausible candidates for a reversal lower.
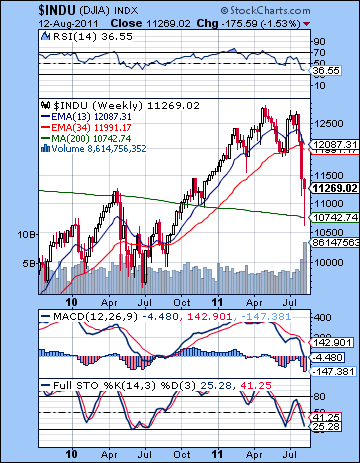
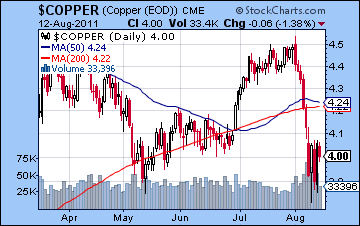
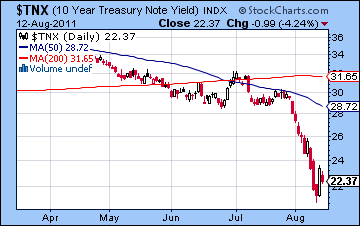
The daily chart is less oversold than it was last week so that ironically opens the door to more downside. RSI has risen to 38 while MACD histograms are shrinking suggesting that the down move may be ending. Stochastics (23) are venturing higher out of the oversold area. We also have a "death cross" of the 50 and 200 DMA which may bolster the bearish case, although this is not a very reliable indicator. More bearish is the fact that the 200 DMA is now slightly sloping downward and offers more evidence that we have entered a new bear market. The Dow weekly chart offers more evidence that the market hasn’t headed over a cliff yet. That 200 WMA has provided both resistance and support in 2010 but last week’s lows appear to have tested it cleanly and bounced back up. From a momentum perspective, the crossover of the 13 and 34 week EMA is another useful measure. While we came extremely close to a bearish crossover in 2010, these moving averages rebounded and the market climbed higher. In other words, they did not give a sell signal. Despite the ferocity of the recent correction, these averages also have not yet crossed over on a weekly basis although they are very close indeed. By comparison, we did see a 13/34 bearish crossover in early 2008 (i.e. the 13 moved underneath the 34) when the market fell apart and they stayed that way for the better part of a year. They produced a buy signal in June 2009 after the market bottomed. Copper mimicked the up and down action last week but significantly did not break below the May low. While it is still on the wrong side of the 200 DMA, it could still very easily rally back to 420. Only a close below 385 would suggest a larger move lower was at hand. If and when it does, it will be another sell signal. Of course, the other big story last week was the treasuries. Despite the downgrade, investors continued to flock to treasuries as a safe haven as 10-year yields were driven down to an astonishing 2.1%. This is only a hair’s breath away from the historic lows during the meltdown of 2008. Barring some total armageddon scenario, rates cannot fall much further than this, especially with the Fed’s preference for inflation and increasing liquidity. Professional gloomster Marc Faber called US treasuries the short of the century at these levels and he may well have a point. But this also suggests a divergence with stocks. If treasuries fell to 2% in 2008 when the SPX was at 800, the current level of 1100-1200 is either too high or treasury yields will have to rise. One of these markets has it wrong.
 This week offers the prospect for a gradual return to stability in the markets although I am still expecting some sizable moves. Generally, I would favour more upside this week around the triple conjunction of Sun, Venus and retrograde Mercury that takes place on Tuesday and Wednesday. These are a bullish trio of planets that ought to induce some more buying. However, there is a possibility for this normally bullish pattern to be short-circuited by an aspect from Rahu (north lunar node). This is arguably a stronger risk on Monday so I might be more inclined to expect some downside then. But even there, I have to admit that I am less confident about the direction this week. It’s entirely possible we could get more downside, especially if the market hits a resistance level on Monday or Tuesday, e.g. 1200 or 1220. I am still leaning bullish, however, although I’m less certain of the outcome. In that sense, technical analysis may provide more useful clues than astrology here. A Mars-Jupiter aspect on Wednesday would appear to boost risk appetite midweek that boosts stocks further. The late week looks less bullish in any event, so I would think the odds increase for downside on Friday as Mercury backs into Rahu’s troublesome aspect. I would be surprised to see another 500 point day in either direction here, so that is perhaps the least likely outcome. We could see Monday lower and if the market stops at a key support level like 1170 or 1150, then it could be a basis to rally to 1200 and above by Wednesday or Thursday. Some technicians have suggested that a breakdown of 1170 would invite an immediate retesting of last week’s lows at 1120. While possible, I don’t quite see that as likely. There is some chance we could see 1220 this week although that may not hold by Friday. Overall, then, I would be very cautiously bullish this week but retain a bearish stance for the medium term as lower lows are the mostly likely outcome. Any rallies that occur here should be quite shortable.
 Next week (Aug 22-26) looks more bearish as Mars approaches its aspect with Saturn. This is likely to end any preceding rally attempt although whether we break support at 1100 (10,700 on the Dow) is unclear. Its definitely a nasty combination of planets so anything is possible. And yet Mars is moving fairly quickly so the resulting affliction is unlikely to last very long — perhaps two or three days at most. This doesn’t put this affliction in the same league as the ones we’ve seen in the past few weeks. Mercury stations and returns to forward motion on Saturday while in aspect to Rahu so that amps up some of the potential damage for the second half of the week. Obviously, a breakdown of 1120 would be quite serious from a technical point of view. Still, that does not look like a probable scenario at the moment. The following week (Aug 29- Sep 2) looks like it starts bullish on the Venus-Jupiter aspect but the late week turns bearish again on the Mars-Rahu aspect. I would not be surprised by a bullish week here, although that is up in the air. Early September looks reasonably positive but I am expecting another move lower by mid-September as the Saturn-Ketu aspect begins to bite. A key accomplice in this down move should be the Euro as its horoscope is afflicted in September. If the Euro breaks support at 1.40 as I expect it will at this time, then it could hasten a steep decline in stocks. Even if 1100 has held up to September 15, the subsequent decline looks likely to take it down to 1010 at minimum. In other words, another 20% loss is quite likely here, and I would not rule out something larger. Of course, if the market has temporarily found support at 1250 or above, then the Sep-Oct decline may only retest 1100 perhaps and set the stage for a powerful rally starting in the second half of October and extending into November.
5-day outlook — bullish SPX 1200-1220
30-day outlook — bearish SPX 1100-1150
90-day outlook bearish SPX 1050-1150
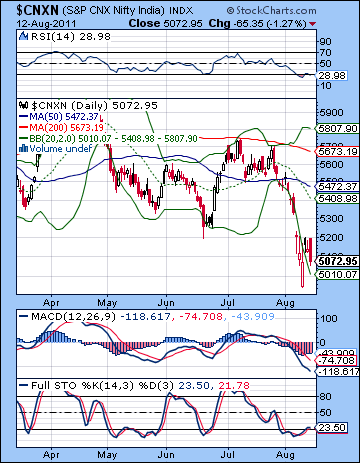 Stocks extended their losing ways last week as mounting anxiety over the US and European debt situations overshadowed domestic factors. The Sensex fell on four out of five sessions closing below 17K at 16,839 while the Nifty finished the week at 5072. This bearish outcome was in keeping with expectations as I thought the tense alignment between Mars, Uranus and Pluto would be troublesome for most markets. Mumbai managed to escape the worst of it although the early week was quite negative ahead of the exact aspect on Wednesday. Ironically, the only up day occurred on Wednesday, and this was at odds with my forecast. Nonetheless, the overall bearish tone from the Mars aspects did spillover into other days. I thought there was a good chance we could test support at 5100 and even 5000 and we did see a brief piercing of 5000 in Tuesday’s tumultuous session.
Saturn continues to rule the roost these days so I am still expecting the bears to prevail in the medium term. Saturn’s pessimism and caution has brought out the bond vigilantes in Europe as Italy and Spain have seen their yields spike higher as there is growing skepticism about their ability to service their high levels of debt. When Saturn is strong in the sky as it is now there tends to be a half-empty attitude about the future as worries accumulate about all the various downside risks that the market faces. The shocking S&P downgrade of the US debt last week confirmed this powerful Saturn energy as the rating agency no longer believed that the US was risk-free due to a burgeoning debt and an increasingly dysfunctional political system. Saturn’s loss of faith is likely to continue into the fall as it approaches its aspect with Ketu in September. At an even more fundamental level, the S&P downgrade symbolized a larger structural change in the world economy as America was knocked off it perch. It is still the world’s largest economy, but it is now seen as less reliable and perhaps unsustainable. It may well be that its best days are behind it as it has moved past its apex of military and economic power. Observers have postulated that the US started on its descent years ago, perhaps as early as the Vietnam War in the 1970s. But this debt downgrade may go down in the history books as another key moment in the life cycle of this modern empire. This is kind of major change or shift that I have been suggesting would occur from the Uranus-Pluto aspect. This long term aspect from 2010 to 2013 may well correlate with major shifts in the balance of economic and political power in the world. The downgrade of the US was likely a manifestation of this energy as the developed economies of the West are burdened by debt and slow growth while the dynamic economies of Asia are on the rise.
 It was a bad week technically for the market as the Nifty could not sustain any kind of move above 5200 and close the gap. Wednesday’s rally stopped dead in its tracks at 5200 and was another sign that the bears continue to have firm control here. The Nifty also fell to a new 2011 low and thus fulfilled the bear market requirement of a pattern of lower highs and now lower lows. Stocks are now more than 20% off their Nov 2010 high and thus satisfies the condition of a bear market. Even if bulls can rally this week, they may only fill the gap at 5300 before selling resumes. 5320 is therefore important resistance. A stronger rally attempt could test resistance at 5400 and the 20 and 50 DMA. This is perhaps best seen as an intermediate goal for the bulls. The indicators still look oversold as the RSI (28) remains below the 30 line and Stochastics (23) has barely edged above the 20 line. This should give bulls at least some hope that a technical bounce is at least more likely in the near term. But as ever, the 200 DMA is sloping downward and thus casts a pall over the whole chart. Only a sustained rally that rises above this line will reverse this medium term bearish trend.
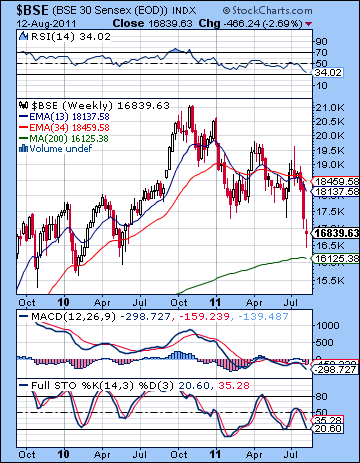
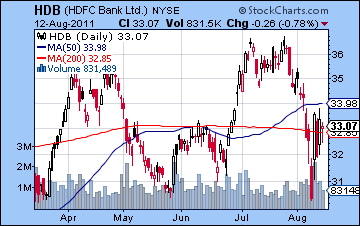
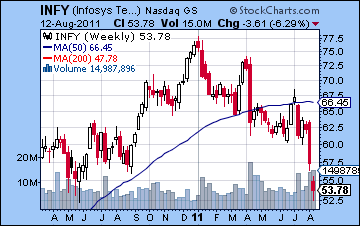
The weekly BSE chart illustrates the depth of the problem. Last week’s low moved very close to the 200 WMA at 16,125. I have mentioned this line as a possible support level for the market, although there is nothing to suggest that it act as reliable or long lasting support. It has underlaid the bulk of the rally since May 2009. A move below this line and it will return the Nifty to much lower levels with the increased possibility of revisiting the 2008 low of 2500. We can see how much of 2011 has generated close intertwining of the 13 and 34 EMA. This duo of moving averages is often a good indicator of a sustained rally and generates buy and sell signals when they cross over. May 2009 generated a buy signal as the 13 week EMA crossed above the 34 week EMA. The rally stayed intact while this stacking of the moving averages remained in place all the way until early 2011. The correction in early 2011 saw the 13 EMA cross below the 34 and thus generated a sell signal. These two lines have intermingled since then without a clear pattern, although with a mostly negative slope. They remain in a slightly bearish crossover situation now. The further apart they diverge, the more likely we will see lower prices going forward. Stochastics (20) and RSI (34) are both moving lower but still could fall further in the event of a major sell-off. Global banking shares got a boost from the Fed’s promise to keep rates low until 2013 as HDFC (HDB) rallied smartly off Monday’s lows and put in a positive week. It was also significant that Monday’s low stopped at the May low and thus support may be holding at this level. While a test of resistance at the 200 DMA seems likely, it is unclear if HDB can rally back to previous highs soon. Infosys (INFY) had a very tough week falling more than 6% on the US exchange. Worse still, it matched its low from all of 2010 and reflects how this company has underperformed the market. The silver lining perhaps is that it may have found support at this level, so rally attempts can be more likely now. A close below $51-52 could be quite bearish as it may trigger sell stops and lead to a larger and faster decline.
 This week looks decidedly more stable than last so there is a decent chance for some gains. The main aspect is the triple conjunction between the Sun, Venus and Mercury that occurs on Tuesday and early Wednesday. These are mostly bullish planets that should be able to lift sentiment and encourage buyers to take some risks. The probability of a gain is somewhat reduced by the presence of Rahu’s aspect on these three planets, however. Monday’s closure suggests that the market will be less susceptible to any early week global declines. Indeed, Rahu is close enough here that it could end up reversing the polarity of these planets from positive to negative in a blink of an eye. Nonetheless, I would still lean towards gains to prevail this week especially around the conjunction. Thursday’s Mars-Jupiter also looks like a bullish aspect so that somewhat improves the probability of gains as we move into the second half of the week. Friday looks less positive, however, as Venus is now separating from the Sun and Mercury comes under the aspect of Rahu. Declines are more likely here at the end of the week although I would tend to think they won’t be enough to erase previous gains. If Monday is lower, it is unlikely to be substantially lower and support from last week’s low should hold. The upside from this triple conjunction could be significant so a gap fill at 5300-5350 is possible. Friday’s decline does not look serious so the Nifty could finish somewhere between 5200-5300. I would not expect the rally to run all the way to the 50 DMA at 5450, although if Monday ends higher, then that becomes a somewhat more likely outcome.
 Next week (Aug 22-26) looks more bearish as Mars approaches its aspect with Saturn. While we could see a gain Monday or Tuesday, the Mars-Saturn aspect is slow enough that it could manifest across several days. It makes its closest pass on Thursday. There is quite a bit of bearish potential here and a 5% decline is quite possible on the week. Larger declines are also conceivable depending on where support is. Even if the bulls make a good show beforehand and take the Nifty up to 5400, we could easily revisit 5000 by August 26. 4800 is not out of the question here either. The market could bounce briefly after that on the Jupiter aspects to Venus and the Sun. Even here, there is still the possibility that we will only get a feeble rally attempt that lasts into mid-September. This could conceivably attempt to recapture the 50 DMA at 5450 but I am skeptical if it will do so after the damage of the Mars-Saturn aspect. But as Saturn comes under the aspect of Ketu at the end of September, bears will likely return in force. Another decline that lasts into October is therefore probable. If we have not done so yet, then 4800 is very likely by October although I would not rule out 4000 at that time. Some kind of rally is likely to begin before the end of October, possibly as late as the 26th. Jupiter makes a number of aspects here lasting into November so there is good reason to expect some significant upside. But this looks like a bear market rally that runs up against resistance and then falls again to lower lows. Overall, Indian stocks are unlikely to be a good long term investment until 2012 at the earliest and possibly as late as 2013.
5-day outlook — bullish NIFTY 5300-5400
30-day outlook — bearish-neutral NIFTY 4900-5200
90-day outlook — bearish NIFTY 4600-4900
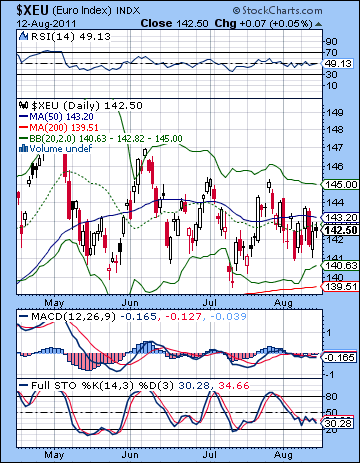 After a very up and down week, the Euro finished slightly lower as markets maintained a wait-and-see attitude towards the EU’s latest strategy of buying up Italian and Spanish bonds. I thought we could see more downside here as the ongoing debt crisis might provoke a flight to the Dollar. Well, it seems that gold and treasuries have that function all to themselves these days, as the Dollar is suffering the slings and arrows of the Fed’s outrageous attempts to inflate their way out of an inevitable recession. So the Euro did not really test support at 1.40 as it remained within an increasingly narrow triangle pattern. Eventually it has to break out of this pattern one way or the other. My guess is that it will breakout to the downside and begin a waterfall pattern down to 1.30. But that may take some weeks yet. 1.40 is the line in the sand here as the 200 DMA sits just below it at 1.395. Also we can see that the 200 DMA is now flattening out. This could simply be taking a breather after a long run higher. Or it may presage a move lower and a new bear market in the Euro. 1.45 is solid resistance in the event of an upward move, while 1.44 is lesser resistance. 1.44 may be quite doable over a day or two but it will not have any technical significance.
The Euro could be bullish this week as the Sun-Venus-Mercury conjunction is likely to boost optimism. Thursday’s Mars-Jupiter aspect will line up in aspect with the natal Sun in the Euro chart so that is another possible source of gains. I would be quite surprised if the Euro declined here, and 1.44 is a conservative upside target. 1.45 is also within reach and I wonder if there might even be a (false) bullish upside breakout. Next week’s Mars-Saturn aspect looks less friendly to the Euro, however, so some of those gains will be undone. At the same time, there is an absence of affliction to the Euro chart with that aspect so it is possible there won’t be much movement overall. There is therefore a chance that it will test 1.40 here, although I would not expect it to be likely. The Euro could tread water for the first half of September and it could even remain in that eternal Belgian Triangle (like the one in Bermuda but with better beer) between 1.40 and 1.45. The Saturn-Ketu aspect in late September therefore may be the event that shakes up the currency situation and takes the Euro lower into October. 1.30 is quite possible here although I would not be surprised to see it lower. After a rally into early December, the Euro will continue to fall — along with gold and other commodities — during the Jupiter-Saturn opposition from December to about February. 1.20 could be within reach at some point in Q1 2012.
Dollar
5-day outlook — bearish
30-day outlook — bullish
90-day outlook — bullish
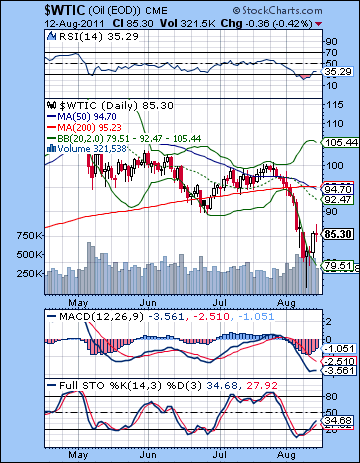 After a wild roller coaster ride last week as the world lurched from crisis to crisis, crude oil traded below $80 for the first time since 2010. And yet for all the panic and tumult, crude managed to recover most of its losses by Friday closing near $85. This bearish outcome was in keeping with expectations as I thought the first half of the week had the potential to test the $80 support level. Crude tested $80 on three straight days, including Tuesday’s piercing low to $76. While I allowed for a late week recovery, I did not quite expect it could regain all that lost ground. Nonetheless, crude seems to be entering a new phase as previous support levels look very far away indeed. The old neckline and the clustering of the 50 and 200 DMA near $94 is major overhead resistance now and will likely spark selling in the event that a rally reaches that level. RSI (35) is no longer oversold as is Stochastics (34). This suggests that a rally is more likely. MACD is still in a bearish crossover but histograms are shrinking suggesting the worst of the selling is over. If resistance is quite formidable above $90, support is still intact at $80. That said, there will likely be future attempts to challenge the piercing low at $76 and this could eventually lead to testing support at $70 which was the 2010 low. $70 seems quite doable before this corrective phase is over in October.
This week’s triple conjunction looks fairly bullish. The conjunction of the Sun, Venus and Mercury occurs in the first degree of Leo which hits the natal Futures chart is a fairly positive place. This adds to the likelihood for gains through the midweek. Monday could see some temporary weakness, however, although it is unlikely to last long. The late week may also be vulnerable to declines as Mercury comes under the influence of Rahu. I think there is a good chance for crude to rise to $90 here, and I would not rule out $94. Next week (Aug 22-26) looks more difficult, however, as the Mars-Saturn square could spell trouble for all markets. Steep losses are quite possible here, especially on Wednesday and Thursday when the aspect is closest. A retest of support at $80 is possible here, although whether we do will depend on the previous week’s high. Some gains are possible as we move into September but they do not look significant. Perhaps we will see crude trade in a range between $80-90 at this time. Then the second half of September should see another down move that lasts into October. This looks quite large and $70 is quite likely here, with a realistic chance of even $60. A relief rally will probably coincide with the Jupiter-Pluto aspect in late October which lasts several weeks going into November and December. This rally will collapse likely starting in December and the correction will extend into early 2012. I am expecting lower lows here as the bear market deepens, although there is a chance that the November rally could be large enough to prevent that outcome. We shall see.
5-day outlook — bullish
30-day outlook — bearish-neutral
90-day outlook — bearish
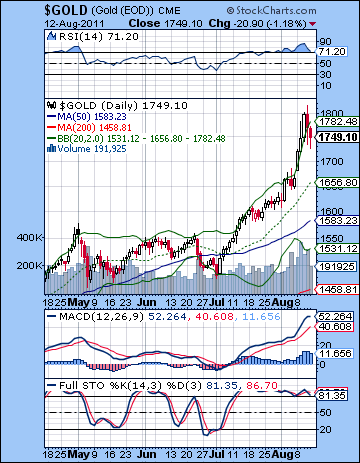 Gold continued to be the safe haven of choice in uncertain times as investors fled equities and pushed bullion to new all-time highs. After trading above $1800 intraday Wednesday, gold finished Friday near $1750, still up a very tidy 5% on the week. While I unfortunately missed the extent of this move, the result wasn’t hugely unexpected either as I noted that the ongoing Sun-Venus conjunction could well boost prices higher. I had wondered if it would suffer some the tumult of the Mars alignment but this was clearly not the case. Gold is seemingly a rocket ship that will climb all the way to the Moon before it ever corrects. Or so it seems in this environment of inflation and worldwide currency uncertainty. The technical picture remains as bullish as ever as all the moving averages are bullishly stacked. Recent increases have been virtually parabolic so that sometimes ends badly with a blow-off top that reverses soon after. One possible level to watch for is the August 8 gap at $1675. If this should close in a corrective move, it could signal the end of gold’s current bull market for some time. Bulls will therefore want gold to remain above this gap as long as possible. It’s still massively overbought as the RSI (71) has come off a 90 reading. MACD is still in a bullish crossover and is on the verge of literally moving off the chart. Resistance is fairly close at hand here as the rising channel off the 2009 low comes in around $1800-1850. Major support is near the lower Bollinger band at $1550. This coincides with the bottom of the channel. Higher support may be found near the $1600-1625 level where gold stalled for two weeks.
Has gold peaked? It’s possible, although there will be a couple of rally opportunities in the coming weeks that could see further gains that might challenge its high of $1800. The first comes this week on the triple conjunction of Sun-Venus-Mercury. The Sun and Venus are entering gold’s sign of Leo on Tuesday and Wednesday so this should boost prices. Whether it will be enough to reclaim $1800 is harder to say. Next week (Aug 22-26) could see more upside as the Sun and Venus continue their transit of Leo. However, the Mars-Saturn aspect is a bit of wild card in the equation so there is a somewhat greater risk of declines in the gold market. As we begin the month of September, both the Sun and Venus form aspects with bullish Jupiter. This is also likely to boost sentiment on gold, although I suspect prices may become choppier here rather than parabolic. The odds increase for a more significant correction as we move through September. On September 12th, Venus enters Virgo and begin its conjunction with bearish Saturn. This could coincide with the start of a new corrective phase that lasts into October. The Sun will join Venus in Virgo on September 17th and the correction could soon pick up steam. It’s possible that this correction will be larger than any correction since the one in late 2009. I am uncertain if the downside will be sufficient to break support at $1550. We may have to wait for January and February 2012 for the next corrective phase. This perhaps has a better chance at breaking the long term uptrend.
5-day outlook — bullish
30-day outlook — neutral-bullish
90-day outlook — bearish

