Summary for week of August 22 – 26
Summary for week of August 22 – 26
- Stocks may extend decline this week due to Mars-Saturn aspect on Thursday
- Dollar may move higher against the Euro although gains may not track stocks
- Crude is bearish this week; a rebound is more likely next week
- Gold should remain bullish this week; correction more likely to begin in September
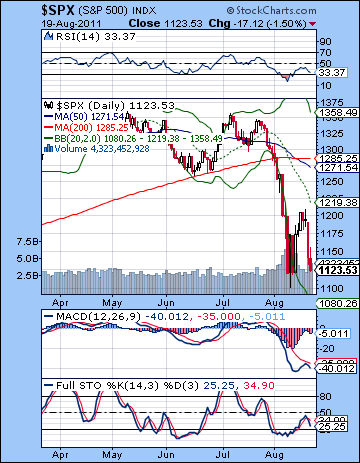 Stocks continued their slide last week as the much-hyped Merkel-Sarkozy meeting led to precious little in the way of real solutions to the European debt crisis. Despite a brief rally attempt early in the week, bulls gave up the ghost fairly quickly and Thursday’s blow out pulled the rug out from any prospect of a quick market recovery. The Dow lost more than 4% on the week closing at 10,817 while the S&P500 finished at 1123. The extent of the downdraft was frankly surprising. On the other hand, it was somewhat heartening to my expectations fulfilled for an early week rally attempt — however modest — around that triple conjunction of Sun, Venus and Mercury. I was also correct in forecasting that the second half of the week would be more prone to declines, although I had no inkling that Thursday would be the washout that it was. And I did put an asterisk beside the whole week due to the proximity of the Mercury-Rahu aspect. Rahu can be an unpredictable influence and it has the potential to reverse polarity quickly and produce results opposite from what one would expect.
So Saturn is very much in the driver’s seat here as sentiment remains negative. This is generally still in keeping with my medium term bearish outlook as I expected we would remain in a mostly bearish pattern until the Saturn-Ketu aspect in late September. However, August has been more bearish than I anticipated and this has me wondering anew about how September may unfold. Fed Chair Ben Bernanke makes his highly anticipated annual speech from Jackson Hole, WY this Friday August 26. Last year, his late-August address alluded to the likelihood of more quantitative easing if the economy stayed weak. The markets cheered this promise of liquidity and further stimulative measures and the QE2 rally commenced immediately thereafter and lasted essentially into May 2011. So the obvious question is: could Bernanke pull another rabbit out of his hat this year in Jackson Hole and goose the markets higher? The planetary situation suggests that a major rally is much less likely this time around, although I would not rule out a short term boost for stocks. What is interesting in the timing of the speech is that it will occur on the same day as Mercury returns to direct motion after its three-week retrograde cycle. While this is slightly bullish, the problem here is that Mercury will remain under the disruptive influence of Rahu at the time it goes direct on Friday. So there may be some uncertainty about the implications of Bernanke’s speech and the impact of any new policy announcements. But just three days later, Jupiter will reverse its direction and begin its retrograde cycle that lasts until December. Since Jupiter is associated with expansion and optimism, it boosts the likelihood that Bernanke will announce something that aims to help the markets. Whether or not investors respond favorably is another matter. I tend to think there will be some short lived upside from such an announcement, although the crux of the Saturn-Ketu aspect looks like it will hit in the second half of September.
 Last week I wondered if the market would reverse lower once it hit some resistance levels like 1200 or 1220. That’s essentially what happened Wednesday morning as the SPX topped out at 1205 or so and then headed lower. The bears took firm control here as the prospect for any decent sized rally back to 1250 or 1270 was nixed as prices headed south at the earliest opportunity at 1200. As expected, the 1170 support level was important as Thursday’s break down from that level led to significant lower prices. We also broke the rising trend line support from last week’s low of 1103. Friday’s close at 1123 tested last week’s low close near 1120. It’s possible we could hold here before moving higher again for a brief rally. But if 1120 breaks, then we could be headed to 1080 fairly quickly. It is unclear if that support could hold for long, however, as the 50% retracement from the recent May high (1371) at 1014 could act like a magnet. This is equivalent to Dow 9600. This is also near the July 2010 low so that somewhat increases the likelihood that it could represent a significant low.
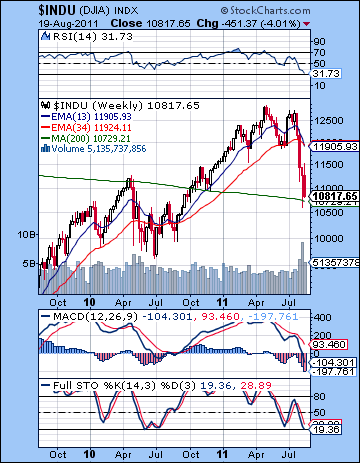
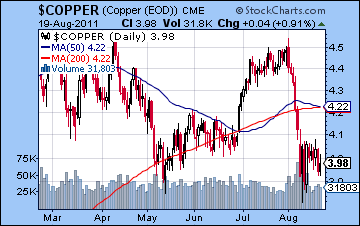
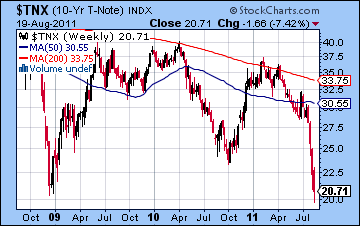
While support looks a little shaky here, bulls can point to near-oversold levels on the daily SPX chart as RSI (33) has fallen near the 30 line. This could have a little ways further on the downside before we might see some divergences with respect to the previous low. MACD is still in a bearish crossover and is not climbing and until it does, it will be difficult to go long in this market. Similarly, Stochastics (25) barely climbed out of the gutter this week before another bearish crossover occurred. Volume is rising on down days and falling on up days, so there really isn’t much evidence to suggest a major reversal higher is imminent. The weekly Dow chart shows that we have got the beginnings of a 13/34 WMA crossover that marks the start of a significant bear market. They haven’t decisively crossed over yet, however, so further downside will be necessary to verify this long term sell signal. Coincidently, we haven’t quite got the 20% correction needed for an official bear market. That occurs at SPX 1096 and Dow 10,300. But at the moment, the other indicators are pointing towards lower prices ahead. MACD is in a deep crossover and RSI (31) is almost oversold. Stochastics (19) are now oversold and may hint that a reversal is at hand, although until there is a crossover there, it would be risky to attempt a significant long position. Copper offers some evidence that the end is not near as it remains around the 400 level and is close to the May low. A break below 390 would be more serious and would increase the likelihood that stocks will continue to move lower. Meanwhile, treasuries remained a safe haven play for investors fleeing the stock market as yields on the 10-year touched 2% last week. The matched the low from the 2008 meltdown and suggests that stocks have further to fall. Bonds often lead stocks and their divergences can provide clues for future movements in the market. If yields stabilize near these levels and begin to move higher, that would be a signal that stocks will likely rise also in the not too distant future. Bernanke’s speech on Friday will be critical in this respect. Treasury yields made a low in October 2010 shortly after last year’s Jackson Hole speech where QE2 was strongly hinted at. If yields continue to decline, however, it would be more evidence that stocks will have further to fall.
 This week is crunch time as the Mars-Saturn square aspect is exact on Thursday. This is a nasty aspect that has the potential for large declines. This aspect will still be very close at the time of Bernanke’s Friday morning speech so that complicates the situation somewhat. As a rule, aspects lose energy once they are past exact. There are always exceptions, but this generally suggests that stocks are more likely to rise after Thursday. So that could provide some support for the view that Bernanke’s speech will lift stocks. However, Mercury is another source of uncertainty as it turns direct on Friday — just hours after the speech. It is closely aspected by Rahu so that is another generally stressful and confusing influence. Together, these influences look bearish. Severe declines are more likely with these patterns than chance would dictate, although I would think the negativity is a little more concentrated before Bernanke’s Friday speech. There is a reasonable chance for an up day early in the week as the Sun and Venus form aspects with Neptune and Uranus. While some upside is likely, the prospect of a Mars-Saturn square means that gains should be canceled by declines by the end of the week, or least until Thursday. I think there is a good chance that we break below 1100 this week and it’s possible we could even make a quick run to 1050 by Thursday. The worst should be over by Friday as Mars loses some energy and there is a nice Sun-Uranus aspect. Even here, I would be very cautious here since Mercury will remain afflicted by Rahu all the way into next week (Aug 31). It would not shock me if the markets fell Friday also. Nonetheless, a recovery rally is still a likely outcome Friday, but Mercury’s influence here means that it is not a done deal.
 Next week (Aug 29-Sep2) offers a better chance for gains as Mars moves off Saturn, and the Sun and Venus are in aspect with Jupiter. I am not expecting any huge gains here, although it is possible the market could recover 5-10% in early September if it first falls further on the Mars-Saturn aspect as I am expecting. If we see SPX 1000-1040 this week (unlikely but possible), then it will set up the possibility of a head and shoulder top pattern dating back to early 2010. The forthcoming right shoulder of this pattern would be about 1250 and could occur anytime in Q4 2011. I’m not sure we will get down to 1040 this week, however. If we don’t, then we may have a more protracted zig-zag decline where the market makes a series of lower lows and lower highs. The following week after Labor Day (Sep 6-9) should also see buyers prevail as Mercury approaches its aspect with Jupiter. This aspect is exact on September 14 and marks a potential reversal. As the Sun and Venus enter Virgo for the second half of September, the chances rise for more downside. Saturn makes its exact aspect with Ketu on September 23 so that may mark the heart of the next down move. The fast moving inner planets then have a series of difficult conjunctions with bearish Saturn at the end of September and early October. I am expecting this down move to erase any post-QE3 rally and take the lows we see in late August. Once the Sun conjoins Saturn in mid-October, the odds should increase for a rally. Jupiter makes a series of aspects in the fall so that augurs well for a rally of significance before the end of the year. Just where we will at that time be is hard to say. October looks like it will bottom out below 1000 on the SPX (below 10,000 on the Dow), perhaps substantially below.
5-day outlook — bearish SPX 1060-1100
30-day outlook — neutral-bullish SPX 1100-1200
90-day outlook — bearish SPX 1000-1100
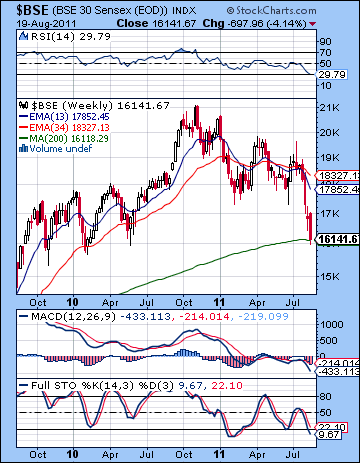
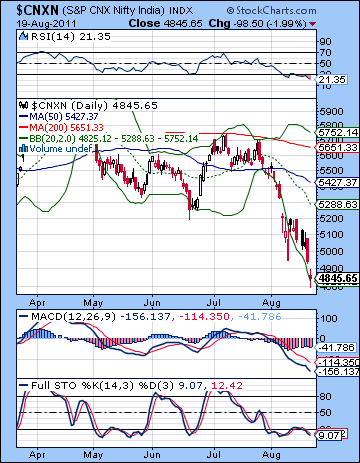 Stocks fell for a fourth straight week on growing recession fears and the lack of any significant solution to the European debt crisis. After an uncertain beginning to the week, the Sensex ended 4% lower closing at 16,141 while the Nifty finished at 4845. The bears are firmly in control here as a "new normal" has emerged across most of the world’s financial markets. The extent of the downdraft caught me by surprise as I did not expect the selling could resume so quickly after last week’s drubbing. Frankly, I had expected more upside form the early week triple conjunction of Sun, Venus and Mercury. Although this did provide some modest support on many global markets, India was less responsive to this bullish trio as markets were essentially flat on Tuesday and Wednesday. That said, I did note that the presence of a Rahu-Mercury aspect through much of the week made my call for gains somewhat more cautious. Monday’s closure precluded the possibility for gains then while the late week was looking somewhat more bearish again. I singled out Friday in particular as a better candidate for a down day and the markets did fall 2% on that day.
While I am disappointed that I did not foresee the extent of these declines here, my medium term bearish stance has been further validated. I have been expecting a fairly deep corrective phase in the market here as Saturn strengthens ahead of its aspect with Ketu in September. The extent of the decline has been somewhat greater than I had expected, however, as I thought we would tend to see larger percentage declines in September and perhaps into October. This may no longer be the case, however, as Fed Chair Ben Bernanke may be compelled to intervene once again in the markets and provide more liquidity or a new round of quantitative easing. His upcoming Jackson Hole speech on Friday 26 August is pivotal in this regard and may move the markets decisively. The consensus is that QE3 might boost stocks at least in the short term, although there is no consensus that QE3 will actually be forthcoming. The planets at the time of the speech give some support to the notion that stocks could rebound. Mercury ends its retrograde cycle on the same day as it returns to forward motion. This would normally be a positive influence, although here it will occur whilst under the troublesome aspect of Rahu. Just three days after the speech, Jupiter will also station and reverse direction and commence its four-month long retrograde cycle. The proximity of these planetary reversals offers some evidence that we could see a shift in the prevailing glum mood. Jupiter direction reversals may also boost the likelihood for more expansionary policy approach so it seems more likely that Bernanke will try to keep markets liquid during the current crisis of confidence. But there are no guarantees that further liquidity will be cheered by the investment community. Indeed, some have argued that more stimulative measures could actually be bad for markets since they would be inflationary and would signal desperation from the Fed. Astrologically, the planets at the time of the speech are very mixed. The Mars-Saturn square aspect is a very nasty aspect and is likely to drag down markets near that date. The aspect is exact on Thursday but it could conceivably manifest on Friday. On the bullish side, a Sun-Uranus pattern looks more positive so it could signal more optimism and risk-taking as do the Sun-Jupiter aspect in the following week. But perhaps the absence of any clear positive signals suggests that a major breakout rally like we saw in September 2010 is the least likely outcome of the speech on Friday 26 August. Perhaps the most likely scenario would be a short and fairly modest rally after Bernanke’s speech. I would also not be shocked if the market declined further, however.
 So much for the gap fill at 5300. There was no hint whatsoever of any push higher last week as Thursday’s selloff matched the previous week’s low and set the stage for Friday’s cliff dive. While I have been expecting a retest of support of 4800 from the May 2010 low, I did not anticipate it would happen quite so soon. While a bullish defense of 4800 is quite possible in the near term, the overall outlook remains quite grim for equities. 4800 is perhaps the only thing the bulls have in their favour at the moment as many bears would be wary about shorting too aggressively so close to a clear source of technical support. Also bulls can point to the oversold nature of the market. The daily RSI is now down to 21(!) and is massively oversold. Stochastics (9) are similarly scraping along the bottom of the ocean here. Neither indicator in itself is reason to take long positions as there is no evidence for a bottom or a reversal higher. MACD remains in a bearish crossover and is moving lower. If support is found near 4800, then resistance is now 5200. Stronger rallies could push as high as the 20 DMA 5288 and that yawning gap at 5300. But the current situation looks very bearish indeed as the three main moving averages are neatly stacked one on top of another — 200 over the 50 which is over the 20. It doesn’t get much more bearish than that.
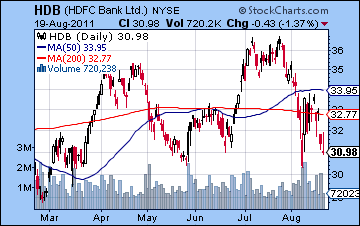
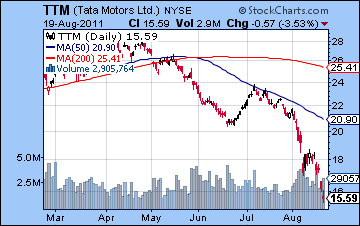
It is worth noting that the 4890 level also coincides with the 38% retracement level from the 2008 low. Last week’s close has already broken below that, but if 4800 holds this week, then that might become a more important base from which to launch a new rally attempt. But if 4800 does not hold, then what is the next level of support? There is some fairly strong support at 4000 since this is the pullback low after the huge post-budget rally in May 2009. 3950-4000 also coincides with the 61% retracement level so that adds to its durability perhaps. In between the two levels, we can suggest that the 50% retracement level at 4450 may also bring in new buyers. This coincides with some minor horizontal support dating back to 2008 and 2009 so a sharp move lower this week could see a test of that retracement level. The weekly BSE chart also offers the bulls some possible respite from the gutting they have received: Friday’s close was very close to the 200 WMA. But it is unclear just how solid this level would be. The weekly chart is also oversold as RSI is 29 and Stochastics is just 9. But until there is a bullish crossover in Stochastics, there is nothing at all to indicate a bottom has been reached. Possible signs of strength may be found in HDFC Bank (HDB) as it remains above its previous 2011 lows. This is a relatively strong chart situation compared with many other Indian companies. Bulls will likely defend the $30 level and will attempt some long positions. A breakdown of those lows would open the door to much lower prices, however. Tata Motors (TTM) has had a tougher time of late and now finds itself perched on the 200 WMA. This also matches some significant horizontal support dating back to 2007 and 2008 so it is possible it could attempt a rally from here. It’s very much at the bottom end of this support, and given the inverse stacking of the moving averages, it may be difficult to reverse higher very quickly.
 This week could be quite volatile as Thursday’s Mars-Saturn square aspect will likely dominate the proceedings. This is a dangerous combination of planetary energies that suggest panic and aggression (Mars) and fear and pessimism (Saturn). And as Mercury slows down ahead of its direct station on Friday, it will come under the disturbing and confusing influence of Rahu for much of the week. The fact that these two aspects are occurring together is very bearish. It is possible we could see a steep decline this week, perhaps even all the way down to 4500. That said, there are still some positive aspects in the mix. Wednesday’s Venus-Uranus aspect could lift sentiment briefly. Monday, Thursday and Friday look more bearish generally with the late week offering a more likely downside scenario. While these aspects look pretty negative, it is important to remember that aspects sometimes fail to deliver their expected results. That is also true this time around. It’s possible that we’ve already seen most of the Mars-Saturn decline in the past two weeks or so as Mars has slowly moved into position that culminates this week. This is only to say that there are always other ways of interpreting the charts – and that goes for both technical analysis and astrology. That said, I do think further declines are the most likely outcome this week. The technical situation makes this a somewhat harder forecast to make, however, since we are already so close to support at 4800. It may mean that we move up to 5000 first before retesting 4800 for real this week. Even if the Nifty does happen to rise early in the week, I would still expect the downside to be formidable in the second half of the week.
 Next week (Aug 29- Sep 2) looks less clearly bearish in the wake of the Mars-Saturn aspect although the ongoing affliction of Mercury by Rahu would tend to put a damper on rallies. While I would not rule out more downside here, it may be less violent than the previous week. Gains are also more likely here as both Venus and the Sun are in aspect with Jupiter. Jupiter turns retrograde on 30 August so that may offer some hope to bulls. Reversals in planetary direction can sometimes coincide with reversals in the market. The latter part of the week may be somewhat more positive although markets are closed for two days here so only Friday may be available for gains. The following week (Sep 5-9) looks more bullish as Mercury enters Leo where it comes under the helpful influence of Jupiter. Markets may stay mostly bullish until the Mercury-Jupiter aspect of 14 September. After that date, they may be more vulnerable to declines. If this scenario plays out, then we may only get two weeks of gains after this long summer correction. That would suggest only a 10% gain of perhaps 400-500 Nifty points. The second half of September is likely to be more bearish as Sun and Venus enter Virgo and form a conjunction with Saturn. The ultimate problem here is that Saturn will be in aspect with Ketu on 23 September so this whole period has the increased probability of another move lower. This period is likely to stay mostly negative until mid-October at least and the Sun-Saturn conjunction. The Nifty could easily fall to 4000 by October and I would not rule out lower levels also. A rebound rally will likely commence in October and carry into November. There is the possibility that this will be a significant move higher but it will still be marked with pullbacks. 2012 generally looks troubled for stocks so we may have to wait for 2013 for a calmer financial climate.
5-day outlook — bearish NIFTY 4700-4800
30-day outlook — bearish-neutral NIFTY 4800-5100
90-day outlook — bearish NIFTY 4000-4500
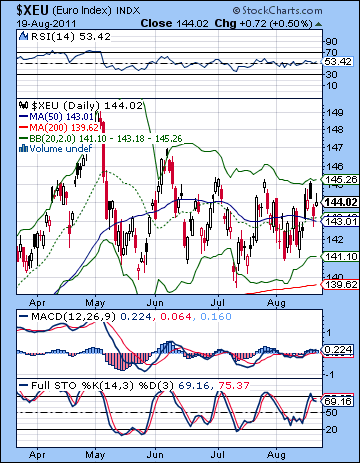 Despite the lukewarm reception to the latest European action plan, the Euro managed a decent gain this week thus proving the old adage that something is better than nothing. After testing 1.45 briefly midweek, the Euro settled back at 1.44 while the USDX finished a hair over 74. The Rupee had another rough week closing near 45.61, its lowest level in many months. I had expected some upside here around the triple conjunction of Sun-Mercury-Venus and this view was largely borne out. I thought 1.44 was possible with an outside chance at 1.45. We did see 1.45 on Wednesday just as the conjunction was exact. The Euro keeps whistling through the graveyard here as it forms a narrowing triangle pattern that will soon be resolved in one direction or the other. For a breakout higher, it needs a close over 1.45. While a breakout lower would require a close below 1.40 and a testing of that 200 DMA at 1.395. Stochastics (69) show a bearish crossover so it may be time for the pendulum to swing to the downside, however small a move it may be. There are rumours flying around now that the ECB may be forced to lower rates in order to shore up some failing banks. That would be a major development and would move the Euro sharply lower. On the other hand, the market is trying to come to the terms with what Bernanke may do on Friday at Jackson Hole. There are arguments pro and con further easing with no consensus on whether he will actually do something, nor how the market will react. Further easing seems likely to weaken the Dollar, however, just as it did during QE2. But the risk of inflation may be too great for even Helicopter Ben to resist so it may be reduced to simple tweaks here and there. If so, the Dollar could rise in reaction as investors who were expecting more easing get burned. It’s an interesting point in the game to be sure.
This week tends to look more bearish for the Euro. Not only does the Mars-Saturn aspect tend to favour safe havens like gold and treasuries, but if the risk trade is further damaged, then that is more likely to hurt the Euro. While huge swings are possible in stocks this week, they seem somewhat less likely in currencies. It still could happen, but the planets are just less reliable as a forecast. That would suggest that support at 1.40 will not be tested this week. Next week could see another bounce in the Euro as the Sun and Venus form aspects with Jupiter. This relative buoyancy may continue into September also. I don’t think it will be enough to break resistance at 1.45. The second half of September looks quite bearish, however, so there is good reason to expect that the triangle will be broken at this time to the down side. There is the possibility for some significant moves as we go into October. 1.30 is doable here around the Saturn-Ketu aspect and the Sun-Saturn conjunction. While some rally is likely into November, the Euro chart looks bearish for December and January. It could really go over a cliff again here as Saturn lines up in opposition to its natal position.
Dollar
5-day outlook — bullish
30-day outlook — bearish-neutral
90-day outlook — neutral-bullish
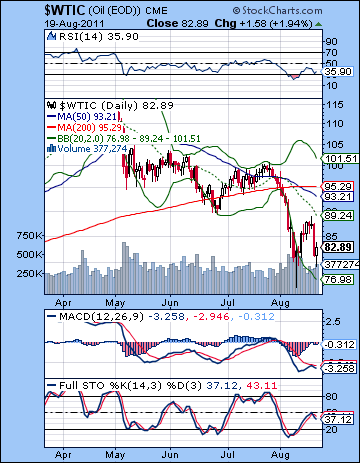 As recession fears grow, demand prospects for crude oil fell as it lost 3% on the week finishing below $83. I thought we would see more upside early on on the triple conjunction. Crude did rally near that alignment although it did not hit my target of $90, peaking instead at $88. While I expected some late week declines were likely around the Mercury-Rahu aspect, I was not looking for Thursday’s washout. Friday’s intraday low retested the $80 level, a sign of further weakness down the road. The technical picture remains weak here as the moving averages are all falling and are neatly stacked together. As it typical with rally attempts in the middle of sharp declines, the early week rally could not even recapture the 20 DMA at $89. MACD remains in a bearish crossover although the histograms have shrunk. RSI (35) has climbed back from an oversold condition although they do not indicate a probable move in either direction. Stochastics (37) is moving lower and in a bearish crossover although it is also malleable evidence. Resistance is likely around the $90 and the moving averages that lie above it. The 200 DMA is still rising slightly so that perhaps offers bulls that not all hope is lost for some redemptive move in the future. Support is initially at $80 with $70 being firmer support dating back to mid-2010. Even if we get a sharp move lower in the coming days, I think $70 should hold. Below that, $60 may offer support if the correction enters its death spiral stage by October. We shall see.
This week centers around the Mars-Saturn square aspect which is exact on Thursday. This is a nasty pairing for most asset classes including crude which has moved in unison with equities recently. The aspect is made more negative (and more reliably so) because it exactly aspects the natal Mercury in the Futures chart. Monday’s Sun-Neptune opposition is likely to make that a larger than normal move. This is often a positive aspect for crude, although in the current circumstance, it could mark a sharp move lower also. The late week also looks more bearish with Friday’s post-Bernanke speech being a wild card. I would generally think it will be positive but it’s definitely not clear cut. Next week could see a choppier market with early week volatility. We could begin to see a move higher here that extends into mid-September. Late September and October should be more bearish, however, and so lower lows are quite possible. November should be more bullish with a rally continuing into December. It is possible that this could extend into January.
5-day outlook — bearish
30-day outlook — bearish-neutral
90-day outlook — bearish
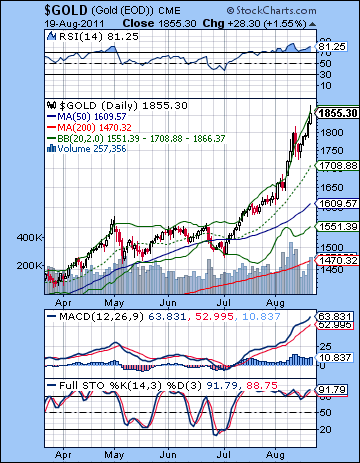 Another week, another all-time high for gold. The soft yellow metal re-affirmed the truth to the phrase "as good as gold" as it closed above $1850 against the backdrop of further market turmoil. This bullish result was in keeping with expectations as I thought the entry of the Sun and Venus into Leo would likely push prices back up. It seems that gold has $2000 in its sights now. Resistance is close at hand, however, as the rising channel from the 2008 low peaks around $1950. This line will rise to $2000 by early to mid-September so it is quite conceivable that it will take a run at the next psychological level. Channel support is $1550 so any break of that line would jeopardize this whole massive bull market in gold. Clearly, gold could sustain a major pullback and not break the fundamental upward momentum that it currently enjoys. Its recent move has been parabolic, however, so this rally may be prone to an abrupt end. Gold is still hugely overbought but no one seems to care. We can see a small negative divergence in the RSI (81) which may or may not play out in the short term. If the RSI does not match the previous high in the days ahead, then the divergence will assume greater significance. Amazingly, the weekly chart is no less overbought as RSI is even higher at 84. It’s possible this rally could continue a while yet, but when a rubber band is stretched this far, it often snaps back in a violent way. The downside, when it comes, could be big.
This week should see an extension of the rally as the Sun and Venus may actually get stronger around their aspects with Uranus. The late week Mars-Saturn is a potential time of concern, although it may only be Friday that we might see some kind of pullback. So I would generally maintain a bullish bias with gold here this week with $1900+ likely. The following week also looks positive as both Venus and then the Sun form aspects with bullish Jupiter. Jupiter is going retrograde on August 30 so it is at a peak of its energy here. This is therefore a potential high water mark for gold — September 2. It is also possible that gold could continue to rise beyond that date, although it is less than a probable outcome. But as we get deeper into September, the odds get stacked higher and higher against gold. First Venus enters Virgo on September 10. This is a bad placement, especially given the presence of Saturn in Virgo at the moment. Then the Sun enters Virgo on September 17 as it also joins Saturn. If gold is still rising at this point, (unlikely), then a major downturn is very likely on September 28 when Venus exactly conjoins Saturn and is in aspect with Ketu. The Sun repeats this pattern on October 9. Generally gold should correct quite sharply into mid-October. Another rally is likely to begin in October and carry through to November although it may lack the parabolic frenzy of what we have witnessed recently.
5-day outlook — bullish
30-day outlook — bullish
90-day outlook — bearish-neutral

