Summary for week of August 29 – September 2
Summary for week of August 29 – September 2
- Stocks could rebound Monday but more bearish into midweek
- Dollar to strengthen midweek after possible decline early
- Crude likely to stay firm on early week gains
- Gold may rebound a little further but more uncertain as week progresses
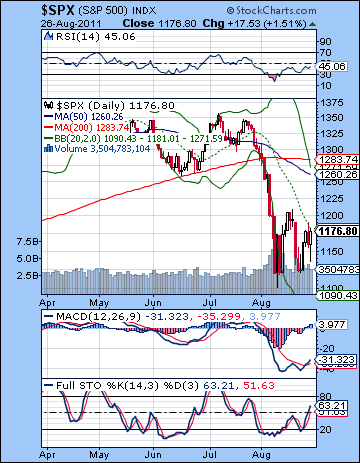 Stocks rallied back from their recent lows last week as the absence of more bad news was enough to keep investors bargain hunting. The Dow rose almost 4% closing at 11,284 while the S&P500 finished the week at 1176. Ugh! This bullish outcome was hugely disappointing given the bearish Mars-Saturn aspect that was exact on Thursday. I thought there was enough negativity there to test recent lows but all we got was one rather mediocre down day on Thursday. The early week gains were not entirely shocking given the Sun-Venus-Neptune-Uranus alignment, as I did anticipate some upside there. However, I underestimated the extent of the buying as the bulls pushed up the S&P back to 1190 before easing off after Thursday’s open. Friday’s gain was also not unexpected as I thought the most likely Bernanke Jackson Hole speech scenario would be weakness prior and strength afterwards.
So more stimulus, if necessary, but not necessarily stimulus. We got no resolution last week as Fed Chair Ben Bernanke decided to avoid making a decision about another round of easing and economic stimulus until the next Fed meeting on September 20-21. This latest administration of "hopium" to the markets was enough to keep all the plates spinning the air for a while longer, at least until some new ugly revelation about the Eurozone surfaces. In other words, we finally got a dose of Jupiter to go with the steady diet of Saturnine caution and gloom. The markets remain locked in the firm grip of bearish Saturn as it approaches its aspect with Ketu (South Lunar Node) in September. However, last week saw a modest manifestation of Jupiter’s ability to lighten the mood and encourage some risk-taking. I thought much of that Jupiter effect might occur this week and in early September, so I was wrong in that timing calculation. Certainly, I had been expecting some Jupiterian upside near the time of its retrograde station on Tuesday August 30. As we know, whenever planets change direction, they become quite powerful and can move the markets according to their intrinsic energy. Jupiter is a bullish energy so that increases the likelihood of a rising market in and around the time of its direction reversal. We got the first taste of that last week and the probability is that we will get at least another week of it this week. The absence of any close major aspects with Jupiter in September, however suggests that any rally may not get very far. Plus, Saturn’s energy is likely to increase as it approaches its aspect with Ketu on September 24. Interestingly, this is just days after the next Fed meeting. This heavy Saturnian energy at the time of the meeting does not make more stimulus and QE3 very likely. In fact, there may be a greater need to constrain spending and take control of the debt situation. Pessimism is likely to be in greater abundance at this time, and there may be a greater demand to restructure or reorganize the financial playing field. While it is still conceivable that Bernanke could announce some stimulus measures in September, they are more likely to underwhelm the market.
 While the bulls had a good week, the technical market picture is mixed. The bulls can rightly point out that the low of 1100-1120 was tested Monday and then prices moved higher. Also, a potential bullish double bottom was formed suggesting that the market is intent on moving above 1200 towards higher resistance levels. MACD is now in a bullish crossover on the daily chart which is usually a reliable indicator for more upside. Stochastics (63) is also rising and has some way to go before becoming overbought. So there is considerable evidence for the bullish case and it does augur well for the market in the immediate future. However, the negatives are still there. The market has carved out a triangle pattern here of lower highs and higher lows. While this is mostly neutral, the fact that it comes right after a huge sell-off suggests it may be simply a pause before continuing lower. It is therefore critical that bulls can break above the resistance level of 1180 in order to have a chance to hit 1208, 1220, and 1250. Failure to break above 1180 would likely prompt some selling and another possible test of support at 1140-1150. So far, the retracement after the big wave down has been quite tepid, just 38% from the May high. In many circumstances, one might expect at least a 50% retracement which in this case would equal 1237.
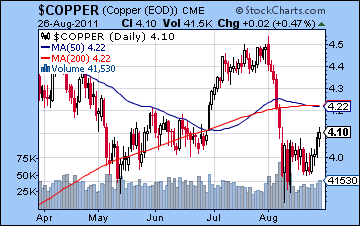
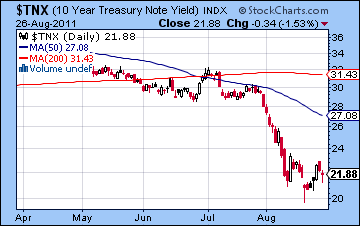
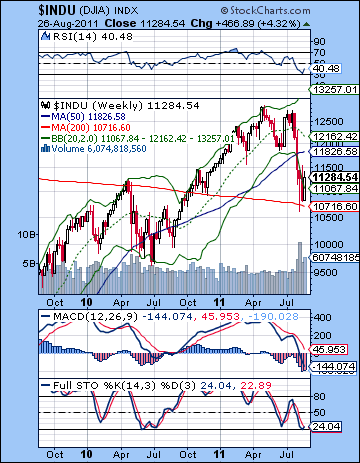 But the speed of the decline may undermine such expectations, as the downdraft was so severe that buyers may not have the stomach to stay long. In major sell-offs, it is not uncommon to see the rebound come up to only the 20 DMA. We can see how that is exactly where the rally stopped last week. Given the vulnerability of the market, one possible sell signal might therefore be a bearish crossover on the daily Stochastic. Conversely, a potential buy signal might be a break above resistance at 1180. The weekly chart still looks pretty bearish with the MACD crossover, although the Stochastics is showing a bullish crossover. So far, that 200 WMA at 10716 has proven to be quite a good support level. Should the Dow break below 10,700, then it may well test 10,000 and the mid-2010 low. The way things are unfolding, it is quite possible we may have to wait until October for a sub-10K Dow, however. Other indicators affirm the tenuousness of the current market. As a barometer of industrial activity, copper gained last week closing at 410. While bulls can point to a steadily rising price here, as long as it remains under the 200 DMA, one has to be suspect about any rallies. Meanwhile, bond yields pulled back last week as the 10-yr flinched after plumbing 2%. Another decline in stocks would likely see a retest of the 2% level, although it is unclear if yields would fall below. At this point, bonds are still out of sync with equities as the 2% on the 10-year suggests much lower stock prices down the road — like around SPX 900. This gap can be closed at either end, however, as bond yields could conceivably rise to match the current higher valuations in the stock market. Typically, however, bonds lead and stocks follow. So that is another reason to expect more downside in stocks in the weeks and months to come.
This week is harder to call as there is a mixed bag with both positive and negative influences in play. Although it is now moving forward, Mercury remains under the influence of Rahu and therefore increases the likelihood of uncertainty in the markets. Jupiter begins its retrograde cycle early on Tuesday so this is a more positive influence. Of course, we got a sample of Jupiter’s optimism last week but I suspect there could be more upside courtesy of the solar system’s largest planet. Monday’s Venus-Jupiter aspect is normally pretty bullish, but it’s looking less reliably positive due to the unfortunate position of the New Moon earlier in the day. New Moons tend to occur around market tops so that is one point for the bear side perhaps. Tuesday and Wednesday look even less positive and could well be negative as the Moon enters Virgo to conjoin Saturn. Wednesday is perhaps more bearish looking of the two days. Thursday may be more positive as the Sun approaches its aspect with Jupiter but the end of the week still features more potential negativity on the Mars-Rahu aspect. So we should see one up day early in the week — either Monday or Tuesday. I would lean slightly towards Monday but it’s a toss up. But if Monday is lower, then that would allow for a gain Tuesday which would preserve the triangle pattern. Tuesday’s potential gain would therefore be less likely to penetrate resistance at 1180 . If Monday is higher, then resistance has a better chance of being broken to the upside (to 1200?) followed by a possible back test of the falling trend line at 1170 midweek. If the late week aspects offset each other, then there is a good chance that we will actually stay in the triangle between 1140 and 1180. On the face of it, this week does not seem like a good candidate for a big break through to the upside. The wild card here is the effect of the Jupiter retrograde station. It could move markets to the upside even without any contributing aspects. It’s not a clear influence, but it is nonetheless possible. I would tend to be quite cautious here since the downside remains considerable and the upside potential looks quite limited.
 Next week (Sep 6-9) begins after the long Labor Day weekend. It offers the prospect for gains as Mercury enters Leo and comes under the helpful aspect of Jupiter. Some selling is nonetheless possible towards the end of the week on the Mercury-Neptune opposition. The following week (Sep 12-16) could be shaky as Saturn comes to within just three degrees of its aspect with Ketu. Venus will weaken as it enters Virgo. But I am not expecting a big decline here as the Mercury-Jupiter aspect will likely offer some support. The second half of September looks more bearish, however, as the Saturn-Ketu aspect should manifest at that time. I think this is the most likely time when the SPX will move below 1100 and the Dow breaks 10,000. It is possible that it will take until mid-October for the down move to be completed. Of course, aspects do not always deliver as promised, so it is important to be open to the information that the market is providing us. That said, these aspects would tend to offer evident for the notion that the SPX will test its 2010 low at 1010. October 14 is one possible interim low at the time of the Sun-Saturn conjunction and the Mars-Rahu aspect. After that, the odds generally rise for gains as subsequent Jupiter aspects are likely to bolster the bulls. Jupiter-Pluto occurs on Oct 28, while Jupiter-Chiron extends the potential rebound window to December 6 and Jupiter-Uranus to December 13. I don’t expect a rally to last that long, but it at least offer some evidence that there will be some upside here. Perhaps we will get another lower low in November wedged in between those Jupiter rallies.
5-day outlook — bearish-neutral SPX 1140-1180
30-day outlook — neutral SPX 1160-1200
90-day outlook — bearish SPX 1000-1100
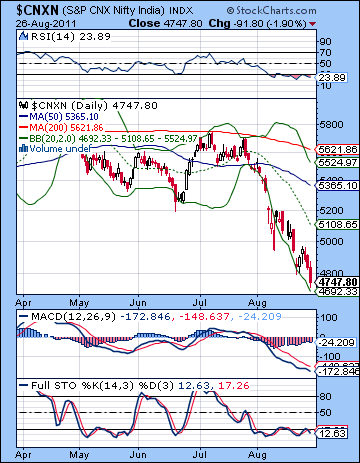 Stocks remained in their downward spiral last week as bad inflation data made future rate hikes more likely. Despite some early week gains, the Sensex lost 2% closing at 15,848 while the Nifty broke key support finishing at 4747. This bearish outcome was mostly in keeping with expectations as the late week Mars-Saturn aspect did produce new lows on the indices. The declines were somewhat less dramatic than I thought they might be, however, so we are still fairly close to the key support level of 4800. The early week gain was also not unexpected as I thought we would see some buying around the Sun-Venus-Uranus alignment going into Wednesday. As it happened, we saw decent gains Monday and Tuesday that closed a technical gap and then the bears took over for the rest of the week.
The bear market has definitely arrived as stocks continue to fall despite being oversold by many technical indicators. But this pessimism about the economy is merely fulfilling the promise of the planet Saturn. As I have noted for many weeks, Saturn was likely to push stocks lower in August and September as it approached its aspect with Ketu (South Lunar Node). Indian markets fared worse than most global markets last week because of some specific planetary afflictions in the BSE horoscope. Again, the problem was Saturn. Saturn is forming a difficult aspect with the Sun in the BSE chart for the next few weeks so it is unlikely that we will see a substantial rebound any time soon. As we know, Saturn is a planet of caution and fear and when it is strong, prices tend to fall as investors seek safe havens such as cash, bonds, or precious metals. Saturn’s pall arguably fell over Fed Chair Ben Bernanke last week as he did not announce any new stimulus or easing program to jump start the sagging US economy. His Friday speech merely delayed the decision of possible further stimulus until the next Fed meeting Sept 20-21. This could be a crucially important time since it will come just a few days before the exact Saturn-Ketu aspect. But while Bernanke did not announce new measures, neither did he rule them out. This was a perhaps a reflection of some Jupiter energy ahead of its retrograde station on 29 August. Given its druthers, Jupiter seeks to inflate and pursues new opportunities. The fact that Bernanke left the door open to further stimulus was a possible manifestation of this little boost in Jupiterian energy against a wider backdrop of Saturnian caution. But it is fairly unlikely that the boost will last for long since Jupiter will not form any close aspects with powerful slow moving planets until October. It therefore seems less likely that rallies will get any traction until that time.
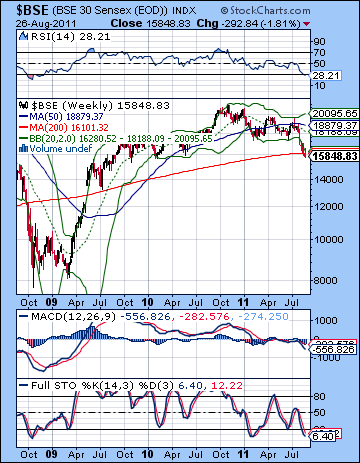 The bears achieved a major victory last week by breaking below the 2010 low of 4800 on the Nifty. This was significant because support broke despite the market being very oversold on a daily basis. RSI (23) and Stochastics (12) have been oversold for two weeks and yet the selling continues. This is the kind of breakdown that can precipitate full blown crashes. Crashes tend to occur when critical support is breached and investors in long positions are fearful that the next support level is too far away. This is the roughly the situation that the Indian markets are in now since the next support level is 4450, but it’s unclear just how solid that would be. 4000 is somewhat more solid as support, but that is a long way away from current levels. Resistance is also a little tricky at this point given how far prices have fallen recently. Tuesday’s gain filled the gap from the previous week at 4950 but the 20 DMA at 5108 may well act as resistance as it is often near the level where bear market rallies culminate following a sharp sell-off. Of course, the gap at 5300 remains unfilled but that is looking more unlikely.
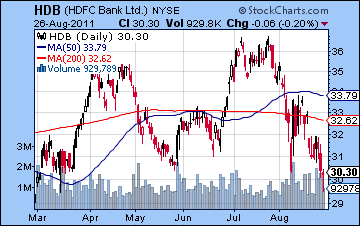
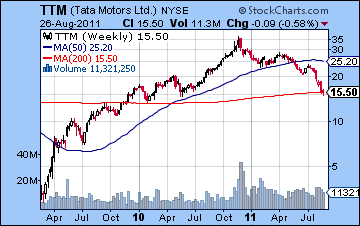
We will likely see some kind of rally once the Nifty breaks out of this steeply falling channel. It may occur soon as we discern a bullish falling wedge pattern here. These are often bullish although they often do not last for long. The shrinking histograms are a correlate of the falling wedge and suggests that the odds are increasing for some kind of rebound. A MACD crossover would likely prompt more buying and could even spark a more significant rally such as we saw in late June. The weekly chart of the BSE shows how cheap stocks have become. Last week saw the 200 WMA slightly broken. This provided support on a pullback in 2009 and it may well act in a similar fashion here. But what strikes me is just how much empty space there is on that chart and how little clear support there is if the selling continues. It’s not a stretch to consider the possibility of revisiting the 2008 low of 2500 on the Nifty and 8000 on the Sensex. But for the moment, the weekly chart is oversold as RSI (28) is below the 30 line and Stochastics (6) are bottoming out here. A bullish crossover on the weekly Stochastics chart would be one possible buy signal for some investors seeking to establish a short term long position. But we don’t have one yet. Meanwhile the gap at 13,000 is getting closer with each passing week. We may not have to wait long now. Despite a losing week, HDFC Bank (HDB) still managed to stay at support from its February low. Friday’s bullish hammer candle offered some evidence that it could bounce here. It is therefore possible that it could attempt a rally from this level although the upside target may only be the 200 DMA. Tata Motors (TTM) only declined slightly last week as it also retained a key support level, at the 200 WMA. Given the steady nature of its rise in 2009-2010, it may be that any decline will similarly be more modest and orderly.
 This week looks more mixed as there will be both bullish and bearish aspects in play. A key ingredient will be the Jupiter retrograde station late on Monday evening. Jupiter is a bullish influence and whenever it stops and reverses direction, it can have a positive affect on sentiment. Monday also features a bullish Venus aspect with Jupiter, so that is perhaps the most reliably bullish day of the week. At the same time, however, Mercury is still under the influence of Rahu as it begins to slowly move forward again after completely its retrograde cycle on Saturday. While this is not a clearly bearish influence, it somewhat reduces the reliability of the upside of the Jupiter aspects. The Mercury-Rahu aspect is closest on Tuesday and Wednesday, so that perhaps increases the odds for some downside at that time. Markets are closed Wednesday and Thursday but it seems likely there will be some downside globally then. When markets re-open on Friday, Mumbai may have to play catch up. Friday is therefore more likely to be negative. The Mars-Rahu aspect on Friday further increases the odds of a decline then. Even there, however, it is not all negative as the Sun-Jupiter aspect builds towards the end of the day. This may manifest as a negative open with some recovery in the afternoon. The planets are therefore looking rather mixed here, although there is a reasonable chance for some gains. But the gains do not look like they will be particularly big, nor all that certain for that matter. And Tuesday could be iffy at best which may undercut any gains. So there is a good chance that we will see a back test of 4800 and I would not rule out 4900 either. This suggests that the falling wedge may violated on the upside Monday and then the previous resistance line back tested Tuesday and perhaps Friday as it becomes support. That would be one scenario for this week.
 Next week (Sep 5-9) looks more bullish as Mercury enters Leo and therefore receives the aspect from Jupiter. Since Mercury is considered the planet of trading, this has the potential to significantly lift sentiment. I would therefore expect up days to outnumber down days for the week with declines probably coming near the end of the week on the Mercury-Neptune opposition. This could be a good opportunity for the Nifty to take a run at the 20 DMA at 5100 and perhaps even go higher. The following week (Sep 12-16) is more mixed again with aspects in both directions. Venus enters Virgo for Monday which is likely a bearish influence. However, Mercury will form its exact aspect with Jupiter midweek so this could easily offset any preceding declines. I would not rule out a possible rally to 5300 and the gap fill at this time, although a lot will depend on how the market fares beforehand. Also, the Saturn-Ketu aspect will be just two degree before exactitude at this time, so it is difficult to know to what extent the positive aspects will be nullified by the approach of this unpredictable and bearish aspect. It seems likely that the most negativity from this aspect will occur in late September. It is possible that it will carry over into early October as there are several conjunctions involving Saturn that could extend the decline. 4000 is possible by October, although if we happen to rally back to 5300 by mid-September, then perhaps that precludes 4000 and a decline to 4500 is more likely. Some rally is likely to begin in late October on the Jupiter-Pluto aspect and extend into November. But November looks like it will have more downside again.
5-day outlook — neutral-bullish NIFTY 4800-4900
30-day outlook — bearish-neutral NIFTY 4500-4800
90-day outlook — bearish NIFTY 4300-4600
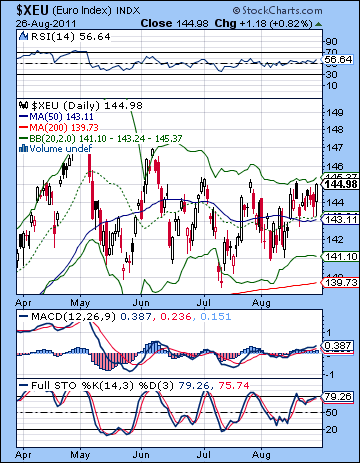 The Euro edged higher last week as no news was good news for everyone’s favourite fledging debt-ridden currency. The Euro finished the week just under 1.45 while the Dollar continued to slip back towards its May low of 73. The Rupee was also weaker closing above 46. I thought we could see more downside for the Euro around the late week Mars-Saturn aspect but the declines were very modest indeed and barely nudged the 1.43 level. Friday’s gain pushed the Euro towards resistance once again and it is now forming an ascending triangle over the past few weeks. This is a more bullish pattern and offers the prospect of an eventual breakout higher. MACD is in a bullish crossover and rising while Stochastics are getting almost overbought. Given the narrow channel the Euro has traded in recently, a move close to the 80 line suggests a move lower sooner rather than later. The past two weeks has seen the Euro strengthen so that it is bumping up against the upper Bollinger band and it is finding support at the 50 DMA. Given all the problems in the Eurozone, could the Euro actually be priming for a rally higher? It seems unthinkable and yet the technicals do offer some evidence for such a a move.
This week should see more upside for the Euro as Monday’s Venus-Jupiter aspect ought to encourage the risk trade. But the good times may not last long as the midweek Mercury-Rahu aspect could produce some uncertainty that could spark a retreat to the safety of the dollar. There is also a Mars-Mars aspect in the Euro chart that offers some credence to the notion that we will see some downside at some point by Wednesday. A late week rally is also possible around the Sun-Jupiter aspect on Thursday and Friday. This is more uncertain than either of the previous two aspects, however, as the Mars-Rahu aspect could upset the positive effect of this combination. In addition, the Saturn-Ketu aspect will be getting very close to the natal Mars in the Euro chart so some declines are more likely as we move into September. So it’s possible that the Euro could actually break above resistance at 1.45 here. It may not get that far above, however, as the Saturn-Ketu aspect begins to bite my mid-September. It is unclear what these currency moves will represent in terms of the equity markets. The previous direct relationship has largely disappeared as the Dollar reflects domestic economic problems in America. Some rebound is possible in October and November but December and January look quite bearish for the Euro as Saturn sets up opposite Jupiter.
Dollar
5-day outlook — bearish
30-day outlook — bullish
90-day outlook — neutral-bullish
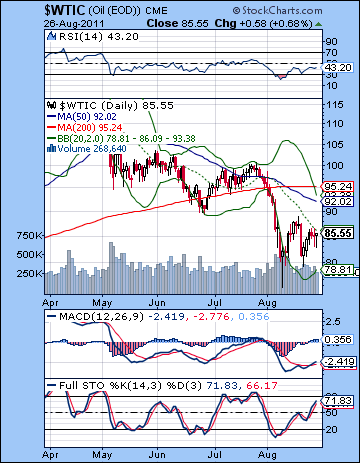 Crude showed its growing resilience last week as it gained more than 3% closing above $85. While part of the rise was due to the ongoing turmoil in Libya, crude was carried along by the technical bounce along with equities. While I thought we might get some rise early in the week on the Sun-Neptune aspect, the extent of the midweek decline was more modest than expected. Friday’s gain was in keeping with expectations as it arrived on the beneficent heels of the Mars-Saturn aspect. Crude appears to be forming a triangle pattern here with lower highs and higher lows. A breakout in either direction will eventually occur and perhaps fairly soon as the trading range is rapidly narrowing. Stochastics (71) are rising and have more room to move before becoming overbought. MACD is in a bullish crossover and is rising. Price has bounced off the lower Bollinger band and is now close to the 20 DMA. If it can push above the 20 DMA, then it could very easily rally to the top Bollinger band at $93. This is also the general area of the 50 and 200 DMA and forms some significant resistance. If it fails to rise above the 20 DMA, then we could see a sell signal on the daily Stochastics in the form of a crossover.
This week has a reasonable chance for some upside. Monday’s Venus-Jupiter aspect is usually a positive influence. The midweek looks somewhat less positive, however, as the Mercury-Rahu aspect could see some profit taking. Thursday and Friday could see significant moves in both directions as the Sun-Jupiter aspect is likely to produce at least one up day. But the presence of Mars-Rahu at the same time may offset some of that upside. Perhaps Monday will see crude push decisively above $85 but then it may test support at $85 by Wednesday. I would also not rule out a deeper pullback at that time. It’s hard to know where crude will be this week as the late week is somewhat equivocal. My best guess is near current levels. Next week could see more upside on the Mercury-Neptune aspect but there will be some downside also. This may produce a net upside bias. The end of September looks more bearish on the Saturn-Ketu aspect, although I should note that this aspect does not make any direct contact with the crude natal chart. It’s still a bearish influence, but it is possible the downside may not be major. October will feature a sizable rally as Jupiter aspects Pluto and this should be in place until about mid-November. The next major down move should begin in December and continue into February 2012.
5-day outlook — neutral-bullish
30-day outlook — bearish-neutral
90-day outlook — bearish
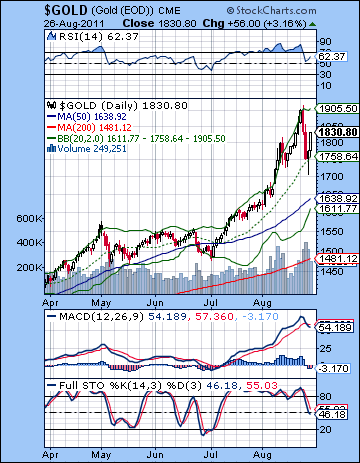 All the talk this week was of gold’s near-death experience midweek when a two-day plunge shaved 10% off its recent high above $1900. After a late week recovery, gold closed only 1% lower just above $1830. While I had been warning about the possibility of a decline in gold in September, I missed this big move here. In retrospect I can see it may have only been partially related to Thursday’s Mars-Saturn aspect. I thought this would bring some volatility but actually it was Tuesday’s Sun-Neptune aspect that likely triggered the selling event. Neptune can be bad news for the Sun and everything it rules such as gold. In addition, the Sun left the friendly confines of Leo and entered tropical Virgo on that day. This was another negative influence on the Sun that I overlooked. Gold now looks more and more like its on the wrong side of the Eiffel Tower pattern after its recent parabolic run-up and it may be subject to more declines in the near future. The late week rebound rally has formed a rough right shoulder here so it is possible it could fall fairly quickly. Wednesday’s low bounced off support from the rising trend line of the June low. But further declines would likely involve a retest of support from the longer term trend line at $1550. Resistance is the previous high of $1905 and in the unlikely event that it eclipses that mark, $2000. MACD is now in a bearish crossover suggesting that the recent rally is a thing of the past. Stochastics (46) could fall further before becoming oversold. This is definitely a bearish looking chart unless gold can stabilize above the 20 DMA at $1760.
This week has a couple of bullish Jupiter aspects that could allow gold to rise. Monday’s Venus-Jupiter is probably the more reliable of the two, and it is possible we could see a sizable up day. Tuesday and Wednesday look less positive, however, as the Moon enters Virgo alongside Saturn. The late week is harder to call. The Sun-Jupiter aspect is very positive but it coincides with a nasty Mars-Rahu aspect. These could cancel each other out, but perhaps manifest sequentially. It seems unlikely that gold will be able to recapture the $1900 level this week, although I do like Monday’s chances for more upside. If the midweek is lower as expected, then perhaps gold ends up fairly close to current levels. However, the technical pressure looks quite real here so I would think the bias may be down. Generally, I think gold should fall in early September, although I would not rule out a final rally attempt just after Labor Day. The odds increase for declines after Sept 12th when Venus enters Virgo. This is a bad placement for Venus and with the Sun following suit the next week, gold may be subject to sharp declines for the rest of September and possibly into October. There is a good chance that it will correct to $1550. October 13th is a possible interim low date at the time of the Sun-Saturn conjunction. Gold will likely rally stronger after that but I do not expect to recapture its $1900 high very soon. January and February look bearish.
5-day outlook — neutral-bullish
30-day outlook — bearish
90-day outlook — bearish

