

Summary for week of September 5 – 9
Summary for week of September 5 – 9
- Stocks may bounce early in the week but more down days possible after Wednesday
- Dollar to resume strengthening by midweek
- Crude could decline near Mercury-Neptune aspect on Thursday
- Gold may move higher but gains may be more modest
Steady as she goes? Despite an impressive rise in the first half of the week, stocks ended mostly flat last week as Friday’s jobs report was a harsh reminder of the fragility of the economy. After a three-day rally to 11,600, the Dow closed marginally lower on the week at 11,240 while the S&P500 lost just 3 points to 1173. While the extent of the early week upside was a little surprising, the overall picture unfolded mostly as expected. The strong Jupiter presence in the market last week boosted sentiment in the early week. I thought we would get some kind of rise around the Venus-Jupiter aspect on Monday and Tuesday. As it happened, gains arrived on both days as Jupiter turned retrograde on Tuesday and gave an added jolt to the bulls. I had noted the likelihood of some negativity in the late week period around the Mars-Rahu aspect. I thought this would likely manifest on Thursday or Friday and we ended up lower on both days.
So far the market is behaving more or less according to plan as Jupiter’s re-emergence recently has helped to provide a lift after the August 8 low. Last week was a potentially pivotal week since it is possible that Jupiter’s bullish energy has peaked near its retrograde station on August 30. As Jupiter begins to pick up speed again, it will weaken somewhat and this could undermine support for the recent rally that has seen the SPX rise from 1100 to 1220. This is not to say that the rally will necessarily fizzle and we head lower once again. While that is possible, I would not expect such a quick shift in planetary dynamics. As I have been pointing out over the past weeks, the real test for the bulls will be the upcoming Saturn-Ketu aspect in late September. Since we are only three weeks away from this aspect, time may be running out on the bulls before they have any hope of reversing the dominant trend in the market. The longer the market fails to recapture major support levels such as 1250 and 1270, the more difficult it will be to prevent a final sell-off that forms a lower low. If the SPX cannot get back to 1250 soon, weak bulls will get nervous and begin to unload their positions. That said, Jupiter isn’t done quite yet as it remains in wide but separating aspect with Venus and the Sun and will begin its favorable aspect with Mercury this week starting on Monday (Labor Day). The entry of Mercury into Jupiter’s sphere of influence is potentially bullish for the next two weeks or so, but it is unclear if it will be enough to supplant the loss of the Sun and Venus once they move out of range of Jupiter. In practical terms, this means that the odds for a sudden rally back to 1250 are diminishing here, although I would not completely rule out such a move. The looming presence of Saturn-Ketu in the background here make rally attempts look fairly tenuous, even if the indexes manage to remain above key support levels.
 The technical picture remained long term bearish last week even if the bulls tagged a significant resistance level of 1230 before we got a reversal lower. The inability of the bulls to push above the rising channel off the Aug 8 low increased the power of the bear flag pattern — two weeks of higher lows and higher highs against a backdrop of a larger decline. Even if the SPX did rally to 1230, bulls could not break out of this bearish pattern. As a result, the longer term picture became a little more bearish as it increased the likelihood of another leg down below 1100 sometime in the next few weeks. The triangle pattern had been key to last week’s trading and we broke above that on Monday. The sell-off on Thursday and Friday brought a back test of this triangle resistance turned support at 1170-1175. Bulls therefore have two key levels to defend. First is 1170 and the support of the triangle and the second is the bottom support trend line of the bear flag near 1150. I think the key support level here is 1150 since a break below that level would invite a rapid retest of 1120 and 1100. It would confirm a bearish breakdown of the bear flag and suggest lower lows ahead. A clear break below 1150 therefore would be a good shorting opportunity, at least down to previous lows. Meanwhile, bears can probably smell blood here as 1230 held firm. But even if we see a rise above 1230 ii may simply be a continuation of the bear flag pattern and hence the overall bearish outlook for the market would not change. It’s only a close above 1270 or so that would jeopardize the bearish view.
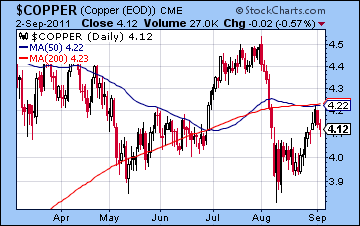
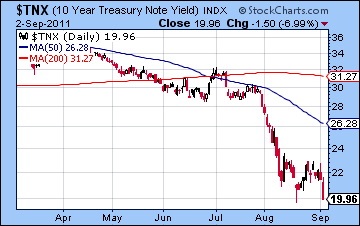
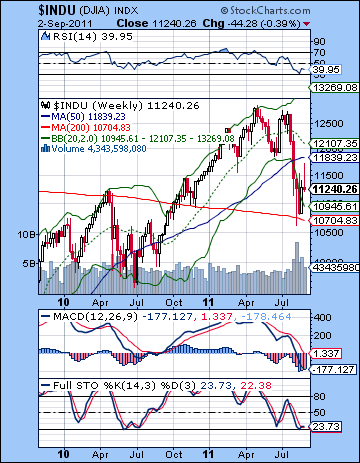 We can see that this pullback was perhaps in the technical cards as the Stochastics indicator was overbought. It is now falling below 80 and may have more downside here before turning up again. We can see how the SPX reversed lower just as it approached the upper Bollinger band. It could find support at the 20 DMA here. RSI looks like it might be rolling over at this point and thus completing a bearish down trend from previous peaks. The weekly Dow chart should not make bulls comfortable. There is a deepening crossover between the 13 and 34 EMA suggesting more downside is likely. Last week’s rally ended just shy of these two moving averages — not a bullish indication. MACD remains in a fairly deep bearish crossover. On the plus side, it is possible that we are seeing the beginning of the bullish crossover in Stochastics although that may be fairly thin gruel for the bulls given the absence of any other positive indications. As expected, copper rose towards its 200 DMA but then backed off to 412 on Friday. This is not particularly bullish although as long as 390 holds, the chart will offer support to the bullish view. The bad jobs report pushed bond yields down back to 2008 levels as the 10-year closed below 2%. This is more evidence that stocks will move lower as the bond market has priced in more asset deflation. The wild card here is Ben Bernanke and what the Fed has up its sleeve on Sep 20-21. If they come out with new stimulus this will push yields up fairly soon and may well lift stocks with it. But it is interesting that bond yields are falling so sharply here even though the bad jobs report increases the likelihood that the Fed with intervene once again. The bond market seems to be calling Bernanke’s bluff here since his hands may be tied by concerns over inflation.
This week looks more mixed with a potential downside bias. Monday’s closing for Labor Day may exclude consideration of the potentially positive entry of Mercury into Leo. By entering Leo, Mercury will come under the influence of bullish Jupiter starting Monday and lasting for almost two weeks. However, some of the effect may be lost by Tuesday although I would not rule out some upside at that time. Wednesday could be interesting because on that day the German High Court will rule on the legality of Germany’s financing of the European bailout fund. If the court finds it unconstitutional, then it would further jeopardize the EU economies. Mercury will approach its opposition to Neptune just shortly after this announcement, so there is a good chance for some downside perhaps on Wednesday and Thursday. Thursday is perhaps somewhat more likely to be negative given the minor Sun-Saturn aspect. However, Trichet and the ECB are rumoured to possibly announce a 50 point rate cut on Thursday — perhaps as a reaction to a negative court ruling — so that may postpone Eurogeddon for a while longer. And yet Friday does not look bullish as Mars enters sidereal Cancer. This is usually a negative influence that speaks to greater volatility and sudden moves. The bearish influences appear to cluster more in the second half of the week here with some possibility for gains early in the week. If this scenario occurs, then we could rise back to 1200 to by Wednesday but then retest the bottom of the bear flag at 1150 or so by Friday. That said, I can’t quite bring myself to see that much upside this week if only because the aspects do not look that bullish. Of course, Jupiter is still extremely strong here so it is possible that Mercury entry into Leo could activate it somewhat. I am uncertain how the technical logic will play out, however. A run up to 1200 doesn’t really do anything special for either side. And another back test to 1170 or 1150 will also keep the current situation intact. Perhaps that is what this week will do — just extend the uncertainty for another week. I do not expect any dramatic downside moves right here. But if the early week does not rise much, then there is a greater chance that we will test support at 1150. I would not rule out lower prices than that, although such a large move does not seem probable.
 Next week (Sep 12-16) may begin positively but the second half looks more negative. Venus enters Virgo here (a medium term bearish influence) but its aspect with Neptune could be enough to take prices higher. Mercury will also be approaching its aspect with bullish Jupiter by Wednesday so that suggests at least two up days here, perhaps even three. But the second half of the week will likely turn bearish again as Mars forms an aspect with Neptune. I would not expect a huge move here either and it is difficult to say if the week will be positive or negative. I would tend to think the bulls will win the day, however. The following week (Sep 19-23) looks more negative as the Saturn-Ketu aspect is exact on Friday and Mars comes in to join the bearfest at that time also. Bernanke has scheduled a two-day Fed meeting for the 20-21 so the market could easily sell off in either disappointment or just "the news." Thursday and Friday definitely have some serious downside potential. More than any other aspect up to this point, this pattern looks like it may test support of either the bear flag at 1150-1160 or in the event that we have already broken below that level, then 1120. Then we will see a series of conjunctions with Saturn by Venus, Sun and Mercury which all look bearish. These conjunctions will last until October 14. For this reason, there is a good chance that the market will move lower until at least that date. This is not a certainty, however, only a probability as I see it. After that time, Jupiter will gain strength through its aspect with Pluto on Oct 28 and later through its extended aspect with Uranus in December. A significant rally is likely to last from mid-October all the way until December. Some negative aspects will occur in November but they do not look strong enough to immediately derail the rally. A new correction will likely emerge in December and January as Saturn enters Libra and opposes Jupiter.
5-day outlook — bearish-neutral SPX 1150-1180
30-day outlook — bearish SPX 1100-1150
90-day outlook — bearish-neutral SPX 1100-1200
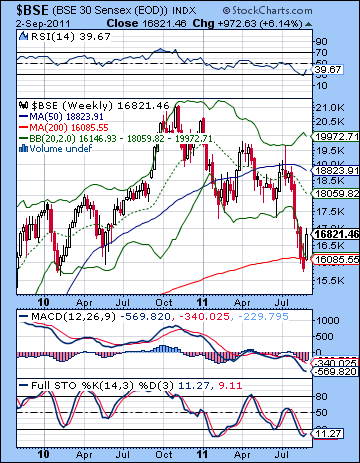
 Stocks surged last week on improved global sentiment as bargain hunters moved in to scoop up battered issues. As if to put an exclamation point next to the rally, the Sensex rose almost 1000 points on the week closing at 16,821 while the Nifty finished at 5040. While the extent of the move was a little surprising, this bullish result was largely in keeping with expectations. The combined effects of Monday’s Jupiter retrograde station and Venus-Jupiter aspect pushed prices higher. Certainly, I thought Monday would be the most bullish day of the week and indeed we saw a huge 3% gain on that day. Tuesday’s rise apparently derived from the lingering Venus-Jupiter aspect. Most surprising was the absence of any pullback in Friday’s session which I thought might be more negative given the Mars-Rahu aspect. This aspect affected global markets more directly but Mumbai managed to escape the worst of it. Even here, I noted that the presence of the Sun-Jupiter aspect on Friday made a decline somewhat less certain.
As expected, Jupiter has returned to prominence around its retrograde station and has reversed the negative sentiment that had surrounded the market since late July. The question now is: how long can the rebound last? While Jupiter is still quite strong, it is unclear if it can push prices much higher as there remains only one more bullish aspect — that of Mercury-Jupiter on 14-15 September. As Jupiter picks up speed in its backward journey across the sign of Aries, it will begin to lose some strength. The Mercury-Jupiter aspect will give it a small boost, but it is unclear how much of this energy will translate into higher prices. I tend to think that most of the Jupiter-fueled gains are behind us. The weak US jobs report on Friday has once again sounded the drum beat for the Fed to intervene with QE3 or some such in order to spark the economy back to life. This is what one should expect when expansionary Jupiter is dominant. The problem for the equity markets is that not only is Jupiter gradually losing strength, Saturn is likely growing in power. A strong Saturn is usually bad news for stocks as fear and pessimism rule the roost and this prompts investors to sell and seek safe haven from risky assets. The renewal of Saturn in September is likely to put downward pressure on stocks once again so that recent lows will be severely tested. Jupiter’s optimism looks slated to return in late October when it forms an important aspect with Pluto but this may only provide a temporary respite from the selling. Another stimulus program out of the Fed is likely at some point in the autumn, most likely in December when it aspects Uranus. Inflation is likely to move onto the front burner once again at that time. Overall, the next few months are shaping up to be quite bearish.
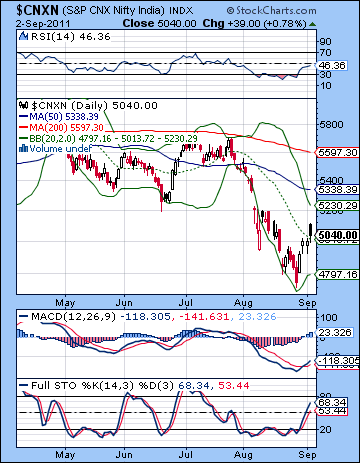
 The technical picture improved somewhat for bulls but the rally was overdue. As expected, the wedge broke higher as support in the 4800 area proved to have some lasting impact. Monday’s gain therefore saw a bullish crossover in the daily MACD and Stochastics also broke out from oversold levels. Stochastics still has some room to run higher here although investors in long positions should be alert to any possible bearish crossover in that indicator. Since this is very much a temporary bear market rally until proven otherwise, it will not take much to prompt some selling. RSI has climbed back to 46 although it has yet to cross over the 50 line which would be a bullish signal. Last week I noted how the 20 DMA is often a target for bear market rallies. Friday’s gain leapt over that line although the late day weakness made for a close that was barely above the 20 DMA. Resistance is now around the upper Bollinger band at 5230 and of course the gap at 5300 could serve as a magnet for prices in the event of another move higher. Support is still around 4800, although a return to that level would create a bullish inverse head and shoulders pattern. Bears therefore require a new low below 4750 in order to increase the chances of lower lows.
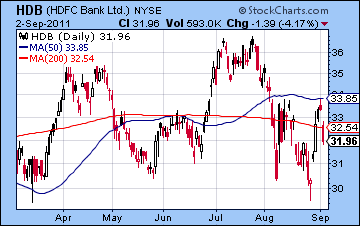
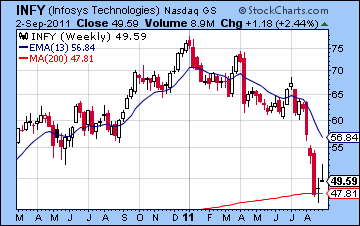
The BSE weekly chart shows the apparent importance of the 200 WMA as support. Notice how we bounced off that line and then moved higher last week. But it is still just a bear market rally — unreliable and probably quite short-lived. The 13/34 EMA crossover is still very much in play and suggests the market has further to fall. MACD is also in a bearish cross and is falling. To make the market that much less appealing, it is also now below the zero line. Stochastics (12) offers some rays of hope for bulls because we can spot the beginning of a bullish crossover. This is a fairly positive technical development in the weekly chart when it occurs below the 20 line. But it needs more follow through to the upside to confirm it as a buy signal. For the moment, it is only an artifact of last week’s rally. HDFC (HDB) enjoyed a good week despite some late week selling of its shares on the NY exchange. It is trying to stay above the 200 DMA here and to do so would be quite bullish. More problematic is that we can see a possible right shoulder of a head and shoulders pattern developing as it tries to rally to 35. Although this would elevate back above the 200 DMA, the pattern is a bearish set up and should therefore be treated with caution. Infosys (INFY) shows the more listless side to the market here as gains did little to change its overall bearish position. It bounced from the 200 WMA but any rallies will likely be sold. A rally to the 13 week EMA and the gap at 56 would likely spark a reversal back down. At this time, I think most Indian stocks require an extended period of consolidation before any major rally can be staged. They simply cannot reverse on the spot and run back up.
 This week looks more mixed as some positive early week signals may be undermined by more trouble later in the week. Mercury enters Leo on Monday and thereby falls under the influence of Jupiter’s aspect. While this aspect is still far from exact, it could support sentiment to some extent. I’m not expecting any great updraft in prices, but it seems possible that we could see further gains. The second half of the week looks more active in both directions, however. Thursday’s Mercury-Neptune opposition could create some selling, especially since a bearish Sun-Saturn aspect will be forming around the same time. While I would not rule out a down day Wednesday, Thursday seems to be a more likely time when this negative energy will manifest. It is worth noting that Germany’s High Court is slated to hand down a decision on the legality of Germany’s participation in the EU bailout fund on Wednesday 7 September. If this is a negative decision, then we could see a downdraft near the close. I am not sure at what time the decision will come, however. That makes Thursday somewhat more likely to see declines. Friday has aspects on both sides. Mars enters Cancer in the afternoon and that is usually a bearish influence. However, I can also see that Venus could be active in the NSE chart. This could mitigate some of the potential downside from Mars. I would still lean bearish for the end of the week overall, however. So it seems unlikely that we will see much more upside given the absence of any clear aspects. Perhaps modest gains are more likely, perhaps to 5100-5200 by Wednesday. Then I would expect more pressure towards the end of the week with a return to current levels quite possible. I would also not be surprised to see the Nifty actually lower on the week overall. While it is a very mixed call, I would lean slightly bearish here.
 Next week (Sep 12-16) looks like it will begin mostly bullish but again sentiment may sour by week’s end. The key here is the exact Mercury-Jupiter aspect on Wednesday 14 September. This is a bullish combination that is likely to keep prices high until that date. Wednesday is also bullish due to a Venus-Neptune aspect. These gains should be sizable, although nothing too dramatic I don’t think. But the 15th and 16th look more bearish as Mars aspects Neptune and Jupiter continues to weaken. Much of the prior gains may be lost by Friday. In a more bullish scenario, this might mean a run up to fill the gap to 5300 by the 14th and then a quick retracement back to 5100. The following week (Sep 19-23) could be quite bearish indeed as the Saturn-Ketu aspect is exact on the 23rd. These are two slow moving planets so it is possible their most potent energy won’t be released exactly on the day of their aspect, but it should be close. The Fed meets just two days prior on Sep 20 and 21 so it sets up the real possibility of disappointment in whatever they announce. I am expecting more downside as we head into October with a possible low occurring on 14 October near the Sun-Saturn conjunction. Where the low will ultimately be remains to be seen. I think there is a good chance of 4000-4500 although if we run up to 5300 in mid-September, then it is conceivable that we only get a double bottom at 4750 in October. I don’t think this is likely but it is possible. Some recovery is likely at the end of October and into November as Jupiter forms an aspect with Pluto. The rebound rally may last through to December. Saturn’s entry into Libra in December may dampen the mood, however, as it prepares for its opposition aspect to Jupiter in January.
5-day outlook — bearish-neutral NIFTY 4950-5100
30-day outlook — bearish NIFTY 4500-4800
90-day outlook — bearish NIFTY 4500-5000
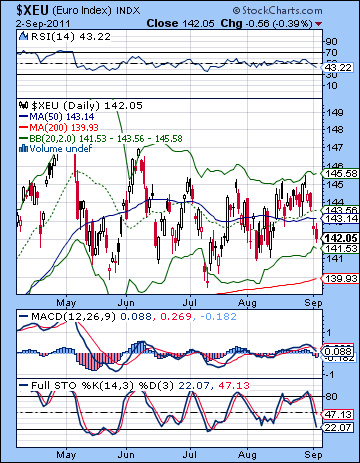 The Euro inched one step closer to oblivion last week as the latest chapter in a simmering bank crisis threatened to reach a full boil. Greek bond yields are again spiking as whispers grow that several private banks may not be able to survive. Rumours abound that ECB Chair Trichet may announce a 50 point rate cut this week in order to ease the crisis. The Euro closed down more than 1% to 1.421 while the Dollar Index finished the week at 74.76 and the Rupee strengthened to 45.87. While I thought we might see the upside last a little while longer, this result was not really surprising. As expected, we did see the Euro pop above resistance of 1.45 on Monday’s Venus-Jupiter aspect but it then sank back into the pennant pattern. The late week Mars-Rahu pattern was bearish as expected as the Euro moved towards the bottom Bollinger band. From a technical perspective, nothing much has changed as the pennant remains in play. MACD has entered a bearish crossover however just as it reached the bottom of the support level. That is a potential problem. On the other hand, Stochastics are again near the oversold level and thus may inspire some bulls to take long positions once again in order to ride it back up to resistance for the Nth time. The key support level is still the 1.40 area below which support is reminiscent of Wiley Coyote on a cliff holding a broken branch. 1.30 would be a potentially quick next stop.
This week could see a recovery for the Euro at least in the early going. The Mercury-Neptune aspect midweek may produce some selling but I am not expecting any swan dive to occur right now. By Friday, the Euro could well be not very far from current levels and it may even be higher. Next week could begin even better as the Mercury-Jupiter aspect forms a bullish alignment with the Sun in the Euro chart. At the same time, Venus is crossing the ascendant of this chart. This therefore is a good candidate for an important high in the Euro. September 14-15 is likely going to be very close to this interim high. It may well prove to be within the triangle pattern. After this date, however, things may get more difficult as the Saturn-Ketu aspect will hit the Euro’s Mars. This could bring some sudden moves and panic selling is a possibility. I would be quite surprised if we did not see a significant decline at this time. We should get a bounce in late October and this could carry into November. But the Euro looks pretty weak as we move through December and January. I think there’s a chance we could get to 1.20 by January.
Dollar
5-day outlook — neutral-bullish
30-day outlook — bearish
90-day outlook — bearish
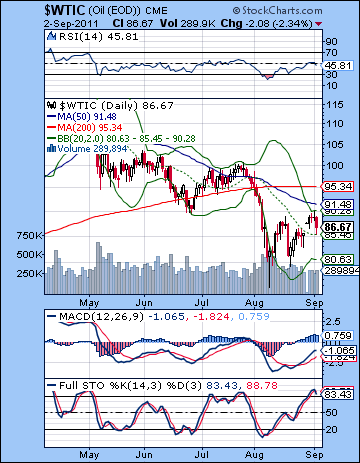 Buoyed by early week gains, crude finished 1% higher closing a little under $87. I had expected some early week upside around the Venus-Jupiter aspect and that is exactly what we got as price bounced up to $89. Bulls managed to push it towards $90 by midweek but much of the enthusiasm waned by Friday’s Mars-Rahu aspect. I had been unsure about the late week although I thought some kind of pullback was possible. Despite the gain, the technical situation is rather delicate here as it rejected the $90 resistance level quite firmly midweek. We can see that $90 is a key level since it was the June low. It is also fairly close to the upper Bollinger band and the 50 DMA. Support may be provided by the 20 DMA here at $85 but a move below that level could see crude drift back to $80 and the bottom Bollinger band. Stochastics (81) are getting overbought here and has a bearish crossover. A move below 80 could well seal the deal and hasten a move back to $80. A close below $80 might invite a move down to $70 where there is more support.
This week looks fairly mixed as the early week may see some limited upside after Monday’s holiday closing in the US. However, Thursday’s Mercury-Neptune aspect does not look favourable for crude and neither does Friday’s entry of Mars into Cancer. Where we finish overall is hard to say. I would not be surprised if we ended fairly close to current levels, although the negative aspects do appear to look less equivocal than the positive ones. Perhaps that is an argument for retaining a bearish bias this week. While next Monday might be negative, next week looks fairly bullish as the Mercury-Jupiter aspect on Wednesday and Thursday should raise prices. It is possible that they will return to the $90 level. But the second half of September looks more bearish on the Saturn-Ketu aspect. It is difficult to estimate just what the effects of this aspect will be. It is a negative influence to be sure, and yet it does not form close aspects with the Futures chart. It is therefore conceivable that the downside could be fairly modest. It is even possible that we may not break below $80 on this next corrective move. Some kind of rebound rally is likely in October and November which could regain previous resistance levels, perhaps even to $90. However, a new correction will likely begin in December and last until January.
5-day outlook — bearish-neutral
30-day outlook — bearish
90-day outlook — bearish-neutral
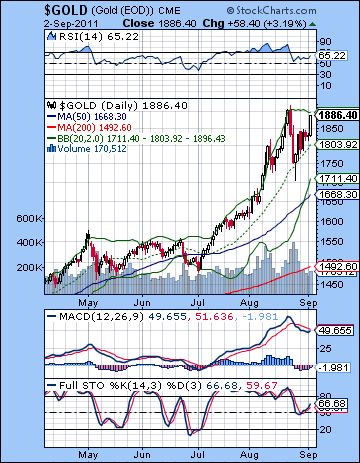 Gold staged a stunning comeback last week as it regained its safe haven crown once again as uncertainty resurfaced over the US economy and the possibility of further inflationary stimulus from the Fed. Gold rose more than 3% closing near $1886 and just a stone’s throw from its all time high at $1917. While I noted some positive aspects in the mix, I had been uncertain about gold last week thinking it might finish at or below previous levels. The early week Venus-Jupiter aspect did produce a gain, but only after Monday’s sell-off. This was a little unsettling to be sure, and I wondered how much juice was left in the tank. But Jupiter’s station on Tuesday proved to be up to the task as gold quickly found its legs. Some midweek profit taking was then followed by Friday’s surge. I noted the possibility of some late week upside on the Sun-Jupiter aspect although the close proximity to the bearish tandem of Mars-Rahu made me wonder just how it would manifest. The technicals look quite mixed here as the bearish cross in the MACD is showing signs of breaking up again. Stochastics have a bullish crossover now and have further upside to run before becoming overbought. Could gold actually make another new high? The technicals suggest that such a move is possible. The bull rally is still very much intact as the 20 DMA is serving as good support at $1803. The weekly chart remains massively overbought (RSI = 82!) but no one seems to care since Bernanke is threatening to debase the Dollar and print more money in order to solve a debt de-leveraging process.
While last week’s gains were impressive, time may be running out on gold as the Jupiter retrograde station is now behind us. There is one more Jupiter aspect on the 14th-15th with Mercury that could elevate gold, but I wonder where its planetary support will come from. Saturn-Ketu is unlikely to do gold any favours at the end of September. And after Venus enters Virgo on the 10th, we could see gold erode faster. Some moving average crossovers may well provide the technical sell signal, but all this Saturn energy is likely to also suggest that gold’s correction is now upon us. This week could see some modest gains perhaps into midweek. I would not be surprised to see gold a new all-time high. The late week looks less bullish however as Mars enters Cancer on Friday. More upside is possible into midweek and the 14th. The second half of September should be more bearish, however. A correction back to $1550 and the medium term trend line is possible by October, although we could also fall a little short of that magnitude of correction. Let’s first see how bearish some of these early aspects turn out to be.
5-day outlook — bullish
30-day outlook — bearish
90-day outlook — bearish