Summary for week of September 19 – 23
Summary for week of September 19 – 23
- Stocks vulnerable to significant declines this week especially early and late
- Euro should retest preceding low near 1.36
- Crude looks bearish this week, although midweek could bring gains
- Gold should be bearish this week, especially in the second half after Fed meeting
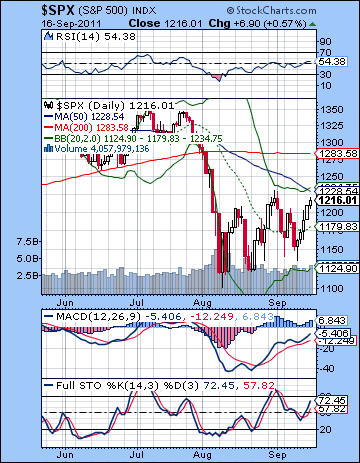 It’s amazing what some soothing words from well-meaning politicians and bank officials can do to the market. All of sudden the Eurozone’s troubles are solved, Greece will not be permitted to default, and the banking crisis has been averted through a coordinated injection of fresh liquidity. Well, one can’t blame them for trying. Talk was all the markets needed last week as we saw gains on all five days. The Dow rose more than 4% on the week closing at 11,509 while the S&P500 finished at a hefty 1216. Even though I thought we would move higher on the Mercury-Jupiter aspect, I wasn’t fully expecting the rise to be so relentless and so strong. I guess the moral of that story is never underestimate the bullish potential of 1) options expiry week and 2) the run -up to a major FOMC meeting this week. It turns out I was correct in thinking that Monday presented a bit of a dilemma. I thought the immediate aftermath of the entry of Venus into Virgo could be bearish and that this might jeopardize a critical support level at 1150. Monday started bearish and we actually went all the way down to 1136 before the bulls rushed in and produced a green close. It was all Mercury-Jupiter after that as we got the biggest gains on Wednesday and Thursday during the closest angle between these two positive planets. I was most disappointed by the absence of any downside on Friday on the Mars-Neptune aspect. While did not change my overall sense of the market’s direction, it was proof of Jupiter’s residual bullish energy.
But how much more bullishness does Jupiter have left? If this rally off the late August low can be explained in terms of Jupiter, what are the prospects now that Jupiter is not slated to form a major aspect with another planet until late October? This is one very important reason why I think the upside potential here is quite limited. While Jupiter can form minor aspects, the odds of another major move higher to say, the top of the flag pattern at 1260 seem less likely now. It’s still possible of course, but there is not enough obvious Jupiter energy available for that to happen. We should also note that we are in the bullish half of the Moon cycle which culminates in next week’s New Moon. It is interesting to note that we got a significant low exactly on the day (Monday) of the Full Moon. So it is possible that the presence of the bullish lunar cycle here may give a modest boost to the bulls over the next week. Jupiter appears to be fading here but Saturn may be strengthening in the days ahead. I’ve been talking for a while about the probable bearish impact of the Saturn-Ketu aspect which is exact this week. This will begin a series of conjunctions with Saturn over the next few weeks which could be challenging for the market. Admittedly, conjunctions are less bearish than square or opposition aspects, but Saturn is still Saturn. That means that the odds for a down trend will rise over the coming weeks. While no astrological pattern has certain outcomes, we can still say that our astrological indicators tilt bearish, Moon cycle notwithstanding.
 The technical picture has greatly improved for the bulls. While we pierced below support on Monday, the recovery was swift and powerful. Bulls broke above the falling trend line resistance at 1180 and also exceeded the head and shoulders high of 1204. They haven’t seriously challenged the Aug 31 high of 1230 yet, however. The medium term picture still looks bearish as 50 DMA is below the 200 DMA and both are pointing down. For all the bulls new-found strength, it is really still a question of how far they can push this bear market rally. They are encountering more resistance here around 1220 and 1230. The 50 DMA comes in at 1228 so that may become a convenient place for bulls to abandon ship. Of course, the bear flag is still very much in play here although it could also be seen as a bearish head and shoulders pattern around the 1230 top. This gives us two possible interpretations. The bear flag could culminate at 1260 which would be the channel resistance line. Significantly, 1260 is also the horizontal resistance from the previous lows in June. From a purely technical perspective, 1260 may have a certain magnetic power to draw prices toward it. It therefore may be seen as a shorting opportunity of last resort for the bears. In the event of a pullback, the first level of major support would be the falling trend line at 1160. If that fails to hold, then we could revisit the lower part of the bear flag around 1140 fairly soon after. Only a break below this support level would spark a retest of the August low of 1102 and open the possibility of lower lows. But as long as MACD remains in a bullish crossover, the short term trend is up. Stochastics (72) is similarly in a bullish crossover and is not yet overbought. This is another positive technical indication. Until we see bearish crossovers in these indicators, the bulls will remain in control of the short term trend.
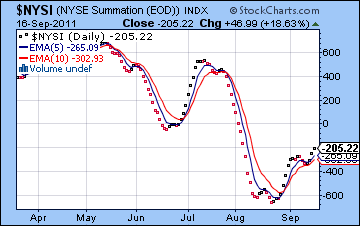
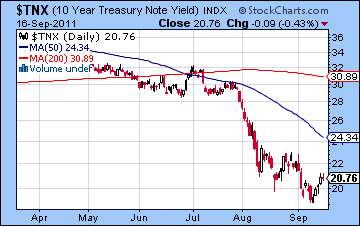
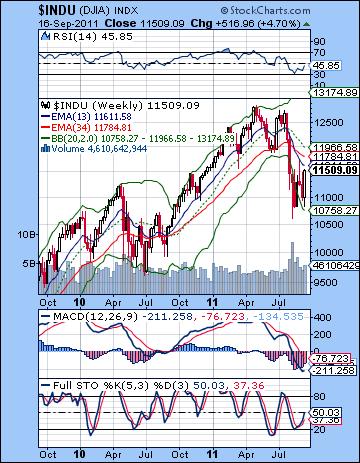 The NYSI Summation Index suggests the same thing — that we are in a short term bullish rebound. The index remains above the 5 and 10 EMA and therefore is still showing a buy signal. Like all of our indicators, this is lagging and so one has to be careful to not over-interpret it for very short term swings. It had a bullish crossover around Aug 29 just a couple of days before the high of 1231. Although bullish for the last three weeks, one would have lost money by following it religiously. It is nonetheless a useful indicator for tracking the market. The weekly Dow chart shows how we are still on the bear side of a 13/34 EMA crossover, although the gap has narrowed slightly. Stochastics (50) is breaking higher suggesting that more upside would be possible. RSI has climbed back to 45 and we could conceivably see it rise back to 50 before it falls again. This is what happened in the last major correction in mid-2010. As stocks rose last week, bonds yields followed suit as the 10-yr ended near 2.1%. Bonds seem reluctant to to surrender their recent gains here as the 10-year yield is sitting on resistance at the 20 DMA. Also note that Friday’s yield actually declined despite the gain in equities. Since bonds often lead stocks, one can still say that there could be more downside in store for stocks. And its worth noting that copper did not participate in last week’s advance as it closed lower at 393. It could be setting up for a move lower here. Perhaps the most bearish technical indicator of all comes from the currency markets (see currency section below). The Euro back tested its resistance level last week but could not climb above 1.39. As long as it remains below this level, it will tend to undermine any stock market rally. By the same token, a close above this resistance level would be very bullish for stocks and would suggest another leg higher, perhaps to 1260 at least. It is something that warrants close watching.
This week looks bearish. Not only do we have the Saturn-Ketu aspect becoming exact on Friday, but there are also some other negative looking aspects in play. Mercury will align with the Saturn-Ketu aspect on Monday and could produce a significant down day. The midweek might see an up day although it is not clear to me. Wednesday will see Bernanke make his big announcement after the FOMC meeting. If its good news of major new money printing, then the markets will cheer. If it’s only some variation of the widely anticipated "Operation Twist", then the markets could easily sell off. I would tend towards a negative reaction although I freely admit there aren’t clear aspects in play here. Thursday does feature a minor Venus-Jupiter aspect that is bullish. Also Mercury enters sidereal Virgo that day, so that is another potentially bullish influence. But the late week period does feature a Mars-Uranus aspect which is often bearish so it is possible that we could see selling take place after the market digests the implications of the speech. The other thing to remember is that since we are currently in the bullish half of the lunar cycle, gains may be somewhat greater than expected and losses somewhat less. I still think the week will finish lower overall, and given the aspects in play, there is a decent chance we could finish a lot lower. If Monday plays out as expected, we could easily fall back below 1200 before the Wednesday announcement. That would be my conservative bearish expectation and there is a reasonable chance we could even test support at 1160. Even with a short bounce on Wednesday and Thursday we are unlikely to recapture current levels and Friday sets up with the likelihood of another down day. So while I would not rule out a move back to the lower reaches of the flag pattern/head and shoulders neckline near 1140, that may be a little ambitious for the bears at this point. The most unlikely scenario this week would be further upside gains to 1230.
 Next week (Sep 26-30) may begin positively as the Sun enters an alignment with Uranus and Pluto on Monday. Tuesday’s New Moon could mark an interim high of some importance either because it will represent the top of this rebound (1230 or 1260– unlikely but possible) or it may be a lower high perhaps around 1180-1200. Then Wednesday’s Sun-Mercury conjunction is in close aspect with Mars. This will likely see a major shift in sentiment and begin the next move down. The Venus-Saturn conjunction on Thursday and Friday is likely to see the selling pressure continue. Depending on where we top out beforehand, this may be the time when the SPX breaks support at 1140 and tests some lower levels such as 1120 or 1100. The following week (Oct 3-7) will likely begin bearishly as Mercury approaches its conjunction with Saturn on Wednesday. A significant bounce is likely at the end of the week on the Venus-Neptune aspect. We could get something like capitulation in mid-October on the Mars-Rahu aspect. I say "could" because it is more of a speculative guess, but certainly there is the possibility of a sharp downward move on this aspect. That would set the stage for the Jupiter-Pluto aspect on Oct 28. This should see some rally attempt that lasts from the 14th to about the 26th or so. However, there is a nasty looking alignment of Mars-Venus-Mercury on Oct 26-27 that could bring a sharp sell-off. Presumably, the market will rise to hit some key resistance level at that time (1120-1150?) and then decline. At this point, I am unsure what the overall market direction will be in November and December. I am not expecting any massive rallies at that time, and it is even possible we could see lower lows in November.
5-day outlook — bearish SPX 1140-1180
30-day outlook — bearish SPX 1000-1100
90-day outlook — bearish- neutral SPX 1100-1200
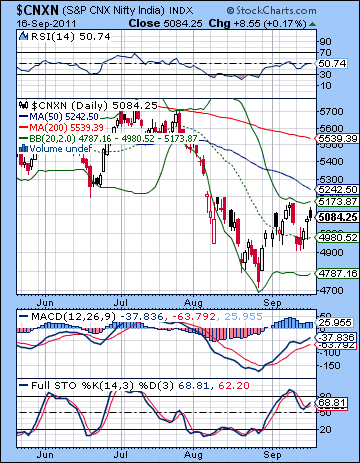 Stocks rebounded further last week as encouraging signs out of the Eurozone offered the possibility that a banking crisis could be avoided as Germany and France once again asserted their support for Greece. Despite early declines, the Sensex ended slightly positive on the week closing at 16,933 while the Nifty finished at 5084. This mildly bullish outcome was in keeping with expectations as I thought the strength of the bullish Mercury-Jupiter aspect would be enough to offset any other negativity. I was correct in anticipating weakness early on as the Venus entry into Virgo proved to be quite bearish indeed as the indexes lost more than 2% on Monday and Tuesday. The rebound arrived more or less on cue as the close Jupiter aspect fell across Wednesday and Thursday. I had expected more downside for Friday on the Mars influence but this did not come to pass. While the bulls eased up considerably, the market still finished higher overall.
With the Mercury-Jupiter aspect now behind us, is there is much bullish energy left to take the market any higher? Stocks have bounced off their late August lows due largely to the resurgence in Jupiter’s energy and the quick succession of aspects involving the Sun, Mercury and Venus. Now that these are finished, it may be more difficult for the market to make much headway. At the moment, the Indian market is captive to the cues coming out of Europe as that region grapples with an ongoing debt crisis. With the Euro now trading below key support levels, it could be very difficult to regain its previous trading range of 1.39-1.45. As long as it remains below this range, it will put added pressure on international markets. And not only will Jupiter’s optimism be in shorter supply, Saturn’s gloom may become more pronounced in the coming weeks as it prepares to make a series of aspects. Saturn aspects are usually bad news for stocks, although there may be some exceptions. In our current circumstance, the likelihood of further declines is somewhat increased by the affliction that Saturn is making to the BSE natal horoscope. Saturn will exactly aspect the natal Sun in this chart over the next two weeks. This not only makes further upside less likely, it also greatly increases the risk of more selling. And with the Fed meeting due Wednesday, one may wonder how this renewed Saturn energy might come into play in terms of any announcement Bernanke might make. A strong Saturn at this time would tend to suggest austerity carrying the day. This may reduce the likelihood of Bernanke announcing a major new stimulus plan. An absence of any new measures could be disappointing for the markets which are increasingly fearful that a recession is just around the corner. While I can’t imagine Bernanke sitting on his hands doing next to nothing (like Operation Twist which has already been baked in the cake), the planets do not strongly suggest that he will pull out all the stops and pump major new liquidity into the system. Either way, it promises to be a fascinating week.
 The technical picture remained generally bearish although with glimmers of hope for bulls. Even with the rally attempt, the Nifty could not recapture last week’s highs. It also reversed before it approached the big gap at 5200. That gap remains a huge line in the sand for the markets here as the inability of the bulls to climb above will become more oppressive as time goes on. Eventually bulls may give up and sell off their positions thus forcing the market lower. On the bright side for the bulls, support was provided for the 20 DMA which suggests that a longer process of consolidation and bottom formation is still possible. Also, we can see a possible inverse head and shoulders here. This is a bullish pattern which would require a breakout above the neckline at 5200 to be confirmed. Again, the gap fill would be a necessary first step before this pattern could play out. The upside target of the pattern would be 5500. This is also where the 200 DMA is located so that is a more plausible objective.
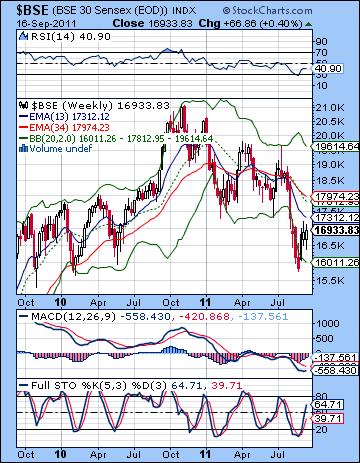
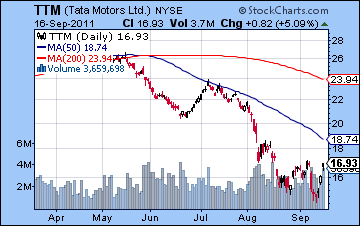
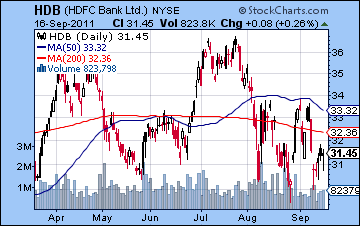
Resistance will likely prove to be quite formidable at 5200, however. Not only do we have the gap to fill, but the top Bollinger band is there as is the 50 DMA. Support at the 20 DMA at 4900 has to hold for the bulls or the Nifty will likely retest the August lows. If 4900 is taken out, then more bulls will be tempted to completely give up and we could easily make new lows for the year. We can see how the latest trough in the market looks on the Sensex weekly chart. These price bars are cut off from the rest of the chart, like an animal trapped in a hole. Unless the Sensex can rally soon and climb above 17,000, it looks increasingly doomed to go lower. Stochastics are in a bullish crossover and promising to rise back towards the 80 line so that should be encouraging for bulls. MACD is still in a bearish crossover, however, although the histograms are shrinking suggesting a reversal is more possible. The medium term prospects of this chart are nonetheless bearish as the 13/34 week EMA are in a negative crossover. It would require a period of a month or two of consolidation and rally before this crossover could be reversed. The whole situation is quite bearish indeed. Looking at individual stocks, Tata Motors (TTM) climbed up off the mat last week and posted a decent gain on good volume as it bounced of its recent lows. This was arguably a technical bounce due to the proximity of the bottom Bollinger band at the low. Let’s see if it can jump over the 50 DMA and the upper band. I suspect these will be significant sources of resistance. HDFC Bank (HDB) faces a similar uphill battle. Early in the week, it held support at the August low suggesting at least some modicum of strength. But the subsequent rally looks quite weak on indifferent volume, perhaps reflecting the vulnerability of the banking sector worldwide these days. It will have to close above its 20 DMA first before tackling the other resistance levels that lie above.
 This week looks more clearly bearish as the Saturn-Ketu aspect is exact on Friday. This is a slow moving aspect so it could manifest at different times through the week. Mercury’s alignment with Saturn-Ketu on Monday suggests there will be some early week bearishness that could be significant. A positive day is possible on Tuesday or Wednesday, most likely Wednesday. It is unlikely to compensate for Monday’s probable loss. The late week Mars-Uranus aspect tilts bearish so we could well end the week on the losing note. This would likely come as a result of the Fed announcement on Wednesday after the close of trading. Perhaps the market will react poorly to Bernanke’s plans. While both Thursday and Friday look bearish, Friday is perhaps more energetic and hence more bearish due to the Moon-Mars conjunction. This could feed into a larger planetary pattern with Saturn and Ketu and produce a major move lower. Overall, this week shapes up negatively with the a gap fill at 5200 looking quite unlikely. If Monday is lower as expected, then we could retest the 20 DMA at 4980 by Tuesday’s open. That is a conservative downside target. Even with some midweek gain, we are unlikely to break above current levels. Like the early week, the late week has the potential for significant downside so I would not be surprised to see the 20 DMA breached. 4800 is even possible here as the aspects do suggest that larger declines are somewhat more likely than they would otherwise be.
 Next week (Sep 26-30) may begin more positively as the Sun and Mercury approach their conjunction on Monday and Tuesday. At the same time, they will enter into an alignment with Uranus and Pluto so that should boost sentiment significantly. There is a chance we could see perhaps two out of three days ending positive between Monday and Wednesday. This is also the time of the New Moon which is often a bullish influence. The late week looks much more negative, however, as the Sun-Mercury pairing forms an alignment with Mars. Thursday and Friday are therefore more likely to see declines, perhaps sharp ones. Although the early week could see a significant rise, the previous week’s probable selloff means that this is unlikely to fill the gap above 5200 on the Nifty. The late week bearishness is likely to erase most or all of the preceding gains around the New Moon. We could see 4500 on the Nifty at this point, although that is very much a guess. The first half of October looks quite mixed with a bearish bias. Declines are likely on the 4-5th with gains probable on the 7th. A large decline is possible on Oct 13-14. Some recovery is likely between Oct 14 and Oct 26 or so as Jupiter approaches its aspect with Pluto. But the market looks weak again going into November. We may see another rally opportunity in the second half of November and into December. It may not be very strong, however. Overall, Q4 is looking quite bearish with lower lows on the indices quite likely. Nifty 4000 is looking more and more probable by November. We should get a significant rally beginning sometime in mid-January 2012. I am still expecting lower lows sometime in 2012, probably at the end of the year. A double bottom of 2500 (the first occurred in late 2008) is therefore looking quite possible here.
5-day outlook — bearish NIFTY 4800-5000
30-day outlook — bearish NIFTY 4500-4800
90-day outlook — bearish NIFTY 4500-5000
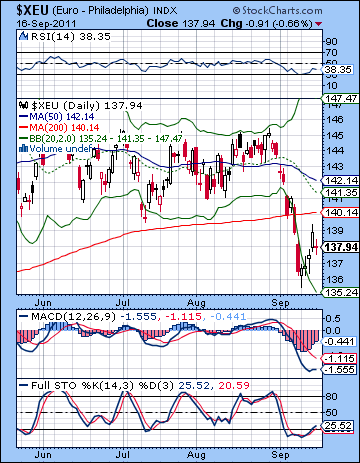 Merkel and Sarkozy did their best to talk up the Euro last week as central banks around the world offered to inject liquidity into the system to avert a banking crisis. Generally, these initiatives were well received by the market as the Euro posted a solid gain closing just under 1.38. The Dollar Index sank to 76.6 while the Rupee slipped further to 47.25. The week unfolded pretty much according to plan as I thought we had a chance to back test the resistance level of 1.39 on the strength of the Mercury-Jupiter aspect. I also thought that Friday could be less positive and we did in fact see a pullback. So while Jupiter shone on the Euro last week, it wasn’t much more than a technical bounce. Friday’s decline made this back test scenario even more likely as we could see a sharp decline now. The indicators do not argue one way or the other. RSI is climbing off the floor at 38 but it could move higher or reverse and head back down. MACD is in a bearish crossover which is shrinking but has a ways to go before crossing over. Stochastics (25) is in a bullish crossover and has moved above the oversold line so it is perhaps the most bullish indicator. Long positions in the Euro would be advised to abandon ship if and when stochastics shows a bearish crossover, regardless of where it is. I would be quite surprised to see the Euro climb back above resistance at 1.39 here. I just don’t see it happening any time soon. If it did, then it would be quite bullish. Stocks would also benefit from a close above 1.40 as it would signal a renewed faith in the Euro.
This week looks mostly bearish as the Saturn-Ketu aspect is likely to see an increase in anxiety. Given the Euro’s key role in the current economic situation, it is quite possible that it will fall further. The Fed’s announcement on Wednesday could also impact the Euro as further loosening or money printing would boost its fortunes. However, if Bernanke takes a more conservative path and does not impress the market with new measures, then the sell-off in the Euro could intensify. The planets would suggest that such a reaction is possible. I am therefore expecting to see the lows of last week tested at the very least. Some gains are likely around the New Moon on Tuesday Sep 27 but it could be downhill after that. I’m not certain the Euro will continue to fall through October, but it might. We could get a significant low in the last week of October. It should be substantially lower than where we are now. A rally is likely to begin in November and continue into December. It could be significant, although I do not expect it to recapture the 1.40 level. Watch for the Euro to take another major dive lower starting in December and lasting into January. This should be a new low, perhaps down to 1.20.
Dollar
5-day outlook — bullish
30-day outlook — bullish
90-day outlook — bullish
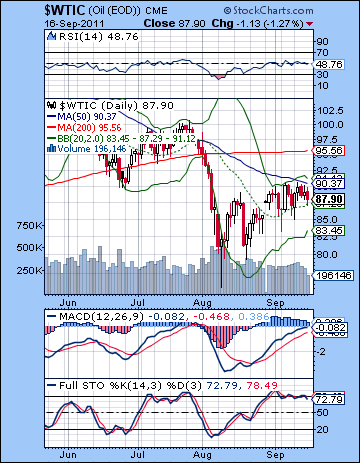 Crude oil edged higher last week as demand prospects as Eurozone worries lessened. After flirting with $90 for the third week in a row, crude closed a little under $88. As expected, the Mercury-Jupiter aspect provided some upside as prices generally rose in the first half of the week. The Moon’s transit of Pisces was also instrumental in the latest push to $90. But the late week Mars aspect was bearish enough that much of the gains were erased. Crude is in a difficult technical situation here as it cannot seem to vault over resistance at $90. This was also the June low and is the neckline from a previous head and shoulders pattern. The 50 DMA and upper Bollinger band are also close by here and that is clearly making this level more impermeable to rallies than would otherwise be the case. We can also see an ascending triangle or wedge pattern here that is narrowing in advance of a major breakout. MACD is in a bullish crossover above the zero line but it is showing signs of rolling over. RSI (48) is similarly showing signs of decay as it slips below the 50 line. Stochastics (72) is also looking more negative as it breaks below the 80 line and is in a bearish crossover. Crude is threatening to become medium term bearish as price has fallen below both the 50 and 200 DMA while the 50 DMA is pointing downwards.
This week looks more bearish. Monday’s Mercury alignment with Saturn and Ketu does not look positive for crude. The bearish mood could carry into Tuesday and we could see prices retreat towards $85. The midweek offers some chance for gains as the Venus-Jupiter aspect lines up with Jupiter in the Futures natal chart. While this is no guarantee of a significant gains, it nonetheless makes gains more likely. It is possible that we could have two up days, although I suspect they won’t be large enough to offset the early week declines. The late week looks more bearish as the Moon conjoins Mars and both form an aspect with Uranus. This could be very bearish indeed and we could see $85 revisited with larger declines also possible. Next week (Sep 26-30) may begin bullishly but the late week is likely to erase those early week gains. Where we finish is hard to say, although I would guess somewhere between $80 and $85. The first half of October tilts bearish with the deepest declines more likely in the second week around the 13-14th. Some recovery is likely for the following week or two, but there is a nasty pattern in the last week of October that could signal a new phase lower that lasts into November. The second half of November may see a significant rally attempt, but December and early January are likely to see a return to bearishness.
5-day outlook — bearish
30-day outlook — bearish
90-day outlook — bearish-neutral
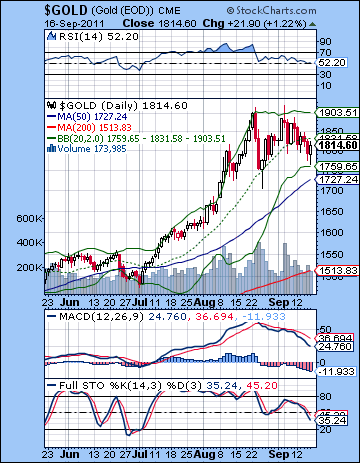 As the debt worries in the Eurozone settled down last week, gold found its safe haven status a little less valued as it fell more than 2% closing at $1814. This bearish result was in keeping with expectations as Monday’s decline set the tone for the week. I thought that the entry of Venus into Virgo on Monday would be a drag on gold and this proved to be the case. The midweek rally attempts were quite weak during the Mercury-Jupiter aspect and bullion actually fell. The late week bearishness on the Mars-Neptune aspect also arrived more or less on schedule as gold sold off on Thursday and only partially recovered on Friday. Gold’s technical position looks somewhat cloudy. Thus far we have a bearish double top pattern in play. The pullback has been arrested at the bottom Bollinger band. Significantly, however, gold could not find support at the 20 DMA as it had previously. This is a possible sign that it may have further to fall. MACD is in a nasty looking bearish crossover that is getting wider by the day. Stochastics are also falling sharply and in a bearish crossover. Where will the correction stop? While it could reverse higher once the Stochastics crosses over in the short term, there is good reason to expect gold to eventually correct down to the rising trend line which is currently around $1575-1600. What makes this level more attractive for support is that there is also some significant horizontal support at this level. Whether or not we see gold move all the way down to the bottom of the 10-year channel at $1300 remains to be seen. I think such a move is possible, but not probable.
This week could be quite negative for gold. The Saturn-Ketu aspect is likely to increase caution which arguably could help gold as investors see it as a safe haven. But the difficulty is that Mars will be in aspect to Uranus at the end of the week. This is more directly stressful on gold and is likely to see significant declines. And the Sun enters Virgo in time for Monday’s session so that is an additional burden on gold for the weeks to come. Even if gold enjoys some boost in the midweek around the Venus-Jupiter aspect, gold should be lower by Friday, perhaps revisiting its recent lows at $1700. I expect we will see gold continue to correct until mid-October and the Sun-Saturn conjunction. This is one possible reversal point where we might see the rising trend line tested at $1600. Gold is likely to begin to rally sometime in late October and this should last into November. This is very unlikely to make new highs and will probably only form a 50% or 61% retracement of the August high. Late November and December will see gold fall again and it will likely retest that trend line and it is quite possible it will move lower still. In January and February, gold could bounce sharply and this bullish trend could continue intact through most of 2012. Depending on how the technical factors line up, January 2012 could be a good entry point for the medium term. A major correction is likely to begin at the end of 2012 and continue through the first quarter of 2013.
5-day outlook — bearish
30-day outlook — bearish
90-day outlook — bearish

