Summary for week of October 31 – November 4
Summary for week of October 31 – November 4
- Stocks likely weaker early with rebound likely by midweek
- Euro may test support at 1.40 early but rebound midweek
- Crude mixed this week with some gains likely by Wednesday
- Gold more subject to weakness but midweek gains could offset
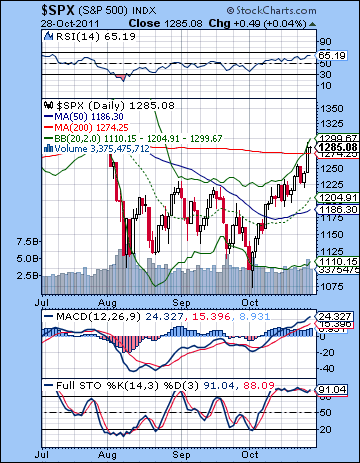 What a difference $1.4 Trillion can make. Investors cheered Thursday’s EU debt agreement as the October rally went into overdrive. The Dow climbed 4% on the week closing at 12,230 while the S&P500 finished at a lofty 1285. Well, I expected some larger than normal moves here and that is what we got. I noted some aspects on both sides of the ledger and thought we could go in either direction. In the end, the Jupiter-Pluto aspect had the final word as we pushed higher into the exact 120 degree aspect on Friday. Actually, the week was progressing more or less according to plan into Wednesday. Monday was higher as expected on the Sun-Uranus aspect as we took that run to 1250. Tuesday was bearish as expected on the Moon-Saturn as we tested support at 1230. That was the previous resistance level. Wednesday was harder to call due to the real mix of influences. As it turned out, we bottomed on support at 1220ish and then rallied back at the close. This set up Thursday’s moonshot. This arrived just one day before the exact aspect and was more or less in line with the Sun-Jupiter-Pluto alignment.
What is interesting here is how this entire October rally has more or less reflected the growing strength of the Jupiter-Pluto aspect. While I noted its bullish potential, I did not fully embrace its ability to overpower the various short term aspects. With the aspect now out of the way — and with it, all the Euro-drama around this never-ending debt deal — we may well wonder where the market may be heading from here. From a purely astrological perspective, there should be less bullish energy now as Jupiter will likely recede into the background a bit over the next few weeks. Saturn is likely to exert more of its bearish influence in November as it prepares to enter the sign of Libra on November 14. This is a potentially significant bearish influence that could coincide with a significant pullback. This is perhaps not too surprising anyway given the massive October rally. A pullback and some profit taking is to be expected. And yet there is a nice confirmation of this scenario as Jupiter is weakening while Saturn in strengthening. But the rally has been so strong — much stronger than I thought — that some previously bearish analysts are now throwing in the towel. Since the rally broke decisively above the range of 1120-1230, it seems the whole bearish view is in jeopardy. While I acknowledge a greater uncertainty about the ultimate levels of the forthcoming down moves, I have not changed my basic opinion of where the market is heading and when those moves are most likely to occur. November’s pullback should be fairly modest and be followed by a brief rally into December. Then a larger correction is more likely in December and into January. Previously, I thought that we could get to 1000 by January or even 900 in my more bearish moments. This is still possible, but since we’re knocking on the door of 1300 now, it may be a stretch.
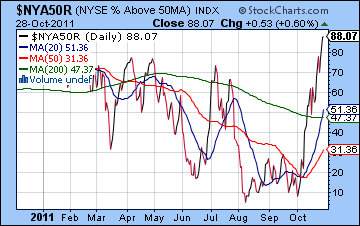 The bulls ran up the score last week as the previous resistance level of 1230 acted as support and a spring board for the rally into the stratosphere and 1285. The old neckline of 1250 from the head and shoulders pattern and the 200 DMA was also broken as the bulls ran the table in the euphoria around the latest EU bailout. The market is overbought now by many measures. The number of stocks above their 50 DMA has reached very high levels last seen in 2010 (see chart $NYA50R) . On the SPX, daily RSI stands at 65 and still approaching the overbought 70 line so it may have further upside. How much further could this rise? The next obvious resistance level is 1307 which is the 78.6% Fibonacci level and after that is the falling trend line at 1335 from the May high. While 1307 seems possible in the current environment, the 1335 level may require a significant pullback first. Support may be around 1240-1250 which corresponds to the old neckline, and then below that 1220-1230 would loom large in the event of a pullback. If the pullback is larger, then the 50 DMA at 1183 could act as support. This is fairly close to that narrow sideways channel from last week and its support at 1190. But the short term trend is up as the 20 and 50 DMA are rising and prices are above both. MACD is still in a bullish crossover and Stochastics are overbought but showing no signs of turning lower just yet. Overall, the daily chart looks quite bullish albeit one that is ripe for a pullback of some size. But then that is the question: how big? There is an argument that the size and speed of this rally effectively negates the bearish medium term view. According to this view, any pullback would be healthy for the market and would simply set the stage for the next leg higher.
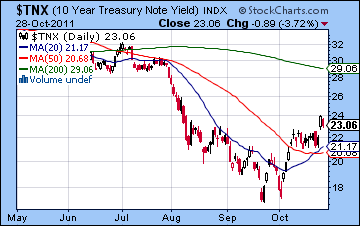
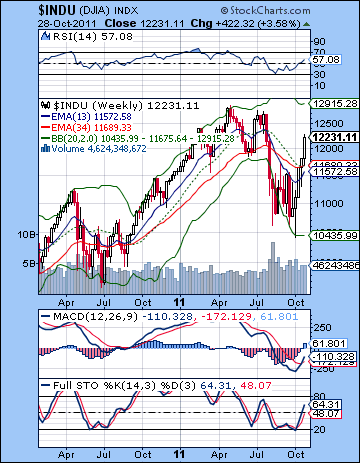 This is possible but I would first like to see more convincing evidence on the weekly charts. The Dow weekly chart shows how ambiguous the current situation is. There are bullish crossovers in the MACD and the Stochastics. Those are very important indicators of a significant rally that could easily last several more weeks if not months. And yet we do not yet have crossovers in the 13/34 EMA nor the 20/50 EMA. To be sure, these are lagging indicators in any event so they may not reflect the strength of this move immediately. But no indicator is flawless. A better test of the rally is to see its staying power. The longer prices can stay above the 200 DMA and then above support at 1230, then the more strength the rally will have. The 200 DMA at 1275 is still important although it acts more as a measuring stick than a level of hard resistance. If we do get a pullback in November as I expect, then it will be interesting to see how the next rally attempt in late November or early December handles that line. If it can’t vault over it a second time, then it would signal that the rally was a flash in the pan. A lower high would also achieve the same result. All this freshly printed Euro-money has equity investors salivating and with good reason. This is a quasi-QE3 scheme that postpones the de-leveraging doomsday a while longer. But the bond market seems less enthused about it so far. Friday saw yields in US treasuries on the way lower again. This is an early divergence with stocks that deserves close monitoring in the days ahead. I would bet on the bond market here as yields are likely to continue to fall. This will eventually correlate with lower stock prices.
This week will offer the first test of the post-Jupiter-Pluto reality. With the aspect now separating, bullishness should be in shorter supply. I don’t think it will disappear completely, although that is always possible. I would therefore not rule out a sharp move lower. That said, my best guess this week is less extreme. We could see some weakness in the early week as Mars enters Leo on Monday. There is an absence of any close aspects here so the downside could be fairly modest, perhaps only back to 1270. Tuesday is harder to call, although it may be a reversal day from bearish to bullish. The midweek actually could be quite bullish as Mercury forms a conjunction with Venus. Bernanke releases the latest Fed statement on Wednesday so it is quite possible this could have a positive effect into the close. This Mercury-Venus conjunction has the added bonus of forming a close aspect with Uranus into Thursday. For this reason, I think we could easily get two up days this week. In fact, higher highs are possible here so perhaps 1307 is in the cards as long as the early week sell-off is not too strong. The end of the week looks more bearish as Mars approaches its opposition with Neptune. This decline could begin as early as Thursday afternoon. This may be a fairly significant decline although it is hard to know if it will match the preceding gain from the Mercury-Venus conjunction. Combined with the early week decline, we could end up roughly where we started here. That said, the medium term influences are starting to turn negative so a somewhat bearish outcome should be somewhat more likely.
 Next week (Nov 7-11) the market is likely to fall further as the November correction arrives in earnest. The week begins with the bearish Mars-Neptune opposition. Tuesday features a minor aspect between Mercury, Venus and Saturn which also looks bearish. Wednesday’s Moon-Jupiter conjunction could boost some buying but Thursday’s Full Moon is often a bearish influence. The following week (Nov 14-18) begins with a triple conjunction of Mercury-Venus-Rahu that may be very bearish. As it happens, on the same day, Saturn enters sidereal Libra. This could represents a major sell-off and a possible reversal also. Once Mercury and Venus move past Rahu, sentiment may improve. And on Wednesday Mars is in aspect with Jupiter. This is often bullish. Just how far we go in this pullback is hard to say, although I think there is a good chance we will test major support at 1220, with a reasonable chance that we could test 1190. It could go lower than that, but I would want to see what happens this week as a test of the effects of this post-Jupiter phase on the market. So I am expecting a fairly modest pullback here which will be followed by another rally attempt that lasts to the end of November at least. The more bearish scenario would see 1190 or lower by mid-November and then a rally to lower highs into early December, perhaps to 1220-1250. A more bullish scenario would be a smaller pullback in November to 1220-1230 and then a higher high to perhaps 1330 by early December. Right now I favour the more bearish scenario although I will be watching for clues along the way. The market could begin to decline again as soon as December 1st. December and January definitely have some potential to do significant damage. It’s not all bad aspects here, however, so there is an important element of uncertainty that should not be ignored. Jupiter will be in aspect with Uranus and Neptune during most of this time, and those are quite bullish influences. The difference is that Saturn will also be moving into aspect with these bullish planets. This introduces a certain ambiguity in the outcome, although I think a bearish result is still the most likely.
5-day outlook — neutral SPX 1260-1290
30-day outlook — bearish-neutral SPX 1220-1270
90-day outlook — bearish SPX 1000-1100
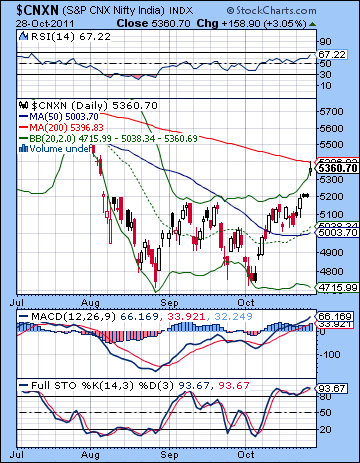 Stock market bulls rallied back with a vengeance last week feasting on the stand pat RBI announcement and the EU bailout agreement. In the holiday-shortened week, the Sensex gained 6% closing at 17,804 while the Nifty finished at 5360. While I had been somewhat ambiguous about last week’s direction, the extent of the rise was surprising as several important resistance levels were taken out. Monday was higher as expected as the Sun-Uranus aspect encouraged the risk trade. I thought we would see more downside on Tuesday’s Mars influence but the Indian market bucked the global trend that day as the RBI decision was decisive. Friday’s rally coincided closely with the Sun-Jupiter-Pluto alignment as the bullishness of Jupiter overshadowed all other factors. Given that ongoing Jupiter-Pluto aspect has driven much of October’s rebound, this overall bullish result was not hugely unexpected. Interestingly, the biggest gain occurred on the best day astrologically: Jupiter formed its exact 120 degree angle with Pluto just as the Sun moved into a complementary position 60 degrees from Jupiter.
So Jupiter and Pluto delivered the goods last week as the comprehensive EU debt bailout came to pass. It was a perfect example of how the symbolism of these planets combined. Jupiter’s optimism, wisdom and prosperity was applied to large governmental organizations through the exercise of Plutonic political power. The Thursday announcement occurred just one day and ten arc minutes away from their exact aspect. But how long will the confidence in this deal last? Some economists are already saying it is only a temporary solution that does not fix the real problem. The agreement is long on ideas and short on specifics. It may only be the latest example of how governments can kick the can down the road a little further. I would tend to agree. Last week I suggested that this clustering of aspects might mark a turning point in the market. I still think that is very possible now that Jupiter is moving away from Pluto. This will generally reduce the amount of bullish energy and so the rally may find it much more difficult from here on in. With Jupiter making its next major aspect in late November, there could be a depletion of optimism in the near term that puts the bulls back on their heels. At the same time, Saturn is due to become more powerful as it enters Libra on 14 November. To be sure, it does not form a major aspect in November and therefore we should not expect a huge correction in the short term. Nonetheless, bearishness is more likely to prevail in periods when Saturn is changing zodiac signs. This is one reason why the rebound rally is likely to be interrupted here, if not fail outright.
 As noted above, the bulls made some significant victories last week as they climbed above the 5200 level and jumped over the gap at 5300. Amazingly, they did not fill the gap since Friday’s gap up again passed over 5200-5300. One would think this gap is likely to back fill in the near term barring some unforeseen explosive rally that takes it higher. Friday’s rally stopped at two important sources of resistance: the 200 DMA and the falling trend line from the November high. These are going to be very difficult to break. I would expect many short positions will be waiting in the 5350-5400 area. By the same token, a strong rally could end up running all those stops and creating another short covering rally that takes the Nifty to its next level of resistance at 5600. I don’t think that is likely here, however. The technicals are showing the market as quite overbought as the RSI stands at 67. It could go higher of course but a consolidation is somewhat more likely in the near term. MACD is still in a bullish crossover while Stochastics is still strong and overbought. Support is likely at the 5200 level if and when we get that gap fill. Below that, it is likely near 5000 and the 50 DMA.
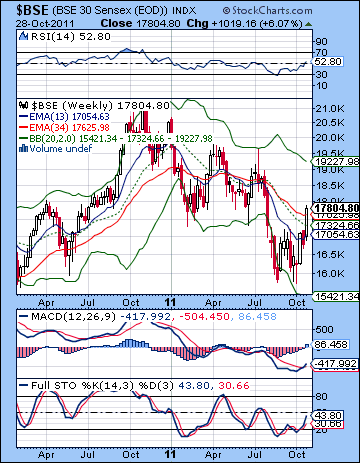
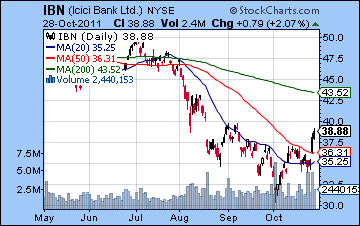
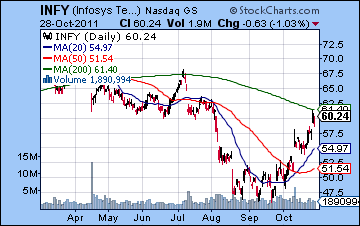
While the technical picture has improved, it is not quite enough to make this anything but a bear market rally. The 50 DMA is still below the 200 DMA. Price has yet to climb above the falling trend line from the peaks, let alone even challenge any of those previous peaks above 6000. A series of two or three consecutive closes above 5400 would definitely improve the stability of the rally. Another key is the condition of the weekly chart. The weekly BSE chart reflects improving technicals. MACD is in a bullish crossover now. While this is important, we don’t want to over emphasize the importance of a single indicator. We have seen previous MACD bullish crossovers fail in the past (e.g. April and July). Stochastics is still in a bullish crossover, although that is useful only for shorter term trends. The 13 week EMA is still below the 34 EMA suggesting that we need a longer period of consolidation before the market can attempt any significant recovery and start a new bull market. ICICI Bank enjoyed a significant rise last week as it climbed above the 50 DMA and reached recent highs. This stock could well go higher to tag the 200 DMA, although I would expect significant resistance at current levels. Infosys (INFY) has already tagged the 200 DMA after a significant rally off the September low. The upside is not obvious here as it has also reached resistance from the falling trendline. A close above the trend line would be bullish, however, and would increase the likelihood of another move higher.
 This week has a mixture of short term influences. The early week tilts bearish as Mars enters sidereal Leo on Monday. This is likely to increase urgency and may correspond with some selling pressure on Monday and perhaps Tuesday. Since we are now on the back end of the Jupiter-Pluto aspect, there is a possibility for a significant decline if these influences combine. If we only get a small pullback on Monday, then that is a clue that Jupiter’s bullishness is lingering and we could move higher on the week. In any event, sentiment may improve by Wednesday as Mercury approaches its conjunction with Venus. By Thursday, this conjunction moves into aspect with Uranus so that also increases the likelihood for another positive day, or least a positive open. There is a risk of a reversal lower as we get close to the end of the week due to the Mars opposition with Neptune. My best guess is that this will may only make Friday bearish, although it could manifest as early as Thursday. So there is a real mix of aspects in play here, although since Jupiter is separating from Pluto, I would lean bearish. That said, we should fully expect some significant upside here, probably in the middle of the week. One possible scenario would be down to 5200 and the gap fill by Tuesday and then back up to 5350 by Thursday with another down day on Friday. This could therefore create a negative overall week, perhaps finishing somewhere between 5200-5300. Some of these moves are likely to be fairly sizable in both directions.
 Next week (Nov 7-11) looks like it will begin bearish as Mars still opposes Neptune on Monday while the Sun forms a minor aspect with Rahu. Tuesday and Wednesday also look more negative as Mercury and Venus are in alignment with Saturn. Wednesday’s Moon-Jupiter could be a saving grace although I am unsure if it will be enough to reverse the direction. The end of the week could bring more optimism. The following week (Nov 14-18) is likely to be very bearish at the beginning of the week. Saturn enters Libra on Tuesday just as Mercury and Venus conjoin Rahu. This is likely to produce significant declines in the first half of the week. The second half of the week looks better so it is possible we could see an interim low formed here. It seems likely it will be low enough to test support at the 50 DMA at 5000. Whether or not it will be any lower than that will depend on what kind of post-Jupiter situation we have. At the moment, I am not expecting a large decline to occur in November. There is a good chance that the market will rally into the Venus-Pluto conjunction on 1 December. I don’t think this will be a major rally but it is likely to test resistance perhaps again at the falling trend line. December and January look more bearish with the most significant declines occurring at that time. Mid-December looks especially bearish as Saturn opposes Jupiter. I think we have a good chance of making new lows for the year in December with 4500 very much on the cards. 4000 would be a somewhat more bearish outcome of these aspects. A significant relief rally is likely starting in January or perhaps February at the latest. This force of this rally suggests that the first half of 2012 could be generally bullish. The second half of 2012 looks much less favourable with a possible new low occurring in early 2013.
5-day outlook — bearish-neutral NIFTY 5200-5350
30-day outlook — bearish NIFTY 5000-5200
90-day outlook — bearish NIFTY 4000-4500
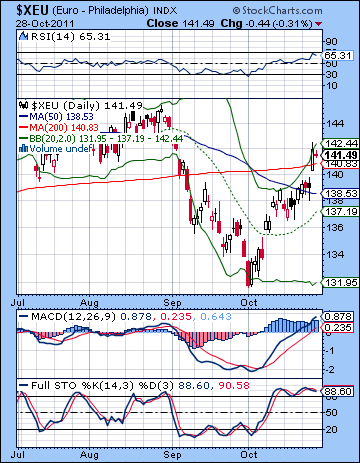 The Euro did the impossible last week as it climbed back over 1.40 in the wake of the EU debt agreement. I thought we could well see a serious retest of 1.40 resistance on the Jupiter-Pluto aspect although I could not quite bring myself to speak openly about such an incredible outcome. As expected, the early week was choppier as Tuesday’s retreat was quite modest but still well below the all-important 1.40 level. So is the Euro fixed? Can we all rest easy? It’s certainly possible this deal is enough to mollify some investors but a number of voices of skepticism have already been heard elaborating the shortcomings of the deal. Perhaps the most important voice is the bond market itself which saw a boost in Italian bond yields on Friday back over 6%. Not exactly a vote of confidence less than 24 hours after moving heaven and earth to come up with a massive number designed to quell all criticism. Worse still, the TED spread is still on the rise and was not pacified at all by the Trillion Euro deal. For the short term, however, the Euro got a dose of technical breathing room. As long as it can stay above 1.40, then all will be right with the world. A dip back below 1.40 would lead to another round of hand-wringing, however. I tend to think this will be a one-week wonder fake out above resistance, although we will see. They may try to close the gap at 1.39 first before moving on to 1.34 once again.
We could see a retest of support at 1.40 as soon as Monday as Mars enters Leo. This does not make a close aspect to any point in the Euro chart so I will not be overly disappointed if the decline is modest or indeed if we end up higher. Nonetheless, there does seem to be some downward pressure in the early going. The risk trade may return by midweek, however, as the Mercury-Venus-Uranus alignment should boost the Euro again. I’m unclear if it makes a new high here — it is certainly possible. Friday looks less positive as Mars lines up opposite Neptune. Mars is transiting the 12th house of loss in the Euro horoscope so that adds to my confidence somewhat that the Euro will fall fairly soon. Nonetheless, this week I would not be surprised to see it actually rise at least on the midweek aspects. Next week looks less promising, however, so we could see 1.40 tested for real. Monday to Wednesday look bearish overall so that could be a make or break situation. By about November 16 and Saturn’s entry into Libra, we should see the Euro trading back in its previous range of 1.34 to 1.38. While I am expecting some significant downside here, I’m not fully expecting a huge decline. This is certainly possible with Saturn but it does not seem probable. A feeble rally attempt is possible in the second half of November and into early December but I don’t think this will get too far. It is possible it may only climb back up to 1.39. That also seems too bearish a target but we shall see. A larger decline looks more likely to occur in December and into January as Jupiter opposes Saturn. I should note that there is a chance that this combination could produce an extended rally. There is a certain polarizing quality to the aspect, especially when combined with Uranus and Neptune as it is here. However, Saturn looks stronger than Jupiter here owing to its slower speed and its exalted status in Libra. I would therefore expect lower lows on the Euro as the more probable outcome.
Euro
5-day outlook — neutral
30-day outlook — bearish
90-day outlook — bearish
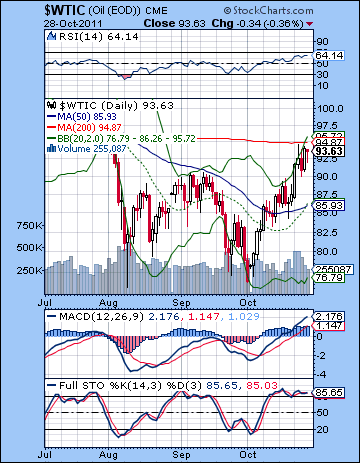 Crude rode the EU bailout train all the way above resistance as it closed above $93. I thought the density of aspects would tend to produce some larger than expected price moves, although I was somewhat uncertain about the direction. I was correct in calling Monday’s gain on the Sun-Uranus aspect, although unfortunately was not emphatic enough about it. The Jupiter-Pluto aspect definitely played a key role in pushing prices beyond resistance as this aspect became exact on Friday. Monday’s break above resistance at $90 was important for the bullish view of crude. We also got a test of $90 as support later in the week. This would suggest that the short term trend is higher. MACD is in a bullish crossover and Stochastics are overbought but still looking strong. RSI is getting close to being overbought at 64 but could still conceivably push higher. But price is pushing up against a rising upper Bollinger band. Now crude has to contend with the 200 DMA at $94 as the next level of resistance. After that, it is the proverbial line in the sand at $100 — the line that divides crude as inflation hedge from crude as a commodity in a stagnating or deflating economy. There is quite a lot of overhead supply at $100 so I would be fairly skeptical it could stay above that level. Nonetheless, a short term run up to $100 is possible. Support is likely found around the 20 and 50 DMA at $85. Any pullback would likely stop first at that level. Below that, $80 would likely bring in buyers.
This week looks more mixed. Some early week selling is quite possible as Mars enters Leo. Based on the short term aspects, I do not think this will be strong enough to seriously test support at $90. The midweek looks more bullish as the Mercury-Venus-Uranus alignment on Wednesday and perhaps Thursday should boost prices. This suggests that at minimum crude could return to current levels. It may also move higher and challenge the 200 DMA. I would not rule out a run to $100. Weakness is likely to return by Thursday afternoon and Friday, however, as the Moon opposes Mars. This may only result in a modest pullback, however. Next week looks more bearish as Mars opposes Neptune more closely on Monday and Mercury and Venus are in aspect with Saturn on Tuesday and Wednesday. We could therefore see a more sustained pullback occur here with a conservative target of $85. I would not be surprised if it hits $80 although that seems less certain. Crude looks like it will be strongly affected by the Jupiter-Saturn opposition in December and January. It is possible that we could see some sideways movement in December. This would suggest that the decline would be pushed back to January and February. On the whole, however, I think that half of December and most of January will be bearish and this should be enough to take prices significantly lower. $70 seems quite likely, with a reasonable chance of $60.
5-day outlook — neutral
30-day outlook — bearish
90-day outlook — bearish
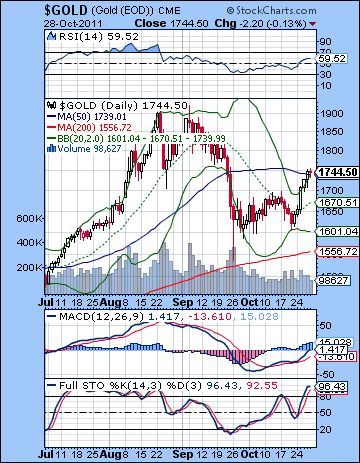 Gold surged more than 6% as investors sought an inflation hedge against the European bailout money print-a-thon. Gold closed the week at $1744. This outcome was somewhat unexpected as I thought we would see more intraweek downside. That said, I recognized the possibility that we could move higher on the strength of the positive aspects involving Monday’s Sun-Uranus aspect and the Sun-Jupiter aspect near the end of the week. Friday’s gain ended the rally right near some obvious resistance at the 50 DMA. The $1750 also marks the approximate 50% retracement from the recent low in September. With gold pushing up against the upper Bollinger band, there is no obvious resistance level above $1750. That could either mean that it will reverse lower at its current level, or it will jump higher to the $1800 level. MACD is in a bullish crossover as it has just crossed over the zero line. Stochastics is also in a bullish crossover and is overbought. RSI is less overbought at 59 and remains below the September peak. Gold is still in a bull market as the 50 DMA remains above the 200 DMA while the 200 DMA is still rising. This is no doubt encouraging gold bulls to buy in anticipation of the next move higher. The September 26 piercing low tested the 200 DMA so it can be a better position to move higher. If gold cannot manage to close above the 50 DMA it would be a technical setback that would extend this period of consolidation. If it goes on long enough, it could eventually create a bearish cross of the 50 and 200 DMA. This would effectively spell the end of the bull market in gold. But that is still a big "if".
This week could see the battle for the 50 DMA intensify. There is some bullish potential this week around the Mercury-Venus-Uranus alignment that should hit on Wednesday and perhaps into Thursday. This is quite a bullish combination so it should create some gains. But before then, Monday’s entry of Mars into Leo is more likely to be bearish. Similarly, Friday’s Moon-Mars opposition may not be kind to gold. On the basis of the short term aspects alone, I might lean bullish here. The medium term aspects are more bearish now that Jupiter is moving away from Pluto. We could see the demand for risk assets like gold suddenly decline. The technical picture looks less positive as resistance may prove to be difficult to surmount. So it is possible that we could end up fairly close to where we ended Friday or somewhat below. It’s hard to say. I would not be surprised by a breakout to $1800 nor a decline back to $1720. Next week there is a greater chance of a decline as Mercury and Venus form an alignment with Saturn. This retracement lower is likely to continue into the middle of November and the entry of Saturn into Libra on November 14. I am not expecting any huge pullback here, as we may go back to the trading range of October. Some rally is possible going into early December but again this does not look very strong — perhaps somewhere between $1700-1800. I expect more downside in December and into January. This should be more substantial and should at least involve a retest of the 200 DMA at $1550.
5-day outlook — neutral
30-day outlook — bearish
90-day outlook — bearish

