

Summary for week of November 28 – December 2
Summary for week of November 28 – December 2
- Stocks could bounce early but more vulnerable to declines late in week
- Euro may rebound but weakness will likely return
- Crude more prone to declines as week progresses
- Gold looks bearish, especially on late week Mars-Sun aspect
Things are quickly going from bad to worse. Markets pushed lower last week as Germany’s failed bond auction suggested the Eurozone contagion had spread to the very core of Fortress Europe. After falling for their seventh day in the row and their worst Thanksgiving week since 1932(!), the Dow was down 4% on the week closing at 11,231 while the S&P 500 finished at 1158. While the decline fit with my overall scenario of an eventual retest of the October low of 1074, the extent of this ongoing corrective move was surprising. While I expected some downside in the early week on Monday’s Venus-Saturn aspect, I missed the relentless quality of this sell-a-thon. It was humbling to say the least. I missed the extent of the decline because the short term aspects did not deliver the upside energy I thought they would. The late week Venus-Neptune aspect, for example, manifested mostly on Thursday in Europe and Asia when US markets were closed. Friday seemed to offer some chance for gains as Europe did finish higher, but once again the bears returned by the close and the markets ended negative. Certainly, I knew that the medium term Saturn-Jupiter aspect would be an increasing drag on sentiment as we move into December but I did not think it would be this powerful.
I am now more concerned that we could see a major financial meltdown over the next few weeks. The question now is whether Europe can get its act together. So far, all parties seem to be at an impasse. Investors are reluctant to buy even the once-reliable German bonds now until the crisis is resolved. The problem is that the markets want the ECB to intervene and buy bonds en masse in QE-type amounts or backstop all the weak countries bonds with its own eurobonds. On the one hand, this would remove the risk of default but it would push up the rates of Germany as it surrendered to the collective logic of the EU. Germany does not want to see its credit rating downgraded and its interest payments rise but it also does not want a full-blown crisis either. It’s a classic conundrum of weighing the benefits of self-interest against the collective consequences. If there is a reluctance to solve this problem by printing money and a massive bond buyback, we can still blame austerity-loving Saturn. With Saturn approaching its aspect with Jupiter in January, it seems unlikely that the ECB and Germany will accept the more inflationary solution that the market is looking for. Saturn prefers problem solving through cuts so it may be a while before investors get their wish of ECB-backed eurobonds. That is my best guess for now from reading the planets. Since the markets will probably not get what they want, it seems more likely that we will track lower in the coming weeks. Just how low we go and how we get there is a bit murky I must admit. But at least we can now visualize a plausible chain of financial and political circumstances that could produce SPX 1000 (or lower?). Muddling through is less of an option now for Merkel and ECB Chair Draghi, although they may attempt a compromise of buying back some proportion of the unwanted Eurozone bonds.
 The technicals got predictably worse last week as the key 1200 support level was broken on Monday. This appeared to open the floodgates as sellers prevailed for the rest of the week. After the clear sell signals we noted over the past couple of weeks, such a rush to the exits was perhaps not that surprising. Interestingly, the market arrested its decline right at the 61.8% Fib level at 1158. I thought we might have stopped at the 50% (1183) level with the early week bearishness but the surprising failure of the German bond auction kept the bears in command. Support at 1200 and the 50 DMA crumbled quite easily so that may be a sign that any rebound rally attempt may be weak. Of course, if the ECB does decide it is going to ‘go nuclear’ and issue its own bonds, then all bets are off. But the technical picture suggests that 1200 and the 50 DMA at 1206 may act as resistance in the event of any rally this week. If the current Fib level of support does not hold, the next support is likely around 1120. Below that, is the ‘forbidden zone’ and the October low of 1074. I’m not sure to what extent it could act as support since it was only a very brief piercing low. I would tend to think that if 1120 fails, then it may fall off a cliff and head for lower lows. But we’re likely still some distance away from that kind of doomsday scenario. Many observers are expecting a bounce because the market is so oversold. That’s quite likely from an hourly chart basis, but on a daily basis, we still have more downside before becoming oversold. RSI is still at 36 and could stand move downside before becoming oversold. Stochastics (2) of course is grossly oversold but in a bear market filled with bad news and uncertainty, it is perhaps not too surprising. MACD crossed below the zero line and is heading south quickly.
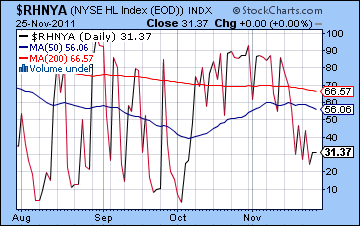
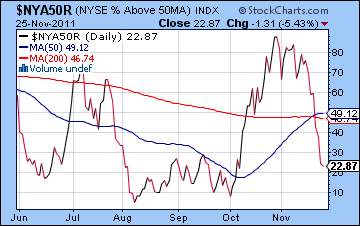
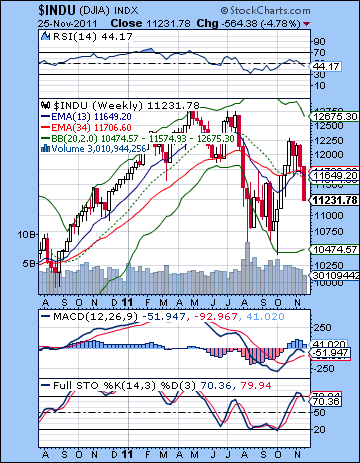 While we could get a small rebound to clear the oversold status of the hourly chart, the market will likely head lower, at least until we get a volume surge on the downside. That would suggest some kind of capitulation that would set up a more enduring reversal. We got volume surges on both the Aug 9 and Oct 4 lows so it is not unreasonable to look for a similar volume increase this time around. The weekly Dow chart got a nasty-looking big red candle last week and looks poised to head lower. MACD is rolling over and once it forms its own bearish crossover, we will have bearish crossovers on all three of the daily, weekly and monthly charts. This would add weight to the notion that we will move substantially lower in the weeks and months ahead. More negatively, the Stochastics formed a bearish crossover and is now below the 80 line. This is a very bearish indicator. The RSI at 44 has lots of room to go before becoming oversold. So there is good technical evidence for a lower low, perhaps testing the lower Bollinger band at 10,500. After 7 down days in a row, the more pressing question is what kind of bounce can be expect. Breadth indicators are looking somewhat oversold. The High-Low index ($RHNYA) is getting closer to previous lows but arguably has a ways to go before strongly suggesting a reversal. The number of stocks above their 50-day MA is similarly moving closer to the 20 level which can sometimes provoke a bounce.
This week does not seem to offer that much planetary solace to the bulls. The clear short term focus this week is the approaching Mars influence on Sun, Rahu and retrograde Mercury. Just a single Mars aspect to one of these planets is bearish, but this week and next week we have three. Not good. The Mars-to-Sun aspect will hit first on Thursday and Friday. So if we do get a bounce, it seems more likely to occur in the first half of the week before this aspect can become exact. But what are the chances for a bounce? Hard to say. I think they are probable, but not highly probable. Also I would not expect too much upside from what I am seeing. The two main bullish aspects are a minor Mercury-Jupiter aspect on Tuesday (Nov 29) and the Venus-Pluto conjunction on Wednesday (Nov 30). Investors will be closely monitoring the Italian bond auction on Monday and Tuesday as well as the Spanish auction slated for Thursday. If any of these auctions goes poorly, then stocks will likely sell-off again. The planets would tend to suggest that the early week may be somewhat better than expected. I should point out that neither of these apparently bullish aspects are hugely reliable or positive. Yes, they could produce a quick run to 1200, but I would not be surprised if we topped out at lower levels such as 1180. A gap up on Thursday could well end up reversing midday as the Moon begins in aspect with Jupiter but will be long gone by the close. On paper, Thursday and Friday look negative enough to more than erase any previous gains we make this week. So if we happen to go all the way up to 1200, then I would still expect Friday’s close to be nearer to 1140-1160 at least. In that sense, it is conceivable that we could actually end positive this week. That said, the overall market direction is down so I would rather err on the side of the bears here. There is a decent chance that we could have a really big down day on either Thursday and especially Friday.
 Next week (December 5 – 9) looks like it will start bearish as Mars approaches its aspect to Rahu while in a tight 45 degree aspect with Saturn. So we could see any late week selling carry over into Monday’s session. Tuesday could also be down as the Sun conjoins Rahu (uncertainty in governments) while the Moon aligns with Jupiter. Usually, this Moon-Jupiter conjunction would be a source of bullishness but now I wonder if it will pan out that way as the opposition with Saturn takes root. Gains may be somewhat more likely in the late week on the Sun-Venus aspect. But overall this week looks bearish. The following week (December 12-16) will likely begin negatively on the exact Mars-Rahu aspect. I don’t see any clearly bullish aspects here although the Sun and Venus do change signs together on Friday so that could promote some buying. It seems quite likely we will test support at 1100-1120 by mid-December but we could be lower than that. As I have noted, I am somewhat unclear what happens next. I think the market is likely to undergo an extended corrective phase until as late as January, perhaps until the Mars retrograde on January 23. But there is a good chance for a major rebound somewhere, perhaps starting Dec 20 when Sun-Venus-Jupiter-Uranus align. I am unsure how long it will last — perhaps only a couple of weeks. It seems unlikely to be strong enough to reverse the medium term downward trend. But a lot will depend on the technical evidence. If we can make new lows by Dec 20, then it may simply be another bear market rally that is lower than the previous high. The bottom line is that the planets suggest that we are more likely to take out the October low by January. How low we may go is harder to say, although 950-1050 seems like a reasonable target. 2012 is shaping up quite bearishly at this point. I think we could end up testing the Satanic March low of 666 by early 2013.
5-day outlook — bearish SPX 1120-1160
30-day outlook — bearish SPX 1000-1100
90-day outlook — bearish-neutral SPX 1050-1150
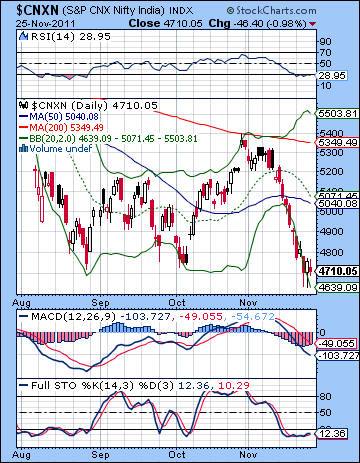 Stocks sank for the fourth week in a row as the seemingly unresolvable Eurozone debt crisis generated significant FII outflows. The market tested major support as the Sensex fell 4% closing at 15,695 while the Nifty finished the week at 4710. While my medium term stance was bearish, I did not foresee the extent of this decline since I thought the 4800 level would not yet be broken. To be sure, I thought there was a good chance that the first half of the week would be negative as Saturn was aspecting Venus. Monday’s decline was therefore entirely within our expected range. I thought we could see more turbulence around the Tuesday-Wednesday aspect of Mars and Pluto. As it happened, Tuesday was higher and Wednesday was significantly lower. Thursday’s expected gain arrived on schedule as Venus was in aspect with Neptune. Friday’s down day coincided with the solar eclipse. So my overall expectations for a more bullish latter half of the week were partially fulfilled, even if the recovery was marginal.
World markets are still fixated on the European debt crisis. The bad news last week was the disappointing German bond auction which was not only marked by rising yields but by an absence of buyers. The once rock-solid core of the EU has now been touched with the very contagion is has sought to solve over the past two years. With fewer investors willing to buy any sovereign European debt, the ECB and Germany will be forced to take more drastic measures in order to prevent a complete financial meltdown. The consensus now is that the ECB must issue either eurobonds or they must announce a massive QE-style buy back. Unfortunately, neither Germany nor the ECB wants to do this since it would weaken Germany’s credit rating and raise their own borrowing costs and it would not provide enough of an incentive for weaker EU members like Italy and Spain to reform. Any lesser solution will likely be rejected by the market and global stocks will likely continue to remain in a down trend. From an astrological perspective, we can see that the season of Saturn is still very much with us. I have noted how Saturn’s entry into Libra earlier in November would likely reflect lower prices and a growing skepticism about October’s EFSF bailout package. Moreover, Saturn’s opposition aspect with Jupiter in December and January will probably keep the focus on austerity and restraint rather than full-blown QE-type money printing. This is important because it suggests that the Germany and the ECB will probably not agree to the more market-friendly eurobond or the QE scenario in the near term. A modified eurobond or ECB backstop of some percentage of sovereign debt is possible, but it seems unlikely to shift the main focus away from the need to reduce government spending. If Europe refuses to spend its way out of this mess, then stocks are likely to remain weak for the foreseeable future, at least until Saturn relinquishes its hold on Jupiter in January.
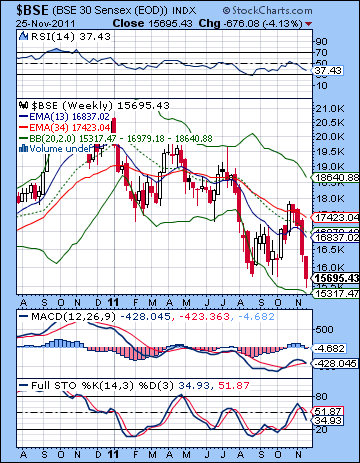 Bulls had a near-death experience late in the week as support at 4700 was tested on three straight days. The Nifty pierced 4700 twice on an intraday basis but came back up to this crucial horizontal support by the close. This recovery was significant because it showed that the bulls had enough strength to bid prices back up. A rebound from these levels would be bullish and the brief downside violation of 4700 would be seen as a fake out. Fortunately for the bulls, the market is oversold on a daily basis so that may make it easier to hold long positions. RSI is below the 30 line and is less likely to remain oversold for very long. Stochastics has been oversold for a while already. MACD is still in a bearish crossover, of course, but we should notice how the histogram bars have levelled off and are now shrinking suggesting the trend is more likely to reverse. If this support at 4700 breaks, the Nifty may fall to 4500 fairly quickly. Below that, 4000 would loom quite large as support. Resistance may be near the 50 DMA at 5040 and the 20 DMA at 5071. The 200 DMA at 5349 remains as a crucial line in the sand for this bear market. October’s rally turned heel right at that level. Any future rallies will have to contend with this significant resistance as many bulls will no doubt be tempted to liquidate their long positions as the Nifty approached this line.
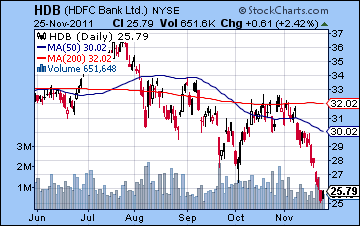
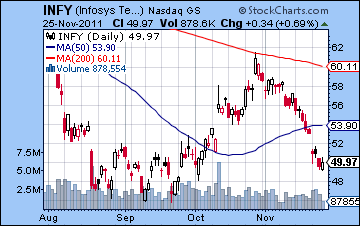
But right now we are far away from that scenario. The weekly BSE chart looks somewhat weaker here as we got a bearish crossover in the MACD. While this does not necessarily indicate more immediate downside, it is an added burden for longs to consider for the intermediate term. That said, we can nonetheless point out a bullish divergence here with respect to the previous low. But the bear case seems to have more going for it since the weekly chart is not yet oversold. This would allow for more intermediate downside (e.g. 1-3 months) in the event that Europe continues to disappoint global markets. RSI (37) has further to fall before becoming oversold as does stochastics (34). Again, we can detect a bullish divergence here with respect to the previous low so that somewhat mitigates the purely bearish interpretation. In other words, it is still very much a mixed bag in technical terms. And yet the medium trend is still down as the 13-week EMA remains below the 34-week EMA. Although a lagging indicator, it remains a good barometer of fundamental market direction. The stress on the banking sector continues as we got new lows in HDFC Bank (HDB). It’s now a long way up to the 50 DMA. Infosys (INFY) gapped down on Monday and hasn’t looked back. It’s inability to hold onto the 50 DMA suggests it may now head back down to its previous lows.
 This week appears more mixed, although the declines are more likely in the latter half of the week. Mars is main culprit here as it approaches its aspect with the Sun, Rahu and Mercury. The Mars-Sun aspect will be exact on Thursday and Friday while the other aspects exact will wait until next week. Some gains seem more likely before that time, however, so there is a decent chance of some kind of rebound rally. Monday is difficult to call as there are no close aspects in play. I would therefore not rule out a gain or a loss. Tuesday could well start the day in the green as the Moon is in aspect with Jupiter and Uranus. Wednesday is another tough call although I would not be surprised if the minor Mercury-Jupiter aspect pushed prices higher. Thursday may see things come apart again as Mercury approaches its conjunction with Rahu and Sun is within range of the Mars aspect. Both of these aspects are closer on Friday but it is possible they could manifest across both days. I am expecting a significant net decline across both days and there is a good chance that both days will be negative. Since the market is so close to technical support, it seems less likely that it will break early in the week. Given the mixed to mildly bullish planets I see, that is perhaps an argument for a rebound rally. 5000 seems like a stretch, so perhaps it will peak closer to 4900. The late week is likely to erase most if not all of any preceding gains, however. Given the bearish medium term planets (Saturn-Jupiter), I also would not rule out a breakdown of 4700 early in the week and then a retesting of resistance at 4800 by Wednesday followed by a stronger sell-off into Friday to 4500. While possible, I don’t think that bearish scenario is likely. But even if we get the more bullish scenario and the Nifty rises to 4900 by midweek, the late week planets are very bearish and I would not rule out a possible strong retest of 4700 by Friday. So it seems the upside here is quite limited with a reasonable chance of finishing fairly close to where we are now, or perhaps somewhat lower.
 Next week (Dec 5-9) begins with a bearish Sun-Rahu conjunction. This will likely limit any upside and could well signify more downside. Gains are more likely later in the week on the Sun-Venus aspect and this could even produce a positive week. The following week (Dec 12-16) will likely be quite negative to begin as the Mars-Rahu aspect is a fairly reliable indicator for declines. A rebound is more likely late in the week as the Sun and Venus enter new signs. It is hard to say for sure if these aspects will produce lower lows, although that is my general expectation. Then we will see an unusual multi-planet alignment in the week of Dec 19-24. This could mark a significant turning point in the market although I cannot say if it will represent fresh lows or a sudden rally. My expectation is that we will likely fall further, although I would not be surprised to see a rally attempt at the end of December. 4000 is very possible at some point over the next two months, although I am somewhat unsure when it is more likely. January does not clearly indicate bullishness and it may well bring more downside as we get closer to the Mars retrograde station on 23 January. Prospects for a stronger rally are better in February and March as Jupiter separates from Saturn. While the first half of 2012 may see some substantial upside, the second half looks quite bearish, with Q4 likely to bring major declines that could erase previous gains. A retest of the 2008 low is quite possible by early 2013. This suggests that long positions should only be taken with caution and only for the shorter term.
5-day outlook — bearish-neutral NIFTY 4600-4800
30-day outlook — bearish NIFTY 4200-4700
90-day outlook — bearish NIFTY 4200-4700
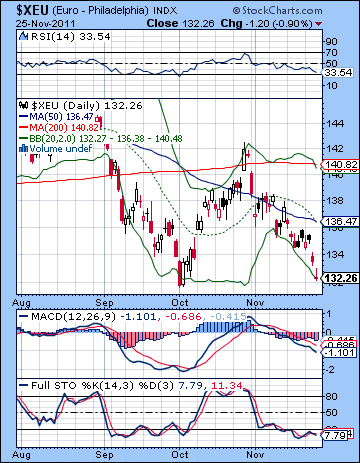 As the Eurozone glimpsed into the abyss after Germany’s failed bond auction, the Euro sank to retest recent lows closing below 1.33. The Dollar Index again approached the critical 80 level closing at 79.14 while the Rupee weakened further to 52.25. While I was correct in expecting some bearishness early in the week on the Venus-Saturn aspect, I did not at all expect the plunge that followed. As a result, we are a little ahead of schedule on the break of 1.30. I thought it would arrive by mid-December and now it seems it could come even sooner. This assumes that there is still enough negative planetary energy available for the next two weeks. I believe there is, although I am somewhat chastened by last week’s mistake. The chart looks pretty anemic as it is retesting its October low now. On the plus side, it is close to being oversold on the RSI so perhaps there may be some bounce here that could delay the inevitable. A double bottom would be bullish obviously, and could entice some longs, especially if Merkel and the ECB can pull a couple dozen rabbits out of their hats this week. MACD is still in a bearish crossover although it may be forming a positive divergence with respect to the previous low. Unless there is a total dereliction of EU duty next week, 1.32 will be defended by the Euro bulls. The bond auctions next week will be critical of course, especially Italy’s 5 Billion Euro auction on Tuesday and Spain’s 4 Billion slated for Thursday. The problem for the Euro is that there isn’t much wiggle room any more. Even if Italy’s auction might go off as hoped and yields don’t rise much beyond 7% (assume a significant ECB intervention here in any event), Spain’s must also be successful in the same way. Any sign of fast rising yields or a lack of buyers and you will have trouble all over again. The Euro is on a knife edge. If Merkel and Draghi do manage to cobble something together, a rally to 1.36 and the 20/50 DMA is possible in the near term. But failure to close above those levels would again put pressure to revisit 1.32 in a hurry.
This week may well see some kind of bounce in the early going. The planetary aspects aren’t that good actually, but there is at least an absence of bad aspects for a couple of days that could engender some buying. The Mercury-Jupiter aspect on Tuesday and Wednesday perhaps could lift sentiment briefly. Monday’s meeting between Obama and some key ECB officials may create some positive results that the market accepts for a while. But overshadowing everything here is the approach of Mars and its upcoming aspect with the Sun. This is closest on Thursday and Friday so those are the most likely days when the Euro could slip under water. Next week doesn’t look much better as the Sun conjoins Rahu on Tuesday. This is likely to bring more downside until a possible bounce later in the week. Things get murkier after that as we could bounce as we approach Christmas. It’s much less clear than it should be, however. Much of the interpretative problem comes from weighing the relative strength of the bearish Saturn-Jupiter aspect against the bullish Jupiter-Uranus aspect that will form at the same time. We could rally into early January or conceivably continue to trend lower. I don’t know. I think there are more reliably bullish planetary signals starting in February and March so it may be worthwhile sitting out any previous rally attempts.
Euro
5-day outlook — bearish-neutral
30-day outlook — bearish
90-day outlook — bearish-neutral
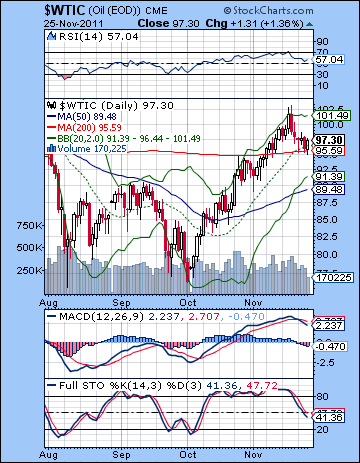 After its recent test of the $100 level, crude oil continued its return to earth last week as it edged lower closing near $97. The week did not exactly pan out as I expected, although I turned out to be correct in calling for more of a flat outcome. I thought there was some good chances for decline in the first half of the week. We did see some intraday action down to $95 prices largely recovered by the close. Wednesday was more negative, but that decline came a day later than expected. Friday’s rally was in keeping with our forecast as the Venus-Neptune aspect did push up prices in the brief holiday session. So no technical surprises here as support at $95 was re-affirmed. Bulls are fine as long as $95 and the 200 DMA hold firm. The trouble is the downward momentum looks established here as MACD is in a bearish crossover as is stochastics. Stochastics also has further to go before becoming oversold. So that suggests that any new downside would cause technical damage and could spark more selling. If the current pullback was a normal one in the context of a broader rally, then it should have retraced to the 20 DMA. But it’s already overshot the 20 DMA now, so it could slip down to the bottom Bollinger band. Support would be fairly strong there, especially since the 50 DMA is close-by. There is also substantial horizontal support from the September high. $90 should therefore hold quite well in the event of another move lower.
The planets this week suggest that a test of the $90 is more likely. The Mars aspect to the Sun is exact late in the week so that may be the most likely time for a significant decline. Gains are somewhat more likely ahead of that aspect, although the upside energy does not look that strong or that defined. Since crude is close to support here, we may well attempt another run to $100 by midweek. That is quite possible. At the same time, the overall picture does look increasing stressful on crude so rallies may be fairly weak. The decline this week has the potential to be significant so it seems likely that any preceding gains will be erased and then some. Perhaps crude will finish somewhere between $90 and $95. Next week (Dec 5-9) starts off bearishly as the Sun-Rahu conjunction on Tuesday is likely going to extend the sell-off into midweek. Some significant recovery is likely by Friday the 9th. As the slow moving Jupiter-Saturn aspect becomes closer over the coming weeks, there is a reasonable chance that crude will correct more significantly. Admittedly this is less clear than I would like, since there are some bullish planetary patterns in the mix also such as the Jupiter-Uranus aspect. This means there could be a significant rally at some point which could actually produce a more sideways result. I tend to think this bullish result is less likely, but it is still possible. If we do see an extended correction, then it should reverse by late January and the Mars retrograde station on January 23.
5-day outlook — bearish
30-day outlook — bearish
90-day outlook — bearish-neutral
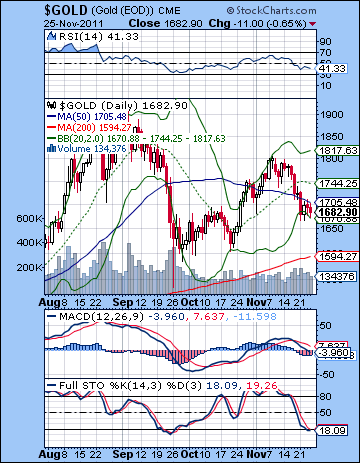 Gold suffered alongside most other assets last week losing 2% as investors reacted the possibility of a messy Eurozone default. Gold plunged Monday and then went mostly sideways the rest of the week closing near $1680. This bearish expectation was in keeping with our forecast as I thought the early week Venus-Saturn aspect could produce a significant down day. I thought we could see more of a late week rebound although Thursday’s holiday may be interfered with some of the otherwise positive planetary energy. Gold has come off of a possible interim top at $1800 recently and appears to be in the middle of a retracement. While Friday’s close found support at the bottom Bollinger band, bulls should be wary of the fact that it could not climb above the 50 DMA for three straight days. MACD is still in a bearish crossover and has crossed below the zero line. Stochastics are oversold, however, and may be attempting to rebound higher. RSI is still trending lower but does not offer evidence for either bulls or bears. So is this chart bullish or bearish? Gold is finding some horizontal support at $1680 but a close below this level would likely invite a retrace down to $1600 quite quickly. A move higher is possible but given the lower high that has been established, a rally would appear to be the path of greater resistance.
This week would appear to continue the downward pressure on gold. Typically, planetary afflictions to the Sun correlate with lower prices. This week the Sun comes under the double affliction of Mars and Rahu. The Mars aspect occurs first on Thursday and Friday while the Rahu influence is still building. Between these two negatives, there is good reason to expect gold to move lower, perhaps significantly so, this week. The late week is the most likely time for a decline, although it may occur sooner. But the first half of the week may see some gains, or at least there is a greater chance of that. I am not firmly convinced we will see much upside, however. Next week is likely to be bearish also since the Sun conjoins Rahu early in the week. We could easily see $1600 by next week. I am uncertain about the future direction of gold although I would tend to expect more downside as Saturn approaches its aspect with Jupiter. A more bearish scenario would see gold fall to $1550-1600 by mid-December and then bounce until early January. This would then lead to another leg lower until perhaps February. Gold could end up testing support at $1500 and perhaps going much lower. I’m still not convinced of this scenario, however, because the planetary clues are too mixed. That doesn’t necessarily mean the outcome will be mixed; it’s just that on this occasion, they are harder to interpret. A more bullish scenario would see gold move sideways between $1600 and $1800 until February’s more modest down move. Long-term, gold seems vulnerable to declines over the 12-18 months. A more reliable rally is more likely to begin in early 2013 and continue into 2014.
5-day outlook — bearish
30-day outlook — bearish
90-day outlook — bearish