Summary for week of December 19 – 23
Summary for week of December 19 – 23
- Stocks prone to early weakness but gains more likely by midweek; possibly range bound until New Year
- Euro weak early but strengthening by Wednesday; 1.20 is possible by January
- Crude recovery probable by Wednesday; correction to continue into January
- Gold to decline on Sun-Saturn Monday but rebound into midweek; correction to continue into 2012
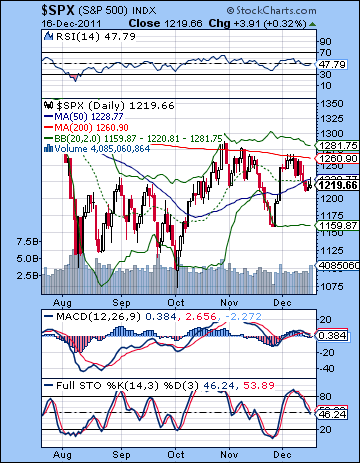 The market had a case of buyer’s regret last week as investors indulged in some sober second thoughts about the EU’s pact for fiscal union. Breaking support at 12K, the Dow declined more than 3% closing at 11,866 while the S&P 500 finished at 1219. This bearish outcome was very much in keeping with last week’s forecast as I thought the Mars-Rahu aspect would depress sentiment in the first half of the week. The losses arrived right on schedule as the market corrected lower on Monday, Tuesday, and Wednesday. Stocks then also bounced on cue as the mood lifted with the entry of Venus into Capricorn on Thursday and the Sun into Sagittarius on Friday. While I had been somewhat uncertain if we would get two up days here, I did think the chances were good for a net positive outcome across both days. The force of the down move was a little stronger than expected, however, although very much in keeping with my overall cautious approach given the rising influence of Saturn.
No surprises here really as the the Euro-mess seems destined to drag on indefinitely. As I have warned in previous newsletters, the current fiscal pact solution did not deliver the liquidity that many investors were seeking. With Saturn firmly in the picture here, no inflationary bond-buying panacea from the ECB was likely and Merkel and Draghi did not disappoint on this score. While the limiting of deficits and enforcing stricter austerity was welcomed by most market watchers, there is a growing awareness that austerity alone cannot spur the growth necessary to enhance profitability and get the economy moving again. So it’s perhaps no coincidence that we see a rash of new bank and country downgrades as bearish Saturn makes its presence felt. The precariousness of the current economic situation is a stark reminder of the power of the planets. As irrational as it seems, the evidence we have observed here suggest that there are correlations between planetary alignments and collective human psychology. While the nature of these correlations is not fully understood, tracking planetary movements can provide a unique perspective to make sense of the market. The lesson here is a simple but profound one: any alignments that feature close angles between Saturn and Jupiter will tend to depress sentiment and increase the probability of declines. The presence of other outer planets such as Uranus and Neptune, as is the case now, may well act as amplifiers for the prevailing bearish mood. Saturn is now just three degrees from its exact opposition with Jupiter so it seems unlikely that a major rally can ensue until these two eternally jousting celestial bodies begin to separate in late January and February.
 Of course, astrology is nowhere near an exact science so it is necessary to assess probabilities more fully through other more conventional, if similarly incomplete, means such as technical analysis. As expected, we did get a test of support at the 50 DMA and prices corrected so that we also got that gap fill down to 1210. The break below the 50 DMA does look a little ominous and has bears salivating for a retest of the 11/25 lows of 1158. Coincidentally, this happens to be the almost exact level of the lower Bollinger band. Moreover, we can see how weak the late week rally attempts were as we got inverted hammer candles on both days with the 50 DMA now acting as resistance. Bears can also rightly point to the bearish MACD crossover and the falling stochastic line that has yet to be oversold on the daily chart. If the SPX wasn’t strong enough to puncture resistance at the 200 DMA at 1260, then one wonders if it is weak enough to break below the previous low at 1158. Hard to say. There is a significant amount of horizontal support at the 1200-1220 level dating back to August that could spur buyers to take positions in the event of any sudden pullbacks this week (e.g. on Monday). Perhaps 1158 would be more plausible as a downside target only if 1200 is breached. As I suggested last week, one wonders if we are gradually forming another triangle pattern of lower highs and higher lows. It’s possible although last week’s low was not quite low enough to add another touch to the rising trend line off the Oct 4 low. Perhaps that is an argument for a quick down move to 1200 which would touch the line, and then produce a stronger rally where Santa finally shows up to distribute gifts to all his faithful bulls.
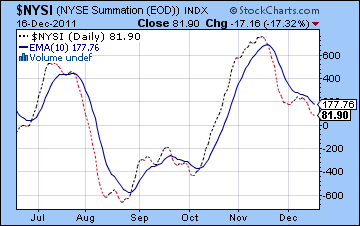
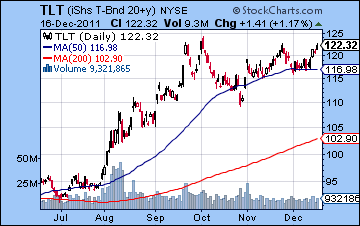
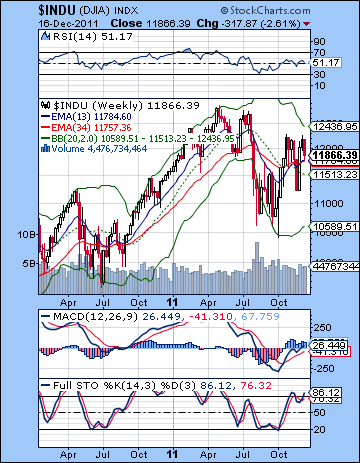 Treasury yields are falling again as investors seek safety in the face of uncertainty. Yields on the 10-year are well below 2% although they remain above October’s low. The long bond ETF TLT is approaching its recent highs, however, so we could be running out of room here in the near term. Barring some unexpected downgrade-type announcement, this would suggest that stocks may try to rally in the next few days as bond holders take profits from their recent rally. Bonds could break to new highs of course, but that seems less likely. The Summation Index continues to be below the 10-day EMA suggesting that the sell signal is still valid for swing trades. Market breadth is weak at the moment as evidenced by the fact that this index continued to fall on Friday when the market averages were higher. This is another sign that more selling may be ahead in the medium term. The weekly Dow chart still doesn’t look too bearish here as the 13-week EMA is still slightly above the 34-week EMA. MACD is still in a bullish crossover and on the rise while stochastics are also in a bullish crossover and are now in overbought territory. Price has moved up towards the upper Bollinger band and has some distance to go before it gets there. It does not mean it will necessary achieve this target but at least it may provide bulls with some reason for going long in the market. With Europe seemingly on the brink of the abyss, sentiment seems quite bearish at the moment. From a contrarian perspective, this is good reason to expect some kind of rally attempt. The bullish bias of the holiday season is another reason to expect some kind of bounce here.
The planets this week suggest the odds for a bounce are quite good, however it is unclear if it will begin on Monday or Tuesday. Monday’s Sun-Saturn aspect looks bearish as governments may feel repressed and hamstrung (another downgrade?). This increases the likelihood of a gap down at the open at least. Whether the bearish mood will continue through the day is less clear. I tend to think we will rally and finish green by the close. That said, I would not be surprised if Monday was actually lower, perhaps touching 1200. Tuesday has a slightly greater likelihood of a rally as Venus aligns with Jupiter and Uranus. This is a potent combination could create some significant buying. The alternate scenario is that Tuesday’s Moon-Saturn conjunction drags sentiment down in the early going but we get some recovery by the close. While the bullish scenario is definitely possible for Tuesday, it seems less likely. The Jupiter influence should be felt in the midweek period, most probably form Tuesday to Thursday. Wednesday therefore has perhaps the strongest likelihood of gains as the Sun tightens its aspect with Jupiter. Thursday could also see stocks rise, although gains are more likely to be confined to the morning. The Moon approaches its conjunction with Mercury and Rahu here so it could bring more instability by the close. While volume is likely to be quite thin in the pre-holiday period, Friday could be lower as the Moon conjoins Rahu more tightly. A somewhat larger decline is possible here, although the light trading may reduce the downside. Calling the overall week is a bit tricky because there is a chance that the early week could see a significant decline. Nonetheless, I would expect the week to be positive overall as Santa does his victory lap. Perhaps we finish somewhere between 1220 and 1240. Another test of the 200 DMA seems unlikely although if Monday turns out to be positive, then that uber bullish scenario would be worth considering.
 Next week (Dec 26-30) looks fairly mixed. One one hand, the Jupiter direct station on the 26th is quite a bullish influence. This could resonate more strongly with its aspect with Uranus and thereby provoke more risk taking. The difficulty here is that Mars forms its exact aspect to the recent lunar eclipse on Monday and Tuesday. Markets are closed on Monday for the observance of Christmas so perhaps that could moderate the situation. Jupiter notwithstanding, I don’t quite see strong evidence for the extension of any Santa Claus rally into New Year’s. It wouldn’t shock me, but it does not seem probable. Mercury conjoins Rahu here and Sun conjoins Pluto — both are nominally bearish influences. So there is actually a good case to be made for a down week here, although it may only retest 1200. The following week is the first week of 2012. This looks quite bearish as Rahu is backing into a minor aspect with Saturn. January looks bearish overall so I cannot rule out a major corrective move that could take out the 1158 low. It is very possible that the October low will be tested also during this month. A bottom is possible around the Mars retrograde station on Jan 23 although I would not be surprised to see the down trend continue into perhaps February 9 and the Saturn retrograde station. A rally is likely to begin sometime around either of those dates and continue into March 14th or so when Venus conjoins Jupiter and both line up in a nice pattern with Mars and Pluto. There is a high probability of a sizable rally here. If we have tested the October low (or broken 1000 — another distinct possibility), then the rally may only get up back to 1200. Another correction is likely to extend into April at least. Whether it’s a lower low is harder to say. It’s possible. I do expect a major decline (to 800?) in May and June so that is perhaps a better candidate for breaking the previous low of February or in the event the next pullback is milder than expected, October. 2012 is shaping up to be quite bearish.
5-day outlook — bullish SPX 1220-1240
30-day outlook — bearish SPX 1150-1200
90-day outlook — bearish-neutral SPX 1150-1220
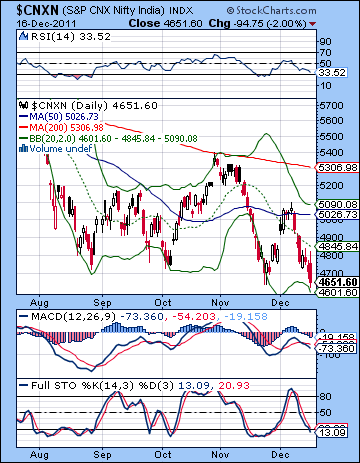 Investors suffered a bad case of buyer’s regret last week as the shortcomings of the EU’s fiscal union pact became readily apparent in the light of day. Despite the RBI’s holding steady on rates, the falling rupee undermined confidence further. The Nifty broke below key support at 4700 closing down 4% on the week at 4651 with the Sensex finishing at 15,491. This bearish outcome was in keeping with expectations as the midweek Mars-Rahu aspect produced four down days out of five. Monday’s sharp decline occurred a little ahead of schedule although it was not unexpected. After Tuesday’s bounce, the midweek was generally weaker as anticipated. However, the expected late week rebound never happened as Friday’s sell-off welcomed the RBI decision. Interestingly, the late week Sun-Venus influence that I thought might produce some buying did translate into higher prices globally, but Indian markets did not follow suit.
The sudden evaporation of "hopium" over the latest Eurozone accord came as no surprise to us of course as Saturn continues to strengthen in advance of its opposition aspect with Jupiter in January. While the market rallied in the days immediately following the fiscal pact investors realized nothing had actually ameliorated the debt problem. Tighter fiscal regulation would mean less deficits in the future, but it would do nothing to boost growth now. It all comes down to the liquidity. Without newly minted Euros coming out of Brussels in the form of Eurobonds or some kind of QE-style plan, investors are not willing to take the risk on stocks. The debt burden is simply too great when the growth prospects for Europe are shrinking by the day. Downgrades continue on banks and nations alike as the grim realization that earnings will eventually also succumb to the inescapable logic of Saturnian austerity. Germany is ruling the Euro roost here, so it seems unlikely that the liquidity addicted bulls will get their fix any time soon. As long as Saturn is tightly opposite Jupiter in the sky, I would expect the current climate of restraint to continue. Saturn’s aspect with Jupiter will last into January so that essentially precludes any significant rally from taking place. It also means that the door is still open to further downside in the event that growth forecasts are scaled back even further. As further proof of Saturn’s influence, inflation is abating in both India and China as the RBI has finally ceased its tightening for now. Just when it may begin loosen rates is unclear, although I would suggest that we may well have to wait until February before there is a change in its stance.
 Friday’s sell-off produced a significant breach of technical support at 4700 on the Nifty. This was the first close below that level since mid-2009. So does this technical failure mean that a downward flush is now imminent? It’s possible of course, but the market is already close to oversold levels so that may mean that further moves in this leg down may be limited. Stochastics is oversold although still in a bearish crossover. RSI is getting very close at 33 so that also may limit the downside appeal somewhat. Bears will likely try to defend 4700 as a possible new resistance level as support inverts into resistance. But if 4700 is broken to the upside, then the bearish bets are off, or least postponed. A break above 4700 would likely produce a test of the 20 DMA at 4850. The next plausible level of resistance would be provided by the 50 DMA near the 5000 level. MACD is in a bearish crossover also, although at least it has a positive divergence with respect to the previous low. The medium term outlook is still quite bearish according to the Nifty chart. All the moving averages are sloping downward, the 20 is below the 50 which is below the 200, and price is below the 20 DMA. It is still very much a bear market here that is searching for a bottom. We can still discern a pattern of lower highs and lower lows. Perhaps the bulls could get some relief if the previous high of 5100 is eclipsed. That may be the only level where the bull case makes any sense. The market would require a major piece of good news to achieve this level, however, since a purely technical bounce or short covering rally is unlikely to produce that kind of momentum. But a close above 5100 would at least make things interesting and entice bulls to take more positions.
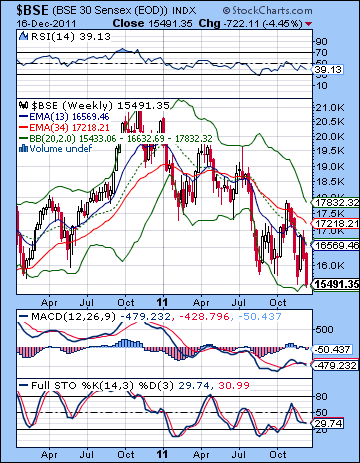
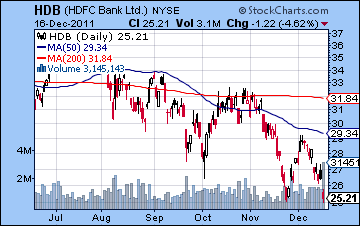
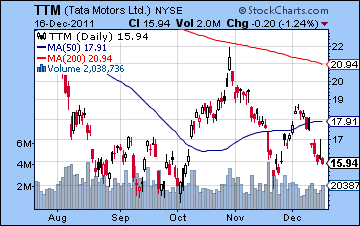
The weekly BSE chart continues to show the tell-tale bearish cross of the 13- and 34-week EMA. Both are sloping lower suggesting the medium term does not hold much promise for higher prices. MACD produced another bearish crossover last week while stochastics is still stuck in a bearish crossover since early November. Worse still, stochastics still has room on the downside to head lower. This does not necessarily mean we will see a direct continuation lower this week but it rather allows for the possibility that the market could extend this corrective phase into January without demanding too much from the technical indicators. That said, the bulls can point to the fact that the BSE has reached the bottom Bollinger band. We can detect other furtive possibilities for a bounce here as HDFC Bank (HDB) has formed a double bottom pattern. Friday’s high volume and the holding of support here sets the stage for a potential reversal. Tata Motors (TTM) has also formed a higher low here and may be signalling some tentative strength in the near term. Nonetheless, it may well retest the Nov 25 low before a more making a more serious move higher toward the 50 DMA.
 The planets this week look more bullish as benefics Jupiter and Uranus are subject to more aspects. That said, the week could well begin on the bearish note as Monday’s Sun-Saturn aspect could weaken sentiment. I would therefore not be surprised to see another losing day, or at least a gap down open. Tuesday also has the potential for a red day because of the Moon-Saturn conjunction although there is also an alternative bullish interpretation possible there too as Venus is approaching its aspect with Jupiter. Between the two days, however, I think Monday has a higher probability for declines than Tuesday. Venus aspects Jupiter on Tuesday/Wednesday and then the Sun aspects Jupiter on Wednesday/Thursday. These two aspects combined should offer support to the market in the midweek period. This is why I am generally more bullish this week. While some declines are quite possible and even probable early in the week, I think the upside prospects should be enough to push the Nifty back to the 4700 level and probably above. Friday looks more bearish, however, as the Moon conjoins Rahu and both come under the influence of Mars. This has the possibility of a significant down day which could erase a good chunk of the previous gains. So it seems likely that we will get at least one down day on either Monday and/or Tuesday followed by two of perhaps three up days into Thursday and then another down day Friday. This should produce net gains on the week and so the Nifty could end up somewhere between 4700-4800. Possible pitfalls to this plan would be a larger than expected decline on Monday or Tuesday (>2%) and a similarly large decline on Friday. While declines are fairly likely on those days, I don’t think they will be that large.
 Next week (Dec 26-30) looks quite mixed. While many are expecting some kind of Santa Claus rally to take hold into the end of the year, I am less convinced that we will see prices rise into the 30th. To be sure, Jupiter is stationing on the 26th and will be very powerful in its aspect with Uranus. But Mercury is approaching its uncertain conjunction with Rahu on Monday and Tuesday so that may upend expectations. Monday is therefore more of a down day with a possible recovery on Tuesday or Wednesday as the Moon conjoins Venus. The late week looks difficult, as the Sun conjoins Pluto on Thursday and the Moon opposes Mars on Friday. Friday in particular would be negative. The New Year will likely continue this uncertain mood as Rahu is in aspect with Saturn in the early part of January. Mars turns retrograde on 23 January and that should produce another injection of bearish sentiment around the end of the month. For these reasons, it does not seem likely that we will see another significant rally start until perhaps late January. It is possible we could see the Nifty fall to 4000 by this time, although I admit I am unsure about this. It may only drift down to 4500. February and March should see a major rally as Jupiter approaches its aspect with Pluto. This aspect is exact on 14 March so that is a potential date for an interim top. I am expecting another major correction to begin in late March and continue well into April at least. After another rally attempt in late April and early May, the market seems poised to decline, perhaps sharply, in May and June. Saturn stations on 25 June so we could see a significant bottom put in around that time. This is likely to be another bearish lower low. A deeper low (2500?) is likely by the end of 2012 or early 2013, however, which might present a significant medium term buying opportunity.
5-day outlook — bullish NIFTY 4700-4800
30-day outlook — bearish NIFTY 4500-4700
90-day outlook — bearish-neutral NIFTY 4500-5100
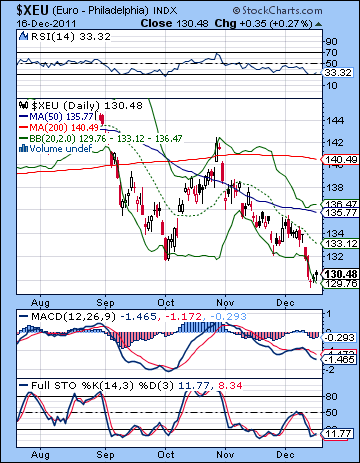 The Euro continued its death spiral last week as investors decided the fiscal pact was just more smoke and mirrors. After breaking support at 1.32, the Euro probed below 1.30 before closing a little above that mark. The Dollar Index finally reached the promised land above 80 while the Rupee extended its recent struggles with an all-time low that approached 53. It was a bad week technically for the Euro as it broke below the magic line in the sand below 1.32. This opens up the possibility of deeper retracement in the future. That said, it did bounce off horizontal support at 1.29 that dates back to Jan 2011. This is an argument for perhaps a bounce in the near term before continuing its downward journey toward the land of parity. The indicators are a little oversold here as RSI bounced off the 30 line on Wednesday. Stochastics is already oversold and is attempting a crossover on the late week rebound. MACD is still in a bearish crossover, however, although it at least can claim a positive divergence with respect to the previous low. The moving averages describe the very essence of a bear market chart: all three moving averages are sloping down and are in a bearish alignment (20<50<200). Price is below all three. When this bearish situation takes hold, rallies are often sold at the point of earliest resistance at the 20 DMA, now at 1.33 That would be one area of resistance. Actually, there may be more difficult resistance at 1.32 now that support may have transformed into resistance. Any rally to 1.32 will likely be met by a gaggle of salivating shorts.
If the medium term outlook is still pretty grim, this week has a decent chance for gains. The aspects of the Sun and Venus on Jupiter is likely to produce some significant upside around midweek, probably sometime between Tuesday and Thursday. It is less clear, however, if the Euro will decline before these aspects take hold. Monday’s Sun-Saturn aspect definitely looks bearish, as does Tuesday’s Moon-Saturn conjunction. I think Monday is somewhat more likely to see losses but I would not be at all surprised if these days flipped and Tuesday was down and Monday was higher. Strength is more likely into Thursday so that should be enough to erase any preceding declines. Friday’s Moon-Rahu conjunction looks bearish again. So perhaps the Euro will test resistance at 1.32 at some point this week. Next week looks less positive, although there is still some room for gains. I tend to think that the Mercury-Rahu conjunction on Tuesday the 27th won’t be good for the Euro and will undermine any tentative rally that might be underway. I would not rule out another test of 1.32-1.34 but it seems a little optimistic. More likely it gets range bound between 1.29 and 1.32. The Euro chart looks pretty nasty for January. I am expecting new lows with a possible plunge down to 1.20 around the Mars retrograde on 23 January. The Euro should bottom at the end of January or beginning of February perhaps around Saturn’s retrograde station on 9 February. The Euro should stay relatively weak (1.20-1.40) until June at least. Late June could also mark a significant low, although I am unsure if it will be lower than the Jan-Feb low.
Euro
5-day outlook — bullish
30-day outlook — bearish
90-day outlook — bearish-neutral
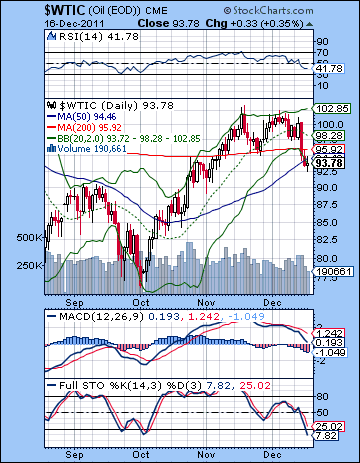 As recession fears intensified, crude oil sold off sharply as traders exited their inflation hedges. Crude lost 6% on the week closing at 93.78. This bearish outcome was in line with expectations, although if anything I underestimated the extent of the move. I thought the Mars-Rahu aspect would likely hit in the first half of the week although Wednesday’s huge decline arrived a little late. The late week rebound I expected was quite tepid and only showed up for Friday’s session. So it seems that crude is finally catching up to other asset classes by selling off after its extended test of resistance at the $100 level. Significantly, the 200 DMA did not offer support on the pullback as prices fell below. Support only kicked in from the next horizontal area at $90-92. The technical picture looks a little difficult here as the 200 DMA may now act as resistance. The breakdown also pushed against the bottom Bollinger band. After considerable narrowing of the bands, we now appear to have a textbook breakout lower. This suggests that more downside is likely in the near term. MACD looks quite bearish as the crossover is deepening as evidenced by the growing histograms. Stochastics are oversold, however, although they have not yet formed a bullish crossover. Bears can take heart in the fact that RSI still has a ways to go before becoming oversold. This may allow for more downside in the weeks to come. Support now is likely at $90 and if that should break, $80 would likely bring in buyers.
This week looks more bullish although there is some risk of downside in the early part of the week. Monday’s Sun-Saturn could well produce another down day as Tuesday could as well. I tend to think that even if Tuesday started negative, it might reverse by the close. So this view suggests there is a scenario where crude tests support at $90 perhaps on Monday or Tuesday. A more bullish unfolding might see only a small or temporary loss on Monday and then steady gains thereafter. By Wednesday and the Venus-Jupiter aspect we should see more solid gains with Thursday also tilting bullish on the Sun-Jupiter aspect. I suspect that the size of the gains will out pace any preceding declines so there is a good chance that crude will test its 200 DMA at $95 and even beyond. Friday looks more bearish on the Moon-Rahu conjunction. Next week looks fairly mixed as the Mercury-Rahu conjunction on Tuesday the 26th could offset much of the bullishness in the Jupiter direct station. I think crude could well end up range bound between $90 and $95 here. January looks more bearish, however, as Saturn’s aspect to Jupiter draws closer and Mars turns retrograde on 23 January. Moreover, Mars will exactly aspect the ascendant in the Crude Futures horoscope so this increases the likelihood of some down moves at that time. It seems likely that crude will test $80 at least by early February and I would not rule out lower prices as well. A rally into mid-March is likely after the probable February bottom. We can expect another corrective move starting in March which will continue into April. The next major low will likely occur in late June near the Saturn station on the 25th.
5-day outlook — bullish
30-day outlook — bearish
90-day outlook — bearish-neutral
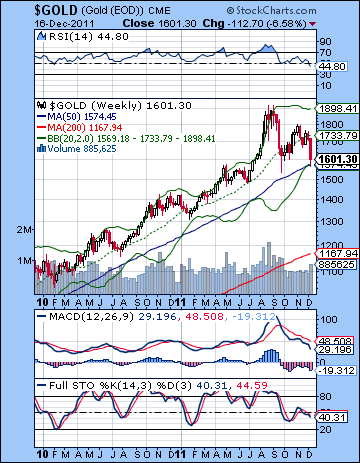 As prospects dimmed for any ECB money printing bazooka, gold and other commodities sold off with a vengeance. Gold plunged 7% on the week closing just above $1600. While I thought gold would likely fall on last week’s Mars-Rahu aspect, I never thought it could fall so far so fast. I held out $1600 as the possible next stop of support and prices did in fact bounce there after Wednesday’s swan dive. As expected, we did see a late week bounce on the dual ingresses of the Sun and Venus. Suddenly, everyone is bearish on gold. Dennis Gartman made a very high profile announcement that he had sold all his holdings as the media was full of commentary on how the bubble may have finally burst. Gold’s problem is that slowing growth means there is less threat of inflation. The high debt levels are also conspiring against more central bank printing which would encourage more inflationary hedging. So until there is another QE program in the US or in Europe, gold will continue to suffer. Technically, it is in a lot of trouble after falling out of the triangle. It’s broken below its 200 DMA at $1616 which may now act as resistance in the event of any rallies. It is very close to matching its piercing September low at $1530. Horizontal support is likely closer to $1400 and may well be the next stop in this corrective move. Below that, the bottom of the rising channel dating back to 2006 is around $1000. As extreme as that seems, it is possible that gold could correct all the way down to that level. The weekly chart shows how much trouble gold is in. RSI is now below 50 for the first time in three years and is trending lower. MACD is in a bearish crossover and still has a long way before it even gets to the zero line. Stochastics is also in a bearish crossover and is not yet oversold.
Gold may slip further early this week, but prospects should brighten by Wednesday. The main source of bearishness here is Monday’s Sun-Saturn aspect. Saturn generally does not like gold, so any contacts with the Sun often result in lower prices. Monday could well be a down day. Tuesday is harder to call with potentially offsetting aspects. Venus is approaching its aspect with Jupiter which ought to produce more buying but the Moon conjoins Saturn on the same day. This is why I would not be surprised to see any weakness extent into Tuesday. At the same time, I don’t think two down days in a row are a probable outcome. Possible, but not probable. Wednesday has a better chance for a decline as the Sun moves into aspect with Jupiter. Thursday also seems more bullish as the Sun aspect is still close. Friday may see sellers take over again as the Moon-Rahu conjunction looks unfriendly to gold. Gold may well rally back to retest the 200 DMA at $1616 by Thursday and it is even possible it could climb higher than that. Friday looks negative enough that I wonder if gold will end up back below $1600. Perhaps it won’t be too far from its current level but the upside seems limited. Next week looks mixed although with a possible bearish bias. I don’t expect a big down move here but more downside is definitely possible. January looks mostly bearish as the Rahu-Saturn aspect and the Mars retrograde station look bearish for gold. I would not be surprised to see gold hit $1400, or maybe lower by the end of January. Gold looks mostly bearish until June 2012 at least. A lower low is likely at that time. After a rally from July to September, the end of the year will likely see gold suffer another corrective move into early 2013. That may be a significant buying opportunity for the medium term.
5-day outlook — neutral-bullish
30-day outlook — bearish
90-day outlook — bearish

