Summary for week of January 2 – 6
Summary for week of January 2 – 6
- Stocks to have negative bias especially towards end of the week; correction likely in January
- Euro to stay weak with further losses more likely on Thursday/Friday
- Crude to be mixed this week; bearishness more likely in second half
- Gold could strengthen early but prone to declines in second half of week
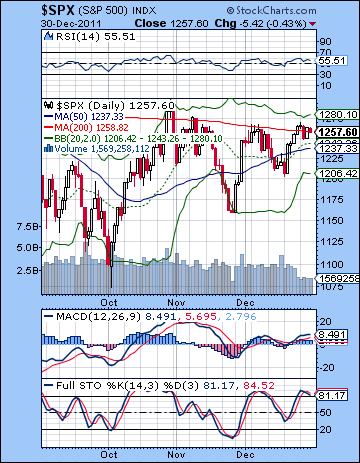 Stocks edged lower in the final week of 2011 as investors weighed improving economic data against a backdrop of more Eurozone uncertainty and elevated Italian bond yields. The Dow declined by less than 1% closing at 12,217 while the S&P 500 finished at 1257. This slightly bearish outcome was largely in keeping with expectations, although the extent of the loss was somewhat milder than anticipated. As expected, the Mercury-Rahu conjunction on Tuesday and Wednesday did produce a net negative outcome as Tuesday was flat and Wednesday saw a decline of greater than 1%. I also thought we would see one up day from the Sun-Pluto conjunction on either Wednesday or Thursday. Thursday’s gain was substantial and almost revisited the previous high at 1260 and the 200 DMA. Friday was lower as expected although the extent of the decline was quite modest — just half a percent.
For the year, the Dow was up about 5% while the broader averages were slightly lower. Given the rash of Saturn aspects, I thought we would have seen more enduring downside so this largely neutral outcome was disappointing. While the liquidity-fueled rally of 2009 and 2010 largely played itself out, the market only hinted occasionally of collapse and ultimately rewarded bulls who continued to place their faith with the Fed and Bernanke’s efforts to reflate the economy. I had some bearish hopes that the market might tumble into year-end on the strength of the Saturn-Jupiter opposition but so far that has not happened. One reason is fairly obviously due to the offsetting effects of Uranus on Jupiter which has fueled December’s rally off the Nov 25 low. I noted the possibility of this more bullish scenario coming to pass several weeks ago but was not confident enough in its strength to dismiss a bearish outcome out of hand. The Saturn-Jupiter aspect is still in effect through much of January so it is still probable that we will see more downside in the short term. However, I am less inclined to expect much bearish fireworks so a revisiting of the Oct 4 low is probably not going to happen until Q2. That means that it is more likely that we will make some kind of higher low between now and early February. This could be anywhere between 1100 to 1180 although one cannot rule out an even higher low. Of course, even in this bear-lite scenario I could be mistaken and we could somehow continue to rise up to 1320 and that next resistance zone. Technically, it is possible, but the planets do not make a strong case for such a bullish January or February. A better bet for a rally move would appear to occur starting in early to mid-February and continuing into mid-March. That may be a time when that upper resistance zone between 1270 and 1320 is tested for real.
 The technical picture remains mildly bullish here as the SPX is perched atop the 200 DMA awaiting a firmer signal either way. While it broke above the falling trend line from the July high last week, it has yet to make a convincing breakout higher. Wednesday’s low may be seen as a back test of that trend line perhaps and therefore gives bulls some ammunition for their optimism as we head into 2012. Taking a step back for a moment, we can see how the market’s moves after the Oct 4 low suggests a more bullish dynamic at work. While the highs were progressively lower (and therefore not bullish by any means), the lows were much higher proportionately and reflected an eagerness by buyers to enter the market. In that sense, the SPX chart resembles a tilted ascending triangle. Also note how the length of time of each move shows the strength of the bulls. November’s push lower took almost a month, whereas the rebound in early December almost completely made up for the loss and was accomplished in about 6 or 7 trading sessions. Of course, a lot depends now on whether the current resistance near the 200 DMA can hold and produce another down move. The technical indicators appear to favour the bears actually as MACD is leveling off while stochastics is looking like it is rolling over and about to head back below the 80 line. RSI may have topped out around the 60 line early in the week although it is too soon to tell. A bullish cross of the 50 and the 200 DMA would be a very bullish signal as it would negate the bear market signal given in August. That would very much put us back to square one as far as basic market dynamics goes. It still has a ways to go before that happens, however.
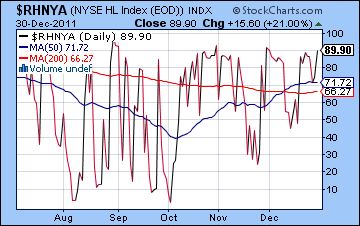
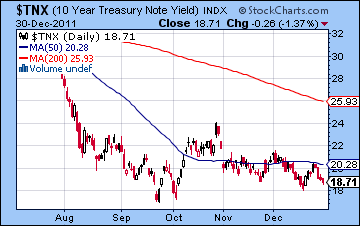
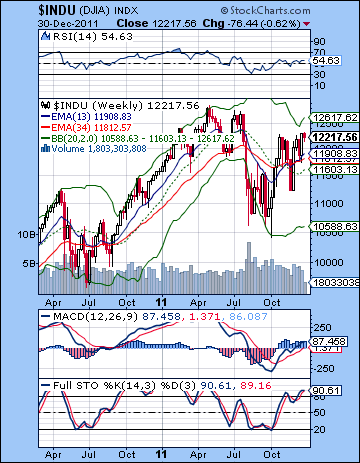 While the Summation Index is still showing a buy signal, the High-low index ($RHNYA) is again pushing up against nosebleed levels near 90. This is not a good place to launch a new rally. It seems more likely that we are overdue for a pullback of some size before a rally is again attempted. If the market is in a bullish phase which it may well be at the moment, a correction may only take this indicator back down to 50. Meanwhile, bond yields continue to point to some nervousness in financial markets. Yields on the 10-year fell last week despite the market being mostly flat. We may finally be approaching a bottom on yields in the coming weeks. In the event of a shock low type of event from a large sell-off, yields could easily match the October low or go even lower. That may offer a decent entry point for a shorting opportunity. The weekly chart still looks viable on the long side. MACD is in a bullish crossover as is stochastics. Resistance may be found in the upper Bollinger band and we are quite close to that level now. The upside seems somewhat limited. But there is still the beginnings of a bullish crossover in the 13 and 34 week EMA suggesting that maybe, just maybe the market has bottomed for now and will proceed higher. Like many swing trade indicators, this is subject to considerable lag so one cannot read too much into it. At least it provides a plausible argument for bulls to go long. Even if we see a sizable pullback in January as I expect, we may not see significant technical damage inflicted on the weekly chart. The monthly chart shows a clearer sell signal through the crossover with the 10-month EMA. But to make this weekly chart really bearish, we still need to see a bearish crossover in the MACD and stochastics and right now we are not seeing that. If we only correct back to 1180, then we may not see it at all. This would postpone the deeper correction until April and beyond.
This week appears to favour the bears. There are a few patterns worth watching. Saturn is making its closest aspect to Jupiter this week and next so that may act as a sort of background bearish default for the market. Rahu is also moving into position for a minor but exact aspect with Saturn this week and next week. This is another important reason to lean bearish in early January. Tuesday is somewhat harder to call, however. It would be grand of course if we plunged several hundred points at the bell but the problem is the planets do not paint that kind of bearish picture. It is still possible given the proximity of the medium term aspects but it is not what I would call probable. Mercury’s entry into Sagittarius on Tuesday and Wednesday is actually a bullish influence that could boost the market on one of those days. For this reason, I would not be surprised to see some kind of head fake higher. But the odds increase for a down move later in the week as the Sun is in aspect with Rahu and Mercury comes under the influence of Saturn, especially on Friday. It is possible that the Sun-Rahu aspect could manifest a little earlier and that is one reason why I am not ruling out a major down move on Tuesday. So the intraweek picture is more impressionistic than usual. Perhaps down Tuesday to 1240 and a rebound Wednesday to 1250 followed by a harder decline into Friday to perhaps 1220-1230. I do think there is enough bearish planetary energy to generate that kind of downside. And yet I would not be shocked if we ended up retesting 1270 again on Tuesday or Wednesday and then falling back to 1240-1250 by Friday. This more bullish scenario seems less likely, however.
 Next week (Jan 9-13) also presents a plausible case for more downside. The Rahu-Saturn aspect is quite tight here so that could serve to magnify any downside move. Venus enters Aquarius on Monday so that could support prices somewhat. I would tend to lean bearish after that. The late week features potentially powerful negative aspects: the Sun is in aspect with Mars while Saturn, Venus and Neptune are also in close alignment. While this could produce a sudden rise, I tend to think it will be bad news for the market. Thursday and Friday therefore look worse here with a large decline quite possible. The following week (Jan 16-20) is more of a mixed bag. On one hand, Mars is slowing down ahead of its retrograde station on the 23rd. This is a negative influence on the market, especially since it will be activating the natal Mars in the USA horoscope. This makes significant military action more likely. It is hard to know if such a military action would be bearish for stocks, but it definitely is worth watching. Iran’s recent claims on shutting down the oil supply through the Straits of Hormuz is one possible scenario that could play out negatively for the market. The end of the week could be more bearish. Then Mars stations on the 23rd so that could keep the bearish bias intact until the end of the month. It is possible that we will see a bottom near this time although it could occur as late as February 7th or so when Saturn turns retrograde. Whenever the bottom occurs, a rally is quite likely to begin soon after as Jupiter approaches its aspect with Pluto. This is exact on March 14 so stocks are quite likely to stay strong in the preceding four weeks at least. Just where the rally peaks is hard to say and a lot will depend on the low we make beforehand. If we went down to 1120, then 1270 would be more difficult to achieve by mid-March. A lower high (<1260) in March would be quite perfect technically of course since it would create the pre-conditions for another huge sell-off starting in late March and April. I think the odds are high for a significant corrective move in Q2 with an important interim low put in in June or perhaps early July. This may be the time when we decisively break the October low of 1074.
5-day outlook — bearish SPX 1220-1240
30-day outlook — bearish SPX 1100-1180
90-day outlook — bearish-neutral SPX 1240-1300
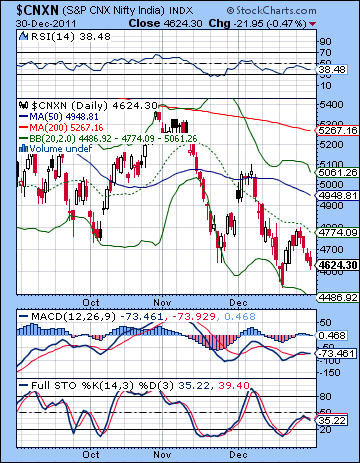 Stocks tumbled again in the final trading week of 2011 as growth worries continued to weigh on sentiment. The Sensex declined 2% closing at 15,454 while the Nifty finished the week at 4624. The Sensex lost 25% during 2011 and was the first down year since 2008. This bearish outcome was in keeping with expectations as I thought the midweek Mercury-Rahu combination would likely force prices lower. Actually the week unfolded fairly closely to the plan outlined in last week’s newsletter. Monday was higher as expected as Jupiter’s direct station created a more bullish environment. But it was all bears after that. I had though we might get another up day, perhaps on Thursday, but this was not the case. The Mercury-Rahu conjunction was bearish enough to more than erase Monday’s gain. Then the Sun-Pluto conjunction took over later in the week. Friday was also lower as expected as prices fell on the Moon-Mars opposition. The extent of the decline was largely in keeping with our target of 4600, although it ended slightly above it.
So while we never did see Nifty 4000 in 2011 as I had thought we might, we did at least break below support at 4700. That is something at least given that the Nifty started the year well over 6000. The poor performance of the market has largely adhered to my expectations this year as I thought the various Saturn-related patterns would likely force a fairly deep correction through much of the year. I am somewhat disappointed that the current Saturn-Jupiter aspect has not produced more downside, however. While the market is clearly weak at the moment, this aspect looked as it it might have the necessary bearish energy to take stocks lower than their current level. We are still in the midst of this aspect so there remains some possibility for more downside in January. Worries over growth prospects are very much in keeping with Saturn-dominant aspects. The picture remains complicated by the presence of Uranus and Neptune this alignment. This may be one reason why the Saturn-Jupiter aspect has been less damaging than first thought since Uranus is closer to Jupiter than to Saturn where it can serve to boost the bullish effects of Jupiter. Now that Saturn is approaching its retrograde station on 7 February, it is moving closer to its aspect with Neptune. This could act as a more bearish influence that could offset the more positive Jupiter-Uranus influence that has kept the market from falling off a cliff in December. The close proximity of these four slow moving planets is the main reason that I remain biased towards the bear side through much of January and into early February. At the same time, there are mitigating factors that could reduce the downside influence. It’s a complex picture to be sure.
 The technical picture remains as challenged as ever. As I noted last week, one test of the weakness of a market was its inability to move above its 20 DMA. That is what happened Tuesday when the Niftydid an about-face at 4800 just below the 20 DMA. This is a basic sort of minimum requirement of a bear market rally. The fact that the Nifty fulfilled it suggests that it may be more prone to lower lows in the near term. RSI is again falling and shows a series of declining peaks. It also has room to fall to the 30 line before becoming oversold. That seems bearish. MACD is on the verge of a bearish crossover here and while one could point out the positive divergence with respect to the two previous lows, it is not a chart that looks obviously bullish. Stochastics is in a bearish crossover now. Another trip to the lower Bollinger band would mean falling below 4500. That would be quite bearish indeed. Perhaps the Nifty is following the 3-push down pattern where a chart often makes three distinct pushes lower before a bottom is put it. Following this model, the first push lower culminated on 25 November, the second push to a lower low was on 20 December. While nowhere near an iron rule, it may suggest that a third push lower is in the offing, perhaps one that will breach the 4500 level.
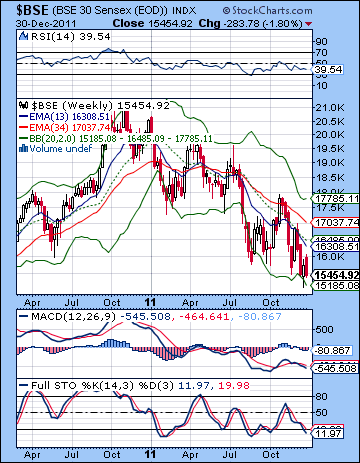
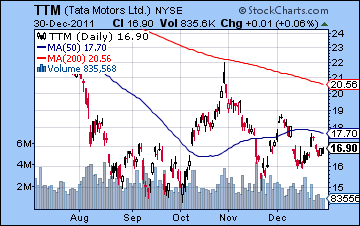
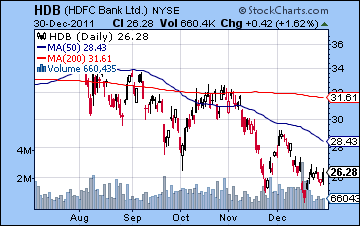
If support lies around 4500, resistance is likely still near the 20 DMA at 4800 in the near term. We can see a falling wedge pattern here will support coming in around 4400 and resistance at 4700. A break out from this wedge would be quite bullish, although it will be a long road back to the 50 and 200 DMA. The weekly chart of the BSE shows how bleak the situation has become as price continues to move in a declining channel and is hugging the bottom Bollinger band. The 13 week EMA is still below the 34 week EMA suggesting an ongoing bear market that shows no signs of reversing. Stochastics is oversold, however, so that may be one clue that we could be near a short term bottom. MACD is still in a bearish crossover, however, and well below the zero line. The problems of the market are seen through the individual charts of issues such as Tata Motors (TTM). This is actually not that bad as we can see an attempt to form a base in the past few months. A triangle pattern has emerged here from which there will be a decisive breakout soon. If it is on the upside, it will first have to clear to the 50 DMA — no easy task. A breakdown of support would likely hasten a retesting of the October low. Given the triple bottom from September and October, this stock has perhaps less further to fall in the event of a technical failure from current levels. HDFC Bank (HDB) is looking more vulnerable as it as a long way from testing its 50 DMA. A swift retest of its 20 December low is quite possible here, although it is unclear how solid that would be as support. This is not a healthy chart.
 This week looks bearish and perhaps less clearly so. There are a couple of medium term influences that could serve to magnify the down move so it is important to watch for larger moves. Saturn is coming very close to Jupiter this week and next and that could spell trouble for the markets. Also Rahu is coming into a close aspect with Saturn over the next two weeks and that could also create problems. Just when these down days will manifest is less clear, however, but it does mean that January has a definite potential for volatility. Monday’s Moon-Jupiter conjunction may actually be bullish, although it is not a reliable aspect. Mercury remains under the negative aspect of Mars on both Monday and Tuesday so that may well tilt the scales to the bear side in any event. Wednesday features Mercury’s entry into Sagittarius and this may provide some lift for prices. But the late week looks iffy again as the Sun is in aspect with Rahu while Mercury comes under Saturn’s influence by Friday. Actually, the Sun is in aspect with Rahu for much of the week so the damage could be done at any time from this aspect. My guess is that it will tend to weigh on the late week action. My intraweek forecast is a looser than usual. One possible scenario would be down to 4500 by Tuesday and then a rebound back to 4600 Wednesday followed by a second test of 4500-4600 by Friday. Somehow I can’t believe it will unfold in such a neat way and I would not be surprised to see more upside, or least more sideways action here. But there is a good chance that we will finish lower overall, but perhaps not by much. Also the probability of a negative outcome is not as strong as it was last week.
 Next week (Jan 9 -13) looks more bearish. Saturn moves closer to its aspect with Neptune and this may produce larger than normal declines. I don’t expect anything like a crash here but we could have days where the market falls more than 2%. Monday may actually be quite bullish as Venus enters Aquarius and Mercury lines up with Jupiter and Uranus. I would expect any rally attempt early in the week to fade quite soon. The following week (Jan 16-20) has the possibility of more upside as Jupiter forms an exact aspect with Uranus. The late week alignment with the Sun, Saturn and Neptune may undermine some of that optimism, however. Plus Mars will be slowing down ahead of its retrograde station due 23 January. This casts a cloud over the end of the month. A slow Mars is a more dangerous Mars. It not only exacerbates nervousness and anxiety, but it can also increase the odds of violence and military action in the world. Given the current tensions over Iran and the Straits of Hormuz, we cannot rule out a more assertive move in the region at this time. This would likely spike up the price of oil and be bearish for equities. It’s a possibility to bear in mind. Generally, I would be quite cautious about equities until the Saturn station on 7 February. It is therefore conceivable that markets still stay bearish until that time. That said, I would not be surprised if they reversed higher a week or two earlier than that date. A strong rally looks likely through February and early March as Jupiter approaches Pluto. This is the same combination of planets that produced the October rally so we should prepared for a sizable move higher. Depending on what kind of low we see in January or early February, another test of the 200 DMA at 5300 is quite possible and it could advance even higher than that. However, Q2 looks more bearish so I would expect the rally to fizzle by April. A lower low is possible by the next Saturn station in late June. At that time, Uranus and Pluto form a very tight square aspect which could correlate with a major setback for the global economy. After a rebound in Q3, the last quarter of 2012 looks very bearish again. I would therefore not rule out a retest of 2500 on the Nifty by the end of the year.
5-day outlook — bearish NIFTY 4550-4600
30-day outlook — bearish NIFTY 4300-4500
90-day outlook — neutral NIFTY 4500-5000
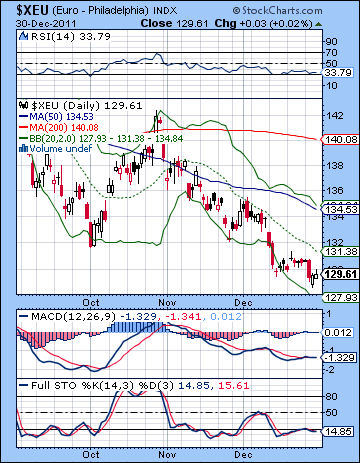 Worries about the high level of Italian bond yields pushed the Euro lower last week as it made fresh one-year lows below 1.30. The Dollar Index finished above 80 while the Rupee moved above 53. This negative outcome for the Euro was largely in keeping with expectation as I thought we could retest the previous low at 1.29. The Euro rebounded later in the week but remains in a precarious position unable to recapture its 20 DMA. Stochastics are oversold here and MACD is almost in a new bearish crossover and is trending lower. RSI is also trending lower. From a contrarian perspective, sentiment is so negative on the Euro right now, that one might be forgiven for expecting a pop higher. Such a move would still require some seriously good news from the ECB or some other source of liquidity. Spain unveiled its latest austerity plan and acknowledged its situation was worse than anticipated. But this is all getting rather routine at this point and I wonder what it will take to cause a new sell-off in the Euro. Is there any more bad news out there that has not been discounted by the market? Widespread rioting might be one possible thing that spooks markets or another failed bond auction. Apparently, Spain is due to sell more debt on Jan 12 with Italy following suit on Jan 13. Another failed auction that does not bring in enough buyers would definitely create some selling panic that could push the Euro into a new lower range. But so far its decline has been fairly orderly and that is likely to continue unless some unanticipated news crops up.
This week may be bearish, although it is possible that most of the down action will arrive later on the Sun-Rahu aspect. The aspects in the early week look more equivocal so I would not be surprised to see another rally attempt into Wednesday and Mercury’s entry into Sagittarius. But the odds increase for more downside on Thursday and Friday. The Euro horoscope is also afflicted by transiting Mars at this time so that increases the likelihood of a down move, probably in the late week period. Actually, the Mars affliction may well continue throughout most of January since Mars stops moving and turns retrograde on January 23. This is a bearish planetary influence over the whole of the Euro chart for a while, but due to its reduced velocity it makes pinpointing the maximum effects more difficult. This is not to say that the Euro will keep declining throughout January. I don’t think that scenario is likely (although it is possible with this Mars influence). I think we could see sharp moves in both directions with an general downside bias. This makes 1.26 a probability, and 1.20 quite possible also. We could see a bottom by early February. The Jupiter-Pluto in mid-March will likely make the risk trade more attractive and therefore a significant rally is likely to begin in February. April may well be the cruelest month and initiate another downward move. I think the Euro is likely to stay weak until at least mid-year.
Euro
5-day outlook — bearish
30-day outlook — bearish
90-day outlook — bearish-neutral
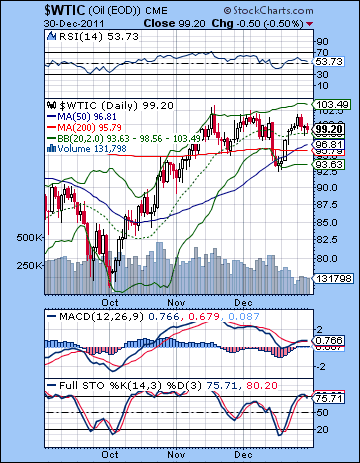 Despite more saber rattling between the US and Iran over the Straits of Hormuz, crude edged lower last week closing near $99. I thought we might have seen a little more downside, especially on Tuesday and the Mercury-Rahu conjunction. As it happened, the bears did not show up in force until Wednesday. Crude is trading near the top of its recent range and seems unable to crack above resistance at $102. Obviously, major developments in the Middle East could completely change this dynamic and therefore makes technical analysis somewhat less useful than it otherwise would be. Nonetheless, support does look quite strong with all three moving averages clustering between $95-98. It will take a significant move to break that support. Stochastics suggests some weakness ahead as the bearish crossover has occurred just below the 80 line. MACD is enjoying the narrowest of bullish crossovers here but may slip below the zero line in the event of any correction. RSI is looking tired as we can see a series of falling peaks. Perhaps a dip down to $95 will create an IHS pattern which will foreshadow a significant rally move. At the moment, however, resistance is looking quite formidable just above $100. A close above $102 would be quite bullish and would suggest we are moving higher. A close below the previous low of $90-92, however, would be a very bearish and would likely spark more selling.
This week could be mixed, although I would lean towards a bearish bias. The early week could actually go either way as Mercury’s entry into Sagittarius could temporarily lift the market. For this reason, I would not rule out another rally attempt on Tuesday or Wednesday. I would not be surprised to see another test of resistance at $102. But the Sun-Rahu aspect looks more bearish later in the week and that may well have the final say here. I would therefore think the odds may favour a lower close by Friday. To be honest, January is shaping up to be a perplexing month. Next week could well see more downside but I suspect it will not be huge. Perhaps we won’t even crack the $95 level. The following two weeks are somewhat contradictory. Some planetary measures are looking very bullish indeed while others, such as the Mars retrograde station on January 23, look extremely bearish. I have not quite figured out how to square this circle yet. My best guess is that we could well rally strongly into the last week of January, perhaps as a result of geopolitical tensions. Certainly, Mars can do that when it is energized as it is here. We could see elevated crude prices into February although that seems somewhat less likely. I admit that I am somewhat uncertain about the current period. The evidence seems a little contradictory and I would not be surprised to see crude follow equities lower also. That makes my forecast much less useful than usual.
5-day outlook — bearish-neutral
30-day outlook — bearish-neutral
90-day outlook — neutral
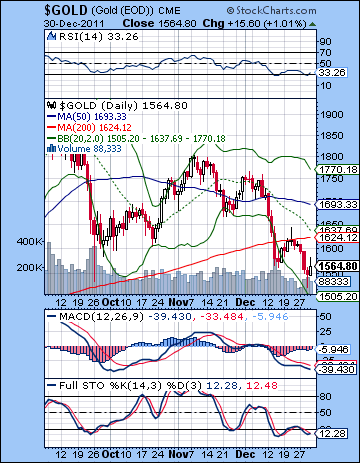 Gold suffered another loss last week as the rush to the exits continued following more high profile analysts declaring the bull market was dead. Despite Friday’s significant rebound, gold closed down 2% on the week at $1564. This bearish outcome was largely in keeping with expectations as I thought the early week influence of Rahu and then Pluto would be trouble for gold. As expected, we did test support at $1550 and actually broke below it on an intraday basis. Things are not looking good for everyone’s favourite inflation hedge, but that is pretty much what one would expect when inflationary threats are fading. There may come a point when sentiment gets so bearish that it pays to be contrarian and take the long side of the trade. It is unclear if we are there yet, however. Ever faithful gold bugs will typically use corrections to buy more at lower prices in the hope of the inevitable debasement of fiat currency. That may be a plausible assumption for the long term, but the problem is that it means that the short side of the trade may be less crowded than many people think. This could allow gold to continue to fall for an extended period of time. Gold was rejected at its 200 DMA and now is in danger of falling to the next horizontal level of support, perhaps to $1400. But RSI may have bottomed in the short term so that augurs somewhat positively for a bounce. Only a close above the 200 DMA would provide any real hope of reversing the current down trend.
This week could see some early upside on Mercury’s ingress into Sagittarius. This is not a strongly bullish indication, however. The second half of the week looks like a better fit for a bearish outcome as the Sun-Rahu aspect is unlikely to to be positive for gold. Whether we finish lower overall is harder to say. I would expect the overall down trend to continue. Next week could begin on a bullish note as Venus enters Aquarius on Monday. There is a chance that gold could actually see small boost though most of next week as Venus approaches its conjunction with Neptune. Saturn could act as spoiler however through its aspect to both of these otherwise bullish planets. The rest of January would appear to tilt bearish as the Sun-Saturn square on the 19th along with the Mars retrograde station on the 23rd will create a difficult environment for gold. The correction may well continue all the way until the Saturn station on 7 February. That is not probable, but it is a date I am watching for a possible turn. $1400 is a possible downside target here, although given the level of uncertainty I have about January’s direction, that should be taken with a grain of salt. Gold should bounce significantly by mid-February and this will last well into March. April looks very bearish for gold so I would expect a lower low to be made by May or perhaps June. After a significant bounce in Q3, Q4 should be very bearish again. November to January 2013 could see a sharp drop in gold.
5-day outlook — bearish-neutral
30-day outlook — bearish
90-day outlook — bearish-neutral

