Summary for week of January 9 – 13
Summary for week of January 9 – 13
- Stocks prone to declines into midweek; large move possible at end of the week
- Euro to remain weak into February
- Crude could pullback into midweek but late rally is possible
- Gold mixed this week with gains likely Monday and Friday
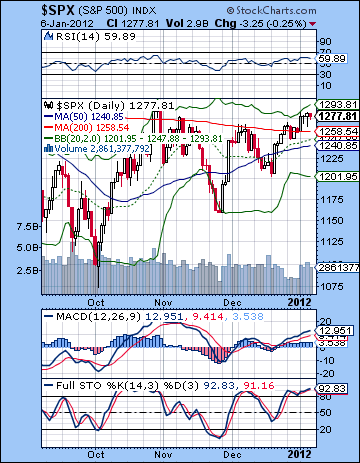 Stocks moved higher last week as the absence of any bad news was enough to bring out buyers in the traditionally bullish first week of the New Year. The Dow rose by almost 2% closing at 12,359 while the S&P 500 finished at 1277. While I was not shocked by this bullish outcome, I did think we would at least see more late week declines. As I noted last week, there is a problem nailing down just when these medium term aspects will manifest themselves. As a result we saw the market melt higher. Mercury’s entry into Sagittarius early in the week seemed bullish although I did not quite expect the SPX hit 1280 as it did on Wednesday. As expected, the second half of the shortened trading week was somewhat weaker than the first, although the downside was marginal to say the least. More accurately, the market was flat.
2012 has more or less continued where 2011 left off. The Eurozone remains a source of worry for the global economy. The level of uncertainty is so great that private European banks are parking record amounts of overnight cash at the ECB instead of lending it to other banks. Saturn is still very much in the driver’s seat here as fear of insolvency and default remains high. Thus far, no new bailout schemes are being considered and the ECB is not expected to issue bonds any time soon. This has led to more selling in the Euro and lower yields on US treasuries, although equities have largely remained immune. As long as Saturn remains in close range of its opposition aspect with Jupiter, I would expect the broad contours of this situation to persist. This means we could see pressure on equities last into early February. Admittedly, stocks have managed to melt higher despite the Saturn effect. The bullish effect of the Jupiter-Uranus remains in force here and is counter posed against whatever restraint and caution Saturn can summon. We can at least credit Saturn with the unimpressed reaction to Friday’s favourable jobs report. Despite the improving numbers, the market had largely discounted it and sold off modestly. January and February will see Neptune enter into the already established alignment of Saturn-Jupiter-Uranus. While Jupiter-Uranus are a mostly positive pairing, Saturn-Neptune look more bearish, especially since they will form a tight aspect later in January. This is one crucial reason why I am expecting some downside to manifest before the market moves higher into March with more conviction. And yet the close proximity of the Jupiter-Uranus aspect at the moment means that the downside move could be fairly shallow or even postponed a couple of weeks.
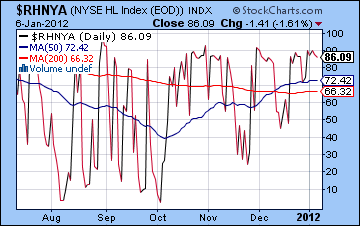 The technical picture continues to be fairly bullish as prices have remained above their 200 DMA for the second straight week. While broader averages like the Russell 2000 continue to trade below their 200 DMA, it is sign of some strength that the leading indexes are trading above this level. The SPX has yet to break above its October high of 1292, however, so remains another important technical barrier for the bulls. The broader averages remain well below their October highs. The market is clearly in a repairing phase here and yet it cannot quite said to have healed completely. The 50 DMA is still below the 200 DMA. Last week’s rally took prices very close to the upper Bollinger band and may well be setting up some kind of correction. It is possible that this early January rally has been manufactured to some extent since it is closely watched as a bellwether for the year to come. Volume has been below normal and therefore the implications of the rally are more unreliable than they otherwise would be. The technicals look only moderately bullish. The RSI cannot seem to climb above 60 which would mark a more thoroughly bullish phase to the market. We can see a bullish crossover on the MACD chart but the negative divergence is looming there in the event that we do manage to climb above 1292. Stochastics is still overbought suggesting that the upside potential is less than the downside risk. The High-low index ($RHNYA) may well have peaked on Tuesday at 90 and is backing off from that high. 90 is a common level for reversals, although the late August reversal occurred closer to 95. This may have been partially due to the depth of the preceding sell-off and the strength of the subsequent relief rally.
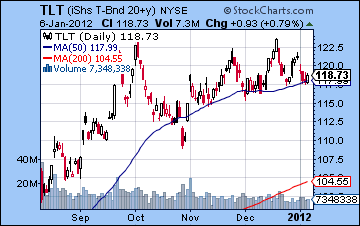
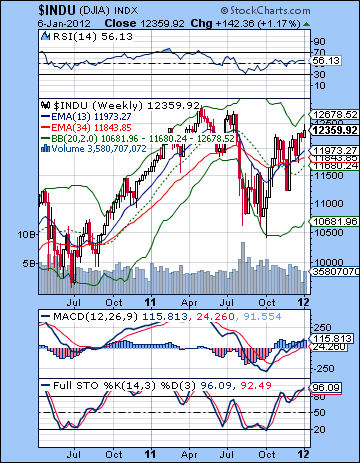 The Summation Index is rising and still shows a buy signal. Meanwhile, treasuries are looking quite bullish here as TLT is holding above support from its 50 DMA. While one could argue that this chart is close to a top, it nonetheless does not support the notion of an extended equities rally. This is the case at least as long as it remains above its preceding lows and above its 50 DMA. The weekly Dow chart still looks bullish as the 13 week EMA is above the 34 week EMA. One would be tempted to think this is analogous to a similar crossover in October 2010. From a purely technical perspective, it is similarly bullish. And yet the extent of the preceding bearish crossover was much deeper in 2011. For this reason alone, one has to look at these bullish swing trade indicators here more skeptically. Stochastics have rebounded all the way to 96 and are looking a little tired. Given the proximity of price to the upper Bollinger band, there is a reasonable downside risk of a pullback at least to the 20 WMA at 11,680.
This week could be quite important for the market. Astrologically, it will be a test between the bullish influence of Venus and the bearish influence of Saturn. There is a very close Saturn-Rahu aspect through much of the week which has the potential to undermine confidence through surprising developments. An EU country downgrade is possible, even if it is somewhat already expected. Saturn is forming its closest aspect with Jupiter this week so that is another one for the bears. However, Jupiter is again moving into a very tight aspect with Uranus which could seriously minimize the downside. More immediately, Venus has the potential to take stocks higher. On Monday, Venus enters Aquarius. This makes it a decent candidate for a positive day. While the medium term influences tilt bearish, this short term aspect could postpone the downside until Tuesday. That is one scenario anyway. The midweek lacks any close aspects so it is somewhat harder to call. I would default towards bearish here, however. It is Thursday and Friday that are most interesting. Thursday’s Sun-Mars aspect seems bearish while a bullish Venus-Neptune conjunction occurs on Friday which ought to take stocks higher. The problem here is that it forms a tight trine aspect with Saturn. This could end up marking a significant decline or paradoxically generating a significant up day. Neither outcome would surprise me, although since we are "owed" some downside from the Saturn-Rahu aspect, this negative outcome has a somewhat higher than chance probability. Unfortunately, it is not as high as I would like. Nonetheless, the bias is down here and there is a somewhat greater chance for a larger than normal decline. Even if Friday ends up positive, there is still a chance for a down week overall. And if Friday should be negative, then we could be looking at a significant reversal. I tend to think that the 200 DMA at 1258 will act as support so that even if we fall below that level, Friday may see a rally attempt back up to it.
 Next week (Jan 16-20) is harder to call owing to the potentially offsetting influences of both Jupiter and Saturn. Jupiter forms its closest aspect with Uranus at this time and opens the door for some upside. But at this time, Saturn is closing in on its almost equally close aspect to Neptune. This may well undermine any gains and could easily produce more downside. Monday’s Moon-Saturn conjunction would appear to begin the week on the bearish note. Thursday’s Sun-Saturn-Jupiter t-square also looks somewhat bearish although that is more of a wild card. Friday’s Sun-Jupiter aspect is more bullish. There is still a risk of some downside although it is nowhere as clear as I would like. A positive week is therefore also possible. The following week (Jan 23 -27) features the Mars retrograde station on the 23rd. This is generally a bearish measurement. Monday and Tuesday therefore tilt bearish as does Thursday on the Mercury-Saturn square. My expectation is that the Mars retrograde station will shake up the status quo a bit and increase volatility, assuming it has yet not occurred. Certainly, the market could lose its currently complacent state as soon as this week (Jan 9-13), but if it does not and stay in the current range, then the Mars station has a good chance of shifting the energy patterns. We could therefore have an extended down trend into early February and the Saturn retrograde station on the 7th. This is perhaps more likely if the market remains near its currently elevated levels into mid-January. Where the next bottom occurs is hard to say — perhaps somewhere between 1120 and 1180. By mid-February, the market should show signs of moving higher. Mid-March is a possible interim top around the Jupiter-Pluto aspect. Late March and April look quite bearish by contrast and we could see weakness last into June and July.
5-day outlook — bearish SPX 1230-1260
30-day outlook — bearish SPX 1150-1200
90-day outlook — bearish-neutral SPX 1200-1300
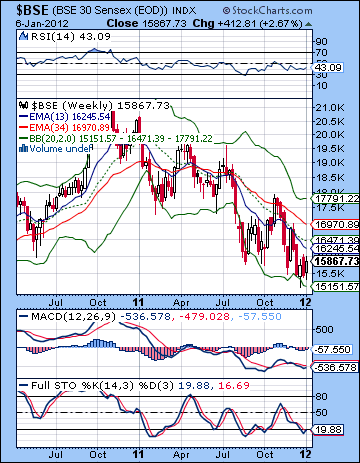
 Stocks rose to start the new year as European worries were briefly set aside in favour of improved growth prospects. The Sensex rose more than 2% closing at 15,867 while the Nifty finished at 4754. This bullish outcome was somewhat unexpected, although the early week gains did not come as a shock. I thought that there was a good chance to see some positive days in the first half of the week given Mercury’s entry into Sagittarius on Wednesday. Stocks surged one day before, however, on Tuesday. While the extent of the rise was unexpected, it was broadly in keeping with the planetary patterns that most of the gains should be confined to the first half of the week. And while the market eased up in the second half of the week, we really didn’t see much downside at all even with the apparently bearish Sun-Rahu aspect. Although disappointing, this bullish outcome does not fundamentally change my outlook for the market in the near term.
Even with the positive start to 2012, sentiment is still fairly cautious here as Europe remains a big question mark. There is little expectation that its problems will be solved any time soon. Private European banks remain reluctant to lend to each other and as a result are parking their overnight money in record amounts at near-zero interest at the risk-free ECB. More credit downgrades are likely to be forthcoming in the days and weeks ahead. To some extent, the market has already priced these in. But what hasn’t been priced in is the effects such downgrades will have on the bond market. If yields on EU sovereign debt continues to rise, then all bets are off. Stocks will take their cue from bonds and will sell-off, perhaps sharply. The fact that we are still in this quagmire is very much the result of Saturn’s ongoing opposition with Jupiter. Fear and caution are still seen as appropriate reactions to the current economic situation. While Jupiter (6 Aries) has been supported by its very close aspect with Uranus (7 Pisces), Saturn’s presence at 4 Libra has meant that the market is trapped and bulls cannot rally. In a sense, this ongoing tug of war between Jupiter (bullish) Uranus (bullish) and Saturn (bearish) has resulted in something of a stalemate where the market is trading at the bottom end of its recent range. Now the picture will be complicated somewhat as Neptune (5 Aquarius) enters the fray. In the company of Jupiter and Uranus, Neptune can be a bullish influence. But with Saturn insisting upon a certain level of caution on the proceedings, it is unclear to what extent Neptune’s arrival can alter the status quo. It may well act as a negative since it will actually form a closer aspect with Saturn than either Jupiter or Uranus. This four-planet alignment may well resist any serious rally attempts well into February, that is once Saturn has turned retrograde on 7 February.
 Last week was a sort of minimal bear market bounce that managed to break above the 20 DMA. To the bulls’ credit, the Nifty did manage to remain above the 20 DMA through Friday. That was a small victory of sorts. And yet until the Nifty can close above resistance at 4800, it would appear to be on shaky ground technically. The chart still looks quite bearish as all three moving averages are sloping down and are aligned bearishly. Friday’s intraday high ventured towards the upper Bollinger band but bulls could not sustain the upward move. This again suggests some skittishness and a willingness to cover long positions quite quickly. To be sure, MACD is in a bullish crossover. But RSI is still not over the 50 line and stochastics appears to be on the verge of a bearish crossover after a near-miss with the 80 overbought level.
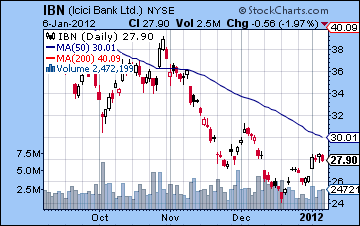
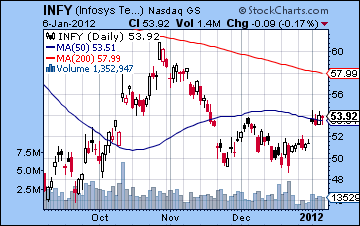
The Nifty remains in a rather neat downward-sloping channel dating back to its late-2010 high. Eventually it will form an interim low that sticks and that will set the stage for some kind of reversal. This will likely resemble an inverted head and shoulders pattern. This could even be strong enough to pierce above the 200 DMA at 5248. This longer term dynamic can be seen through the BSE weekly chart. The downtrend is confirmed by the bearish crossover of the 13 and 34 week EMA. Currently, we have seen the bottom Bollinger band tested as tentative rallies have ventured to the middle band. MACD is in a bearish crossover although we can spot a positive divergence with respect to the previous low. Stochastics are showing an early bullish crossover although it has yet to cross above the 20 line. Even if this crossover produces more upside, RSI is struggling here and is trying to put in a higher low. The banking sector continues to under perform here in light of the wider debt crisis in Europe. ICICI Bank (IBN) had a positive week but does not appear poised to move significantly higher. Perhaps the critical moment of truth will be if and when it encounters the 50 DMA which will be fairly close to its December high. Will bulls sell out or will buyers move in and propel it higher? A retest of the December 19 low may be another line in the sand going forward. Infosys (INFY) enjoyed a somewhat better week as it matched its December high and closed above its 50 DMA. A close below the 50 DMA and the December high would be quite bearish indeed and would suggest another retest of recent lows. On the other hand, if Infosys can maintain current price, it suggests that long positions may have further upside, perhaps to the 200 DMA.
 This week offers a mix of aspects that could take the market in either direction. The medium term aspects such as Saturn-Rahu and Saturn-Jupiter look bearish. In addition, Jupiter-Uranus is still close by and exerting a positive influence. But the short term aspects are more clearly bullish. Venus enters Aquarius on Monday and increases the likelihood for some upside on that day. Venus also figures prominently in the late week period. Venus aspects bearish Saturn on Thursday and then conjoins Neptune on Friday. The net effect of these Venus influences are uncertain, however. If anything, they suggest a larger than normal move but the direction is left open. I would tend to think that bullish interpretation will win out but I’m not sure about that. To make things even more interesting (and confusing) this Venus-Saturn-Neptune pattern sets up exactly on the ascendant of the horoscope of the BSE. This increases the likelihood of a big move. Again, it is not clear to me which direction it will go. Multiple planet aspects such as this can turn bullish, especially when Venus is involved. One scenario therefore would be mostly down in the first half of the week retesting support at 4600 by Wednesday and then back up to 4800 by Friday. I would not rule out a move above 4800 here but we should see at least some downward pressure from the Saturn-Rahu aspect this week. If Monday is higher on the Venus entry into Aquarius, then we could test 4800 then and then dip back to 4700 by Wednesday and then punch through resistance at 4800 by the end of the week. That would perhaps be the least surprising outcome. And yet, there are enough Saturn aspects here to make me cautious about the downside. It’s really a complex picture.
 Next week (Jan 16-20) looks mixed but perhaps less volatile. Monday could well start negatively on the Moon-Saturn conjunction. Tuesday is a toss-up while Wednesday looks more bearish as the Sun forms a square aspect with Saturn. This aspect could hit either Wednesday or Thursday. Friday looks more bullish as the Sun lines up with Jupiter. The following week (Jan 23-27) Mars begins its retrograde cycle with its station on the 23rd. Mars retrograde cycles are often bearish in their effects so caution should be exercised around this time. Some midweek gains are possible here, but the late week alignment with Mercury and Saturn-Jupiter looks bearish again. I would therefore expect this week to finish lower. As we move into February, the market should weaken initially, at least until the Saturn station on 7 February. Saturn commences its own retrograde cycle at this time when it is in a close aspect with Neptune, and, to a lesser extent, Jupiter. Since Jupiter will be moving away from Uranus at this time, there is a higher than normal possibility for a significant down move. I doubt the Nifty will fall to 4000 but it is possible. It may instead stay range bound between 4500-5000. We should see a more significant rally begin in mid-February that lasts until mid-March at least. This could easily challenge the 200 DMA and move higher. The market should begin to reverse lower again in late March or early April. Some significant weakness looks likely in June around the next Saturn station. A lower low is quite possible. Another rally is likely in July-September which should again challenge the 200 DMA. The last quarter of 2012 looks quite bearish, however. Lower lows are again possible, perhaps to 4000 and even lower.
5-day outlook — neutral-bullish NIFTY 4750-4850
30-day outlook — bearish NIFTY 4500-4700
90-day outlook — neutral-bullish NIFTY 4500-5200
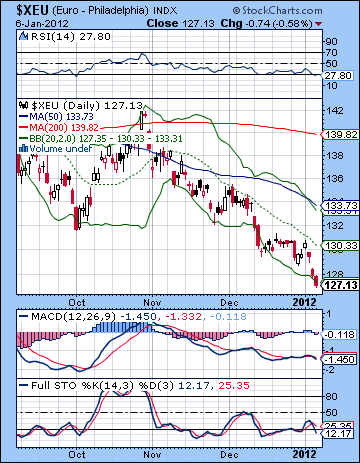 The Euro hit new lows last week as sovereign bond yields continue to inch higher amidst an ongoing banking crisis. The Euro closed below 1.28 for the first time since September 2010. The Dollar Index closed above 81 and the Rupee finished at 52.72. This bearish Euro result was very much in keeping with expectations as I thought the Sun-Rahu aspect would likely inflict some damage. As expected, most of the downside occurred in the second half of the week. The Euro is fast closing in on channel support here at 1.26. It could well reach there sooner rather than later. The Euro continues to hug the lower Bollinger band. After Monday’s failed attempt to re-capture the 20 DMA, the Euro is again headed south. It has even started a near bearish crossover in MACD and stochastics. Stochastics is oversold but when sentiment is this bad there is nothing to stop it from going lower. RSI is oversold at 27 and that may well draw in more buyers in the short term. At least it augurs somewhat favourably for a bounce. The weekly chart looks similarly grim although its RSI is fairly close to oversold levels (31) so it is possible that it is preparing for a substantial bounce at some point.
A significant bounce this week seems unlikely as Mars approaches its retrograde station on the 23rd. This is afflicted a few planets in the Euro horoscope so it is likely that we will see more downside here in the near term. We could see an up day on Monday as Venus enters Aquarius. The midweek could go either way, although I suspect it will tend towards bearishness. The end of the week is harder to call as Venus conjoins Neptune while in aspect with Saturn. This could go either way and indeed could generate some upside. However, the larger Saturn-Rahu and Saturn-Jupiter aspects make me less confident in this bullish outcome here. Perhaps we will have more of a mixed outcome. Next week looks mildly negative again with more downside clustered around the end of the week (19-20). Then Mars turns retrograde on the 23rd. This could introduce a fresh jolt of bearish energy and produce new lows. I would not rule out 1.24-1.26 by the end of the month or early February. Perhaps a more durable bounce is likely to begin by mid-February after Saturn has begun its retrograde station. I am expecting a strong rebound rally into mid-March at least. Depending on where we bottom out, this could easily retrace 50% from the breakdown at 1.40. So if we got as low as 1.24 then that would suggest a rally up to 1.32. Very doable I think. More weakness seems like from April to June, although it may be less catastrophic than what we have seen recently.
Euro
5-day outlook — bearish
30-day outlook — bearish
90-day outlook — bearish-neutral
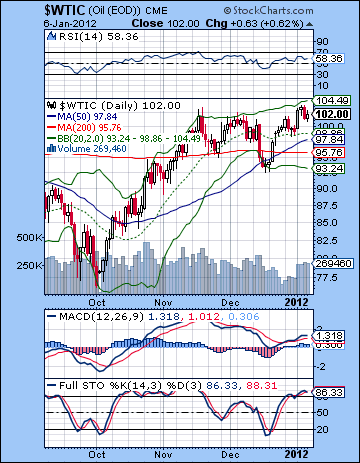 Crude oil rebounded strongly last week as improved growth prospects and ongoing tension with Iran pushed up prices. After trading above $104 midweek, crude finished closer to $101 for WTI. While I thought we might see some upside in the first half of the week, I didn’t quite grasp the extent of the rally. Also, while the late week was weaker as expected, the downside was very modest indeed. As a result, my bearish forecast was wide of the mark. I had been fairly unsure about crude in January as I had allowed for the possibility of some unexpected upside at various points in the month. Technically speaking, we did break above the October highs so that is quite bullish. However, we can spot a bearish rising wedge pattern which often have a habit of ending badly. But it’s not close to resolving itself yet so perhaps it has a while to go before it plays out. MACD is in a bullish crossover but is in a yawning negative divergence. Stochastics just formed a bearish crossover on Friday and is overbought. Support is now initially found at $100 just above the 20 and 50 DMA. Between those three lines, that is a lot of support that likely won’t crack on the first try. Resistance is offered by the upper Bollinger band at $104. There is really a no-man’s land between $105 and $112 so that could conceivably be bridged quickly in the event of some untoward development in Iran. Alternatively, it will take a fair bit to bridge that gap.
This week could well tilt bullish again for crude, although the picture is less clear than I would like. The bearish Saturn aspects are out there and could take the market down at any time. The problem is that they are medium term aspects and timing their effects is tricky. Meanwhile the short term aspects look more positive. Venus figures prominently as on Monday, Venus enters Aquarius. This could well correlate with gains. The midweek looks less positive, however, so some pullback is more likely then. Thursday may also be negative on the Venus-Saturn aspect and the Sun-Mars aspect. In addition, the Mercury-Pluto conjunction brings extra pressure to bear. But Friday’s Venus-Neptune conjunction could well spark another significant up day. It’s a tough call since Saturn will still be close at hand and part of this larger alignment. For this reason, I would not rule out a sharply higher end to the week, nor a sharply lower one either. While I would favour a net positive outcome for the week, I would be open to all outcomes here. Next week is another possible candidate for some upside as Jupiter forms its exact aspect with speculative Uranus. Saturn may exert a drag on the amount of upside here, but we could easily see another positive week. If we have moved higher until Jan 23, then there is a greater chance this uptrend will end once Mars changes direction on the 23rd. This is a potentially important reversal point. Another important date to watch is 7 February when Saturn begins its retrograde cycle. This is another potential change in energy that could reverse crude’s fortunes. If it has been strong through much of January, then the odds increase for a significant correction in February. If we see more downside starting in January, then I tend to think that February will see a continuation of this downtrend.
5-day outlook — neutral-bullish
30-day outlook — bearish
90-day outlook — bearish
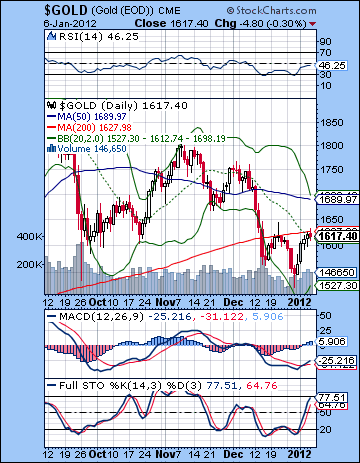 Gold rebounded strongly last week as it climbed 4% closing near $1620. While I thought we might see more late week downside, this rise was not hugely unexpected. The early week did seem mostly bullish on the Mercury entry into Sagittarius. Unfortunately, I somewhat underestimated the extent of the up move, even if it was only a technical bounce. The late week Sun-Rahu aspect did correspond with a mild pullback on Friday but it was pretty modest, especially in light of the preceding advance. Gold has climbed back to an important resistance point at the 200 DMA. This also happens to be its 20 DMA so that is an important line in the sand for gold. This resistance level is roughly the same as the previous support level dating back to September and October. So we can surmise it will be tough to get much above current levels. Stochastics has climbed up to 77 and is on the verge of being overbought. Once above the 80 line, any signs of a bearish crossover may bring out the sellers in force. The next level of resistance would likely be around the 50 DMA at $1689 which also happens to be very close to the falling trend line off the August high. Support is still around $1550 although if gold turns tail at current levels, then it would likely break below previous lows and explore the sub-$1500 area. $1450 is the next solid area of horizontal support.
This week looks more mixed for gold. Monday could begin bullish as Venus enters Aquarius. This increases the likelihood that gold will close above its 200 DMA. Tuesday may also tilt bullish but it is less probable. Actually, there is a chance we could fall hard at some point this week due to the Saturn influences at work. Perhaps the midweek is more likely for this negative outcome, with perhaps Thursday somewhat more obviously negative on paper than the other days. But the end of the week features a couple of strong patterns that could well propel gold higher. Venus conjoins Neptune and the Sun is in aspect Mars. While I think these will produce a bullish result, there is a significant chance that the result will be negative. In any event, a big move is possible here. I think gold is due to decline again but I’m not sure it can happen this week. We may have to wait until next week or the week after when Mars turns retrograde on the 23rd. So it is quite possible gold could move up to test its 50 DMA before coming back down to earth. A better chance for a down move looks like between Jan 23 and Feb 7 or after. Saturn turns retrograde on 7 February and it is a frequent marker of reversals and turn dates. Gold should attempt another substantial rally in February that continues into March. Another sharp sell-off looks likely in April.
5-day outlook — neutral-bullish
30-day outlook — bearish
90-day outlook — bearish

