

(6 March 2025) Synopsis: This study measures the effect of Mercury retrograde on the stock market. Despite the negative connotation to the Mercury retrograde period, this study of 79 cases from 2000-2024 found that the 24-day retrograde cycle and the extended 54-day shadow retrograde period were only modestly bearish for stocks. Moreover, much of the average relative bearishness of Mercury retrograde may be attributed to just two cases — the fall 2008 financial crisis and the 2020 Covid crash. (N.B. This study was simultaneously posted on my Empirical Astrology Substack.)
Introduction
 Mercury retrograde is one of the most well-known concepts in astrology. Even among the wider public, Mercury retrograde (“Rx”) is known as a time when all manner of things can go wrong: appointments are missed, trains are delayed, emails go missing, the power goes out, or websites go down. ‘Expect the unexpected’, is commonly seen as the appropriate watchword as Mercury Rx creates an atmosphere of unreliability, uncertainty and confusion. Despite its wide acceptance as a foundational principle of astrology, I’m not aware of any systematic study of its real-world consequences that validates this view. It is unknown the extent to which this is actually true or if Mercury retrograde is just a convenient superstition to explain the normal vicissitudes of life.
In financial astrology, the retrograde cycle of Mercury carries a similarly negative bias. It is widely believed that stocks become more vulnerable to declines during its 24-day retrograde cycle as its apparent backwards movement in the sky is seen an aberration from its normal forward motion. This risk is often strongest around the time of its retrograde and direct stations when Mercury’s apparent speed briefly falls to zero and it reverses its direction. The periods near stations are regarded as particularly volatile since the near-zero velocity of Mercury can lengthen the duration of alignments with other planets. The longer-lasting alignments can thus produce larger fluctuations in stock prices, especially if if the alignment involves malefic planets such as Saturn and Mars.
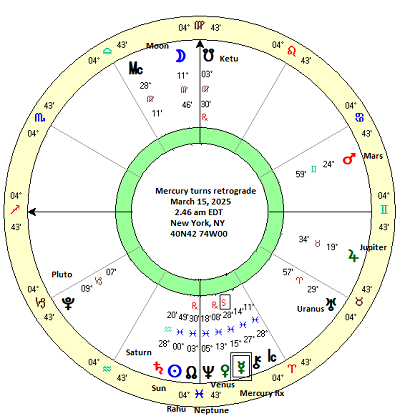
Evaluating the effect of the Mercury retrograde period is worthy of study because the ‘winged messenger’ planet is in this backwards condition about 20% of the time. Mercury has three or four retrograde cycles per year with each cycle lasting about 22-24 days. The next Mercury retrograde cycle is due to begin on Saturday, March 15 when it stations retrograde at 15 degrees of sidereal Pisces (=9 degrees of Aries in the Tropical zodiac). Mercury will remain in retrograde motion from March 15 until April 7, when it stations direct at 2 Pisces (=26 Pisces Tropical).
Hypothesis
The purpose of this study is to investigate the effect of Mercury retrograde on the stock market. My central aim is to test the idea that the Mercury retrograde period coincides with stock market declines. This general notion can be analyzed in terms of 1) the immediate effects on prices after the retrograde station and 2) the effect of the 24-day Mercury retrograde period, as well as any other patterns in price trends before the Rx station and after the direct station (DS). If there is a measurable effect, it should show up across a large enough sample size using sequential time intervals before and the after the stations.
Method
Using the same method as my previous Venus retrograde study, I employed a series of time intervals in order to track the closing prices of the Dow Jones Industrial Average (DJIA) across the duration of the Mercury retrograde cycle. The first time interval used was 15 days (“-15dr”) before the retrograde station (RxS), which was then followed by 8-days before(“-8dr”), 6 days before (“-6dr”), 4 days before (“-4dr”) and 2 days before(“-2dr”). A similar sequence is used to measure the change of prices during the retrograde cycle (2dr, 4dr, 6dr, -6dd, -4dd, -2dd, DS/0dd) and after the culmination of the cycle and the return to normal forward motion after the direct station (DS). In all, I constructed an inclusive sample of the last 79 Mercury retrograde periods from 2000-2024. In future, I hope to double the sample size by including the preceding 1965-2000 period that is available in the Trading View database.
I chose the 15-day interval before the Rx station as first time point (=”T-0″) since it approximates the shadow period of Mercury retrograde. Thus, Mercury’s position 15 days before the Rx station roughly equals its position at the culmination of its retrograde cycle when it stations direct and resumes normal forward motion.
One possible objection to the time interval approach is that it omits consideration of shorter term declines that may only occur on an intraday basis. For example, on the day of a Mercury retrograde station, stocks could move lower at first but then rebound by the close of trading that day or perhaps on the next day. Since I am using 2-day intervals to measure price changes, this kind of short term fluctuation would not be accounted for. This is a valid criticism. However, for practical purposes, it is difficult to use shorter time intervals as it greatly increases the time required during the data input phase. I therefore settled on 2-day increments as a compromise since the increments are short enough to reflect sudden changes if they occurred. My thinking was also that if the effect of Mercury retrograde was strong enough it should show up using these fixed 2-day incremental time intervals. If there was no measurable effect using incremental 2-day intervals, then that would be a reason to question the validity of the bearish hypothesis.
Results
The table above shows the closing prices for the Dow Jones Industrials and the table below shows the aggregate percentage change across different time intervals for all 79 cases of the Mercury retrograde cycle. The intervals in the second table deserve some explanation. The first column on the left labeled "RxS DS" is the percentage change across the whole 24-day Mercury retrograde cycle, from retrograde station until direct station. This is the most important interval as it forms the basis of the Mercury retrograde argument. The second column labeled " -15dr 15dd" is the extended Mercury retrograde cycle which includes the two 15-day "shadow" periods before and after the retrograde cycle. A shadow period is defined as the time in which Mercury traverses the same arc as its retrograde cycle. This occurs during the 15-20 day approach towards the retrograde station and again in the 15-20 days following the direct station. Some astrologers believe that these shadow periods may also be subject to the same vulnerabilities as the core Mercury retrograde cycle itself.
The third column labeled "-15dr 0dr" isolates this first shadow period and is the percentage change during the 15 days leading up to the retrograde station only. The fourth column labeled "0dd 15dd" is the second shadow period and is the percentage change during the 15 days after the direct station when Mercury resumes its forward motion. The fifth column labeled "-15dr DS" is the percentage change from 15 days before the retrograde station until the direct station, approximately 37-39 days later. This time interval includes the entire retrograde cycle. The sixth and final column labeled "RxS 15dd" measures the percentage change from the day of the retrograde station until the completion of the second shadow period ("15dd"). This interval also has a duration of about 37-39 days and includes the entire retrograde cycle.
The overall effect of the whole retrograde cycle is seen in the results of the first column ("RxS DS"). The bottom of the chart shows the average percentage change across all 79 cases is -0.41%. This negative result is made more significant since the expected value for any 24-day period is 0.47%. We should note that all the expected values are positive since the stocks tend to increase their value over time. The expected values were calculated with the assumption of a 7.2% average annual return. On the face of it, this looks like a confirmation of the bearish bias hypothesis since returns were net negative across all the cases studied. While the effect is fairly small, it is almost a full percentage point below the expected value.
However, a closer look at the bottom of the table reveals something else. The number of negative cases ("#Neg") is only 36 out of a total of 79 -- a bit less than half of the cases. Even if Mercury retrograde is on average bearish, it actually coincides with positive market returns 55% of the time. Part of the explanation for this lopsided result is that two of the largest declines in recent history have occurred during Mercury retrograde cycles: the fall 2008 meltdown (-20%) and the 2020 Covid crash (-18%). I have highlighted these cases in bold in the table. This doesn't negate the potentially bearish effect of Mercury retrograde since it matters that the two biggest declines in the past 20 years both occurred during Mercury retrograde. It may well be a bearish influence, even if we obviously cannot attribute those declines to Mercury retrograde alone. In those particular declines, other alignments involving Saturn and the lunar nodes were more important. And yet if those two cases are omitted from consideration, most or all of the average negative effects disappear. The combined negative percentage is -38 for those two cases, while the total negative percentage for all the 79 cases is only 32. (-0.41% x 79 = 32)
Other time intervals show a similar pattern. The extended retrograde cycle including shadow periods ("-15dr 15dd") is a bit more bearish (-0.60%) but not decisively so. It is much the same story if we include just the first or second shadow period alone as in the last two columns. The average is negative (-0.53%, -0.47%) but it is about the same size decline as the 24-day retrograde cycle.
Now let's think a bit more strategically in a way that a trader might. By reducing the time intervals to 2-days, this third table ("DJIA % change before and after Mercury retrograde station") follows the incremental price sequence during the first 15-day shadow period and then for 6 days after the retrograde station. If traders sold short at the time of the retrograde station hoping to capture a decline in prices, would this be profitable? Not on average. The column labeled "0dr 2dr" (in bold) measures the percentage change in the two days immediately following a Mercury retrograde station. As we can see, this is actually a bit positive (0.02%) and shows no appreciable difference from the preceding columns during the approach of the retrograde station. The number of negative cases ("#neg") is 38 and is also about what chance would expect. The results only begin to show a more negative average result (-0.21%) in the far right hand column which measures the percentage change between the retrograde station and prices 6 days later. ("0dr 6dr").
While experienced traders might be able to maximize their returns with careful use of stop losses which omit consideration of positive cases, it seems clear that the Mercury retrograde bearish reversal strategy does not deliver robust results.
Conclusion
So is Mercury retrograde bearish for stocks? On average, it is bearish, albeit only modestly so, and only in this relatively small 79 case study. But it is important to note that the aggregated results are bearish only because of unusually large declines in 2008 and 2020 which took place while Mercury was retrograde. Without these cases, the average return would be close to zero, although that would still relatively underperform the expected return of stocks given their long term bullish bias.
As we saw with the Venus retrograde cycle, there can be wildly divergent outcomes during the Rx period. It's not just that stocks are neutral or slightly bearish, but that stocks can be very bearish or very bullish during the retrograde cycle. But are these divergent outcomes evidence of totally random outcomes? It's certainly possible but it is worth investigating the alternative hypothesis that retrograde cycles may also signal a change in trend, either higher or lower. There was some evidence for this reversal hypothesis in the Venus retrograde study once we disaggregated the cases according to prior price trends before the retrograde station.
Therefore, we need to conduct the same study on the Mercury retrograde cycle which separates cases into two batches: potential bullish reversals and potential bearish reversals. This is what we will attempt to do in Part 2 of this study which I will upload in the next few days.
