
![]() (23 March 2025) Markets bounced back last week following the Mercury retrograde station on Saturday, March 15. This reversal confirmed our thesis that Mercury retrograde stations tend to coincide with reversals in the prevailing price trend. Since stocks had generally been bearish heading into the retrograde station, our study suggested there was a 60-70% chance of a meaningful bullish reversal in the days following the station. So far, this has been the case.
(23 March 2025) Markets bounced back last week following the Mercury retrograde station on Saturday, March 15. This reversal confirmed our thesis that Mercury retrograde stations tend to coincide with reversals in the prevailing price trend. Since stocks had generally been bearish heading into the retrograde station, our study suggested there was a 60-70% chance of a meaningful bullish reversal in the days following the station. So far, this has been the case.
The transits this week offer some support for a continuation of the rebound. The early week may be less favourable, however, as the Sun conjoins retrograde Mercury on Monday. This is often a negative influence, although it should not be considered a high probability bearish influence. At the same time, Mars squares Chiron, albeit not will its full-strength 90-degree Vedic aspect but rather its weaker 270 degree square. Nonetheless, it is exact and should be considered as a potentially negative influence on sentiment.
However, the outlook may improve as early as Tuesday as the Moon aligns with Jupiter and Venus approaches its conjunction with Neptune. With Venus traveling more slowly due to its retrograde motion, its conjunction with Neptune will be more protracted and thus more bullish. The exact Venus-Neptune conjunction occurs on Thursday.
Saturn-Rahu conjunction
Looking ahead, we can see that Saturn is approaching a conjunction with Rahu, the North Lunar Node. It is currently 4 degrees from its exact conjunction. The combination of these two malefic planets raises the possibility of a market decline. So we must ask the empirical question: are Saturn-Rahu conjunctions actually bearish?
The answer seems to be: it depends. Since they move very slowly — Saturn about 1 degree per month and Rahu about 1.5 degrees per month backwards — they only form conjunctions every 11 or 12 years. This makes a systematic study of its effects more difficult. Over the past 60 years for which data is readily available, there have only been 5 such conjunctions, in 1968, 1979, 1991, 2002 and 2013. Taken together, the data do not show any clear patterns. Stocks rose in the 30 days leading up to the 1968 conjunction, but were mostly flat at the 1979 conjunction. Prices were fairly flat in 1991 leading up to the conjunction but rose by 5% starting just before the conjunction and continued to rally strongly thereafter. Conversely, the 2002 conjunction was bearish both before and after the conjunction with prices falling by 5%. When Saturn and Rahu conjoined in 2013, stocks were fairly choppy both before and after although prices did post a 4% gain across the entire 60-day time period that spanned the conjunction (30 days before and 30 days after). The longer 60-day window for the 1968 and 1979 conjunctions was also bullish, although the period close to the exact conjunction was similarly choppy. While this bullish tendency across the 60-day window occurs in 4 out of 5 cases, we should be cautious about drawing any conclusions given the tiny data sample.
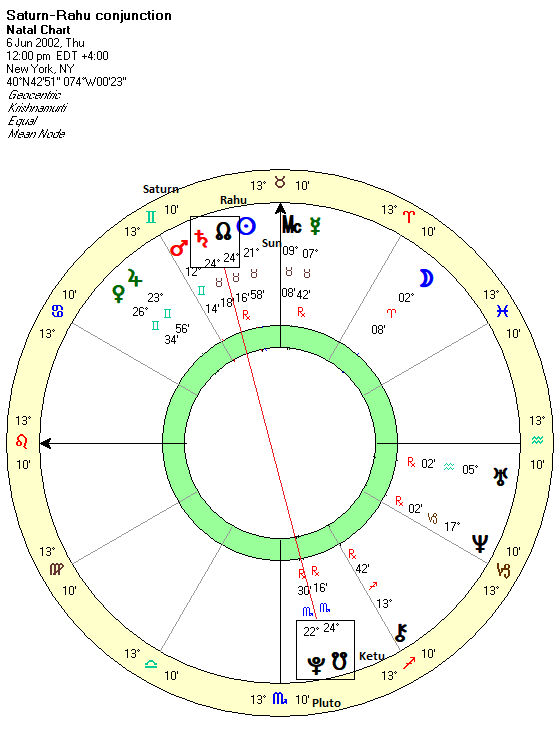
The two cases that stand out are the 1991 bullish outcome and the 2002 bearish outcome. How can we account for this divergence? Looking more closely we can see an important difference: in the 2002 bearish case, the Saturn-Rahu conjunction occurred opposite Pluto. This opposition aspect is typically seen as a negative influence for markets. While the conjunction with the Sun could be a plus, the presence of the ongoing oppositional alignment with malefic Pluto makes gains much less likely.
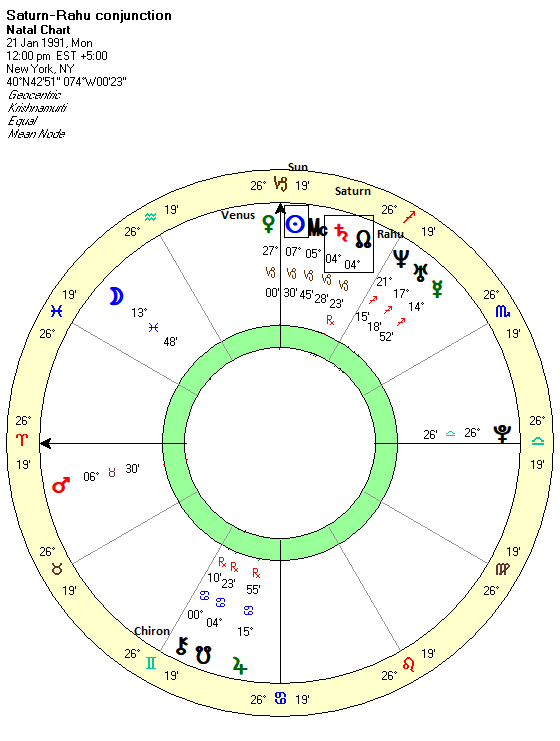
For the 1991 conjunction, Saturn-Rahu is closely conjunct the Sun and widely conjunct Venus. This is arguably a more positive influence, even if the Sun and Venus are past their exact alignment. Moreover, there are no tense alignments with malefic planets such as Pluto. True, the Saturn-Rahu conjunction is opposite Chiron but Chiron is less malefic than Pluto when in opposition. The opposition is also wider and thus weaker — 4 degrees — compared with the closer 2 degree opposition with Pluto in 2022. While the 1991 conjunction chart is not obviously bullish, it is clearly less bearish than the 2002 chart. This is a reminder that the position of third and fourth planets are also important when considering the impact of single two-planet alignments.
The 2025 Saturn-Rahu conjunction
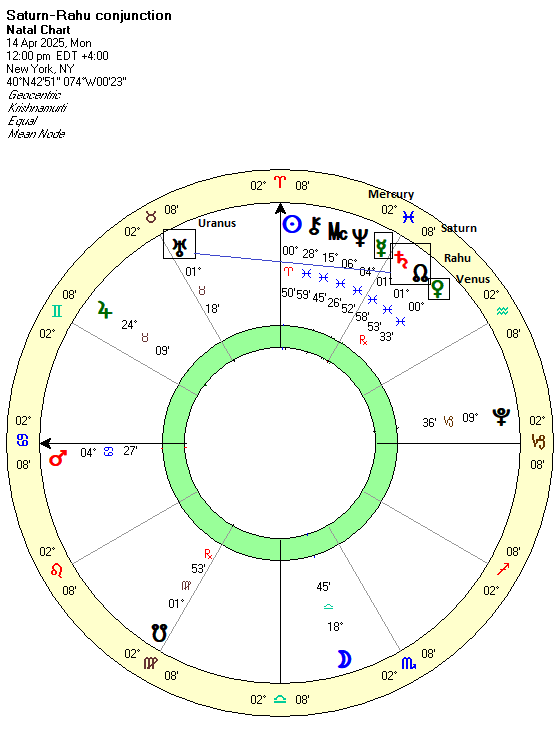
Returning to 2025, Saturn and Rahu (mean lunar node) will form an exact conjunction on April 14. Given the relatively slow speed of both planets, they are now just 4 degrees apart. It is possible that they may already be influencing sentiment. We are now inside the 30-day interval before the conjunction and will move into the 20-day interval before the 0 degree conjunction on Tuesday, March 25. What’s noteworthy about the planetary pattern in early and mid-April is that both Mercury (Apr 7) and Venus (Apr 12) will station direct very close to the point of conjunction at 1 degree of Pisces. And Uranus (1 Taurus) will form a constructive 60-degree alignment with Saturn-Rahu at the same time. These do not seem like negative influences given the planets and aspects involved. In fact, the Venus and Mercury influences are more strongly positive. Therefore, the upcoming Saturn-Rahu conjunction is more likely to deliver positive market outcomes across the 10-day, 20-day, 40-day and 60-day time intervals.
Of course, we should always keep in mind that this individual case study of Saturn-Rahu conjunction is based on only a handful of cases. I will post a larger study next weekend that includes other significant Saturn-Rahu alignments of 60, 90, 120 and 180 degrees. The resulting dataset will be comprised of 46 cases. While these may not be exactly analogous to the conjunction in terms of outcomes, they nonetheless represent the blending of the energies of Saturn and Rahu. If there is a clear pattern, we should be able to see it.
