

Introduction
 (30 March 2025) As discussed last week, the approaching conjunction of Saturn and the North Lunar Node (or Rahu, as it is known in Vedic astrology) is a good opportunity to review the evidence of its potential impact on investor sentiment. Since both Saturn and Rahu/NLN are considered malefic planets, their conjunction on April 14 would seem to carry an elevated risk of a market decline. But does the historical evidence support this bearish view of Saturn and Rahu?
In trying to answer this question, the most immediate problem is the lack of data. The Saturn-Rahu conjunction only occurs every 11 or 12 years and thus we could only compile a tiny dataset of 5 cases in the 60-year Trading View. The first part of this study found that these cases had a modest bullish bias overall, although there were hugely divergent outcomes based depending on other factors. The challenge is to find a way to see if this bullish bias holds across a larger sample.
One possible workaround for the data scarcity problem is to expand the criteria to include other alignments besides conjunctions. There is a rationale to include other non-conjunction aspects since many astrologers recognize Rahu and Ketu’s 120 degree aspects. Also, Saturn’s traditional Vedic aspects also include a full-strength forward 60-degree aspect and a full-strength 180-degree opposition aspect and full-strength 270-degree forward square aspect. For their part, many Western astrological traditions are more generous in counting aspects and often recognize aspects comprised of all multiples of 30-degree angular separation.
Therefore, in order to increase the number of cases, I decided to include all aspects of 60, 90, 120, 180, 270 degrees in this study. One obvious objection to this approach is that the Saturn-Rahu conjunction need not have the same effect as other aspects. That is very true since conjunctions are often seen as purer expressions of the combination of planetary energies. And yet other two-planet combinations tend to exhibit similar effects no matter the aspect. Thus the Sun-Jupiter 0 degree conjunction tends to be positive in its effects, just as the Sun-Jupiter sextile (60-degree) or trine (120-degree) aspects tend to bring positive results. To be sure, the hard aspects (90, 180 degrees) are seen as a sub-category which can have different outcomes from other aspects, but I would argue that the combination of planets retains an inherent quality that derives from the planets themselves rather than the size of their angular separation. Nonetheless, I acknowledge this is a plausible objection to grouping all the aspects together. Any findings must therefore be interpreted with extra caution.
Method
In order to examine the potential effect of the Saturn-Rahu alignment on financial markets, I wanted to see how stock prices fluctuated as 1) the aspect approached, 2) became exact and then 3) separated. If prices tended to rise across any of the intervals, that would suggest a bullish effect, while falling prices across intervals would indicate a bearish planetary influence. I recorded the closing prices of the Dow Jones Industrial Average (DJIA) at 10-day intervals both before and after the exact aspect. Given the relatively slow velocity of Saturn and Rahu (North Lunar Node), I chose intervals of 10 days as a reasonable compromise that was large enough to reflect changes in planetary positions but small enough to indicate the relative importance of proximity. As a general rule of thumb, the angular separation of Saturn and Rahu changes about 1.5 degrees every 10 days, not including any retrograde Saturn periods. The first time interval of 30 days prior to an exact alignment was selected to reflect a 5-degree orb, which enjoys fairly widespread use in Western astrology. (An “orb” is considered to be the effective range of an aspect between two planets).
Closing prices were therefore recorded 30 days before the exact aspect (-30d), 20 days before (-20d), 10 days before (-10d), the day of the exact aspect (0d), 10 days after (10d), 20 days after (20d) and 30 days after (30d). Price were then compared across various intervals. The first three columns in the % change table compare changes in price during the approaching phase of the aspect as Saturn nears its exact alignment with Rahu for all alignments (0, 60, 90, 120, 180). These are labeled “-30d 0d”, “-20d 0d” and “-10d 0d”. The next three columns measure the changes in price during angular separation after the moment of exact alignment. These are labeled “30d 0d”, “20d 0d”, “10d 0d”. The last three columns measure price changes straddling the day of the exact alignment using different starting and stopping points. These are labeled “”-10d 10d” for the shortest 20-day time window around the exact alignment, and “-20d 20d” for the 40-day window, and then longest 60-day time window is labeled “-30d 30d”. This measures the price change from 30 days prior to the exact aspect to the price 30 days after the exact aspect.
Results
In this sample of 46 Saturn-Rahu/NLN aspects from 1965 to 2023, stocks were generally bullish across most time intervals. Prices rose in the time leading up to the exact aspect, with an average gain of 1.62% for the 30 days preceding interval (see first column, “-30d 0d”). This was significantly larger than the expected outcome of 0.60%, based on an average annual gain of 7.2%. Stocks also had a bullish bias during the period that followed the exact aspect, as the 30-day period of aspect separation saw a 0.90% gain. While this was a bit less than the preceding window, it was nonetheless greater than the expected value of 0.60%. The entire 60-day window (see last column, “-30d 30d”) was even more bullish with an average gain of 2.51%. The median gains were similarly bullish across all possible intervals and the number of positive results was also greater than 50% across all intervals. So however much we might have expected to see Saturn-Rahu/NLN alignments as bearish, the evidence suggests the opposite is true.
Let’s see if we can determine which aspects are most bullish. If we disaggregate the results by angle, there is a clear divergence. Using the longest time window (-30d 30d, the last column on the right), the 0-degree conjunction, 120-degree trine and the 180-degree opposition correlate with more positive outcomes. The 0-degree conjunction saw an average gain of 4.46%, almost four times greater than the expected value of 1.20% based on long term historical averages. However, we should make special note of the fact that there was a slight bearish bias of -0.32% in the 10 days leading up to the exact conjunction (“-10d 0d”). This could be particularly relevant now ahead of the next April 14 conjunction as it could suggest some volatility in the first half of April.
The 120-degree trine aspect saw an average gain of 4.45% across the same 60-day window (“-30 30d”). No evidence of anything bearish here at all. This also corresponds to the full-strength Rahu aspect to Saturn that is often used in Vedic astrology. Even if Rahu has a poor reputation, it is nonetheless a materialist planet which can bring positive results when other conditions obtain.
Somewhat surprisingly, the 180-degree opposition alignment coincided with the largest gain of all, at 5.85%. In Western astrology, oppositions are supposed to be difficult influences. This positive result would appear to undermine that view. It also bears mentioning that the Saturn-Rahu opposition is in fact a Saturn-Ketu conjunction.
By contrast, the 60-degree sextile and 90-degree square aspects were more bearish. For the 60-degree alignment, all time intervals were negative except for the 30d 0d interval which posted just a 0.01% gain. The 20-day window (“-10d 10d”) was especially bearish with an average decline of -1.46%. Clearly, this is a very divergent result compared with the positive alignments outlined above. One possible explanation is that Saturn has a full-strength 60 degree aspect which may actually be more malefic than its other aspects when associated with Rahu.
The 90-degree square aspect is also somewhat negative although less so than the 60 degree alignment. The period leading up to the exact alignment is actually bullish with the first column (“-30d 0d”) posting an average gain of 1.40%. Interestingly, the mirror period (“30d 0”) following the exact square alignment was bearish (-1.21%). The overall 60-day window of the furthest right hand column (“-30d 30d”) was almost flat — just a 0.18% gain. Nonetheless, this was significantly less than the expected value of 1.20% and thus this 90-degree alignment should be considered a bearish influence.
Conclusion
The small study suggests that Saturn-Rahu/NLN alignments may not be as negative as many believe. Some alignments like the conjunction, trine and opposition are actually bullish and produced average outcomes that clearly exceeded the long term expected outcomes.
While the overall average influence of this pairing was bullish for stocks, our results show that aspects may matter more than intrinsic planetary qualities. The 60 and 90-degree alignments produced decidedly below average results across the 22 relevant cases. While these alignments may not be sufficiently bearish to warrant selling one’s portfolio ahead of time, they offer some evidence for caution during the time period of their effective range. And as I showed in the first part of this study, each case is best evaluated holistically by taking into account all relevant influences from other planetary aspects.
In terms of the approaching Saturn-Rahu conjunction on April 14, this study suggests that stocks may be somewhat bullish. This is perhaps surprising as stocks have remained under pressure in recent weeks. Last week’s decline abruptly negated the preceding rebound that had followed the Mercury retrograde station on March 15. That said, further downside is possible over the next two weeks as that period immediately before the exact aspect carries some downside risk. But overall, there is a decent chance (67-80%) for gains based on the 60-day time window. For the current conjunction, that would extend from March 14 until May 14. Obviously, for a time window that large, some additional downside is very possible in the short term. But it does suggest that dips are more likely to be bought which would enable the market to recover in April and May.
Extrapolating for the S&P 500 and the DJIA, this would mean a move from the March 14 close of 5638 to 5779 by May 14, based on an average gain of 2.51% for the all-aspect dataset. Using the much smaller dataset of conjunctions, the average 4.46% gain would equate to a price of 5889 by May 14. For the DJIA using the March 14 base price of 41,488, this would translate to 42,529 by May 14 for the larger sample size 2.51% gain and 43,338 using the smaller conjunction sample of the 4.45% gain.
Obviously, this is highly speculative and more a thought experiment than anything else as there are many more variables that would need to be considered for a proper projection. But it does give an idea of the scale of the possible influence of the Saturn-Rahu/NLN conjunction over the coming weeks.
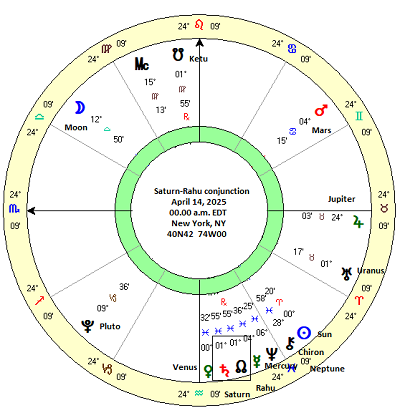
One major complicating factor to the upcoming Saturn-Rahu conjunction is that it will be conjoined by Venus and Mercury. These are both bullish planets by nature, although their association with malefics like Saturn and Rahu complicate the picture somewhat. Nonetheless, it is difficult to say that the presence of Venus and Mercury makes the outlook worse. And given their positive natural qualities, it increases the odds for a more favourable outcome.
