 (23 October 2024) As I noted in a previous study of the Sun-Mars square, financial markets offer a unique opportunity to assess the effects of planetary alignments on collective human sentiment. The ups and downs of the stock market can be a useful shorthand to determine the influence of the planets. In astrological theory, the transits of malefic planets like Mars are said to bring troubles and conflict into our lives. While it is possible to test this assumption in the charts of different people, it is easier to see how it may or may not be working on the stock market since we do not need to make reference to a birth horoscope. We simply need to be able to see if the major transit alignments of Mars are correlated with declines, and if so, to what extent. Systematic statistical analyses can provide clearer evidence for the validity of astrological principles both as they pertain to financial markets, and to life in general.
Here we are analyzing the effect of Mars-Pluto oppositions. Not only is Mars considered malefic, but Pluto is also seen as somewhat negative in its effects, especially when in hard aspect to another malefic planet. By “hard aspect”, we mean the conjunction (0 degrees), the semisquare (45/135 degrees), the square (90 degrees) and the opposition (180 degrees). These are aspects commonly used in Western astrology, although they correspond with conjunctions and oppositions in various varga charts in Jyotish.
As in the previous study, we will be measuring the price impact at different points of the alignment. As a rule of thumb, the maximum affliction is said to be when the opposition is exact, with lesser effects both before and after exactitude. My default assumption is that strongest negative effects are felt in the lead-up to the exact opposition and then begin to fade shortly thereafter. Assuming the standard velocities of Mars and Pluto, the first time measurement 30 days before the exact opposition corresponds with a 15 degree orb, with the 10-day window corresponding to a 5-degree orb, and the 5-day window about 2.5-degree orb. With the Mars-Pluto opposition occurring about every 2 years, the 60-year database of the Dow Jones Industrial Average in Trading View yields 33 data points. Not big enough to claim statistical significance, but big enough to provide useful information that could be the basis for further study.
The effect of the Mars-Pluto opposition
The data largely confirms our expectations that the 180-degree separation of Mars and Pluto tends to be negative for stock prices. The largest effects occurred in the 10-day window before the exact opposition (-0.59%) and the 20-day window that spans 10 days before and 10 days after the opposition (-1.18%). These two measurements yielded the most negative results, especially in comparison with the positive expected values of +0.2% and +0.4%, respectively. The 20-day window before and after the opposition was negative 20 times out of 33 (61%), while the 10-day window leading up to the opposition yielded negative returns 19 times out of a total of 33 (58%).
While this is a stronger negative correlation than the Mars-Sun square, it is still quite modest. And yet with the recent weakness in US stocks the past three days (Oct 21-23), it is interesting to consider any additional impact as we approach the next Mars-Pluto opposition on November 3. The most bearish window (10 days before the opposition) begins tomorrow, October 24, and continues until November 13. Could there be more downside ahead as a result of the approaching opposition? It's quite possible, although with the effect sizes so small it is hardly enough to base a prediction upon. But it nonetheless suggests that some caution is warranted in the coming days, especially given the highly-contested US election which takes place on Nov 5.
Mars Rx: a repeat of 2007-2008?
We should also take special note of a peculiarity in the data. Usually, the Mars-Pluto opposition occurs with Mars moving forward and Pluto in the midst of its retrograde cycle. However, occasionally this pattern changes. It is part of a larger pattern comprised of two or three anomalous pairings. These anomalous pairings begin with both Mars and Pluto direct, then depending on the specific case, Mars is retrograde and Pluto is direct, then concluding with both Mars and Pluto direct again. After that, the regular pairing of a direct Mars and retrograde Pluto resumes.

This anomalous pattern last occurred in 2007-2008, and before that 1989-1990 and before that 1971-1973. However, the 1989-1990 and 1971-1973 exceptions occurred without Mars retrograde during a Mars-Pluto opposition. In those cases, only two of the double direct oppositions of Mars and Pluto occurred without any intervening Mars Rx-Pluto D pairing. These anomalous patterns also shared an especially negative outcome in the second and third parts of the pattern (i.e. Mars Rx-Pluto D and the second Mars D Pluto D). The first instance of the Mars direct and Pluto direct opposition was positive in all three cases.
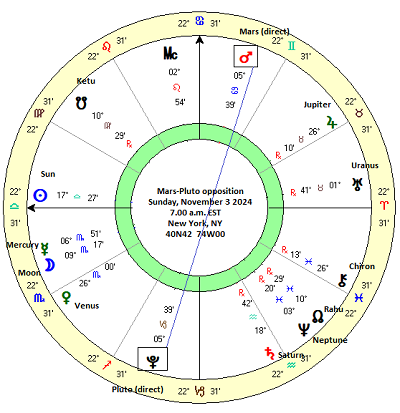
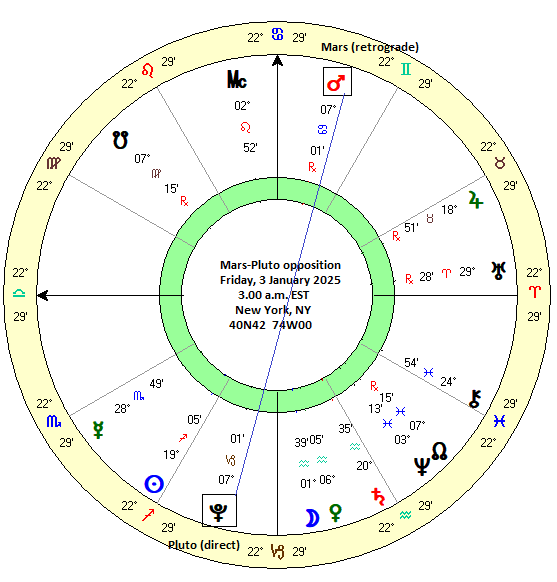
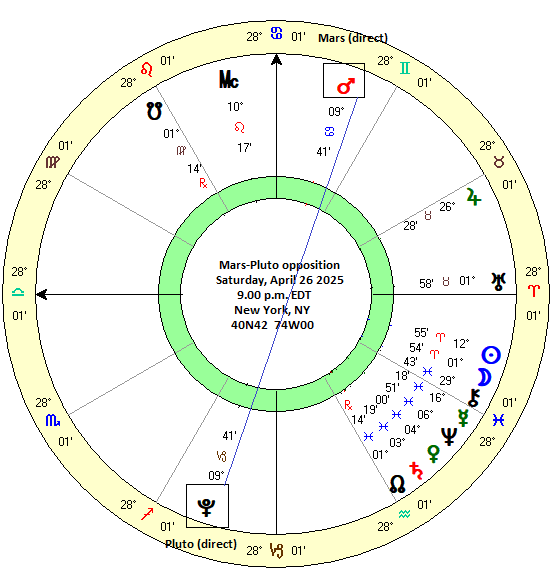
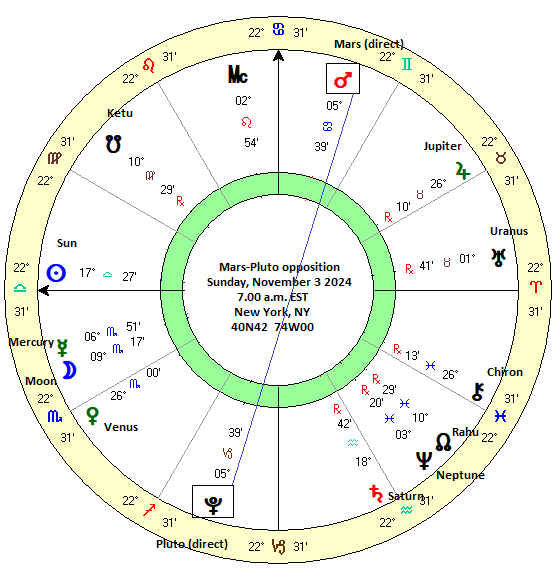
What is noteworthy is that the next sequence of Mars-Pluto oppositions will also be one such anomaly whereby the first opposition is a double direct pairing (on Nov 3) which is then followed by a Mars Rx and Pluto D pairing, (Jan 3, 2025) and finally another Mars D Pluto D pairing on April 26, 2025. Since there are three cases including the middle Mars retrograde case, this will be a repeat of the 2007-2008 sequence. Of course, there aren't enough data points to conclude that we're on the verge of another financial meltdown in 2025, but it is an interesting parallel nonetheless.

The takeaway here is that Mars-Pluto oppositions are generally bearish for the stock market, even if the effect is too small to make reliable predictions. This offers confirmation of a basic astrological principle that the influence of Mars is negative when in hard aspect with Pluto. The other implication of this study is that the upcoming Mars retrograde cycle (Dec 6/24 - Feb 22/25) may increase the likelihood of a significant sell-off in stocks as it will replicate the pattern last seen in 2007-2008. The upcoming Mars-Pluto opposition in January will occur with Mars retrograde and Pluto direct, with further fallout possible from a 3rd Mars-Pluto opposition in April where both Mars and Pluto are in direct motion.


