 (7 October 2024) In the absence of objective and replicable data sources, astrologers are typically forced to fall back on traditional understandings of planetary effects. These astrological principles have been handed down through centuries of trial and error by practitioners and distilled into an identifiable set of interpretive rules. Thus, astrologers apply deductive logic when considering the transits of benefic planets such as Venus and Jupiter which are thought to increase the likelihood of desirable outcomes, while alignments involving malefics like Saturn and Mars increase the risk of unpleasant or unwanted events.
In a perfect world, we would simply test these trusted axioms to see which ones worked and which didn’t. But one of the problems of astrological testing is that outcomes are often not so easily measured. If we use individual life events as the core unit of analysis, it becomes necessary to track significant life outcomes for many people. For example, if we want to test the idea that Saturn is indeed a malefic planet and its transits produce difficulties and obstacles, then we would have to ascertain the effects of a Saturn transit to different natal planets. Since not all Saturn aspects may not have the same effects, narrowing down the list of possible aspect would greatly simplify our work Since many astrologers would agree that the 90 degree square is the most stressful, we could then retroactively assess when Saturn squares to the Moon, the Sun, Venus, Mercury occurred in the individual charts of the people chosen for the study. Then we would have to consult the major life events of many individuals to figure out if Saturn was, in fact, a bringer of negative events. One quickly realizes that a properly designed study of transit effects would be a major undertaking requiring well-documented life biographies or full access to dozens (or hundreds!) of people who would agreed to participate in the study.
Transits in financial markets: simplified induction
A simpler approach would be to skip the natal chart entirely and focus solely on the interaction between transiting planets. But how can we correlate transit effects with a measurable dependent variable (i.e. outcomes)? One useful variable in this regard are financial markets. Stock market prices are a composite barometer of many information inputs available to investors including macro economic data, corporate profitability and and collective sentiment. Market sentiment is subject to rapid changes as investors react to new information and try to anticipate the future direction of the economy. For our purposes, stock prices are a convenient dependent variable because they are quantifiable, time delimited, and thus easily measurable.
Of course, one caveat in such a study is that transit effects of stock prices may not be directly transferable to the lives of individuals. That’s true, but it is also the case that stock prices are the result of the manifest sentiment of a large number of people acting in the marketplace. The human factor is still there, even if it is mediated by countless self-interested financial decisions.
Aspect analysis: Mars square Sun
One transit alignment worth testing is the square aspect of Mars and the Sun. In Vedic astrology, both the Sun and Mars are considered natural malefics, although Mars is generally seen as more malefic. Mars is also recognized as a malefic planet in most types of Western astrology. Therefore, in both Vedic and Western astrology, the Mars square to the Sun carries a negative connotation as the intense and abrasive side of Mars is more likely to manifest in a negative way upon the matters symbolized by the Sun. While Western astrology does not distinguish between the forward 90 degree square and the backward 270 degree square, Vedic astrology assumes that the forward (i.e. counterclockwise) square of Mars is more malefic than the 270 degree square, and many traditional Jyotishis do not even recognize the 270 degree square aspect at all. For the purposes of the current study, however, I have included both the 90 and 270 degree squares and treated them equally. (Please see the Addendum at bottom of this post for an analysis of the differences between the 90 and 270 degree aspects.)

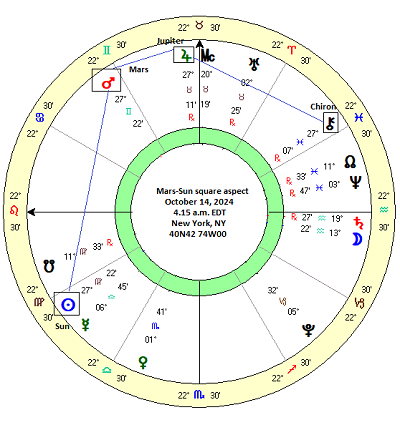
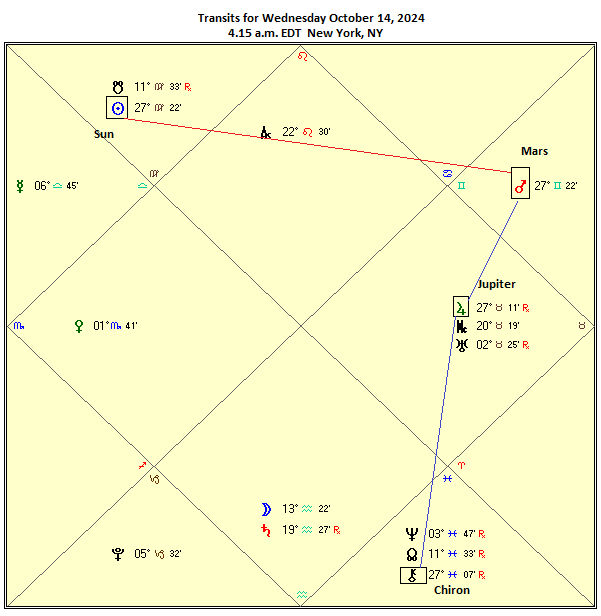
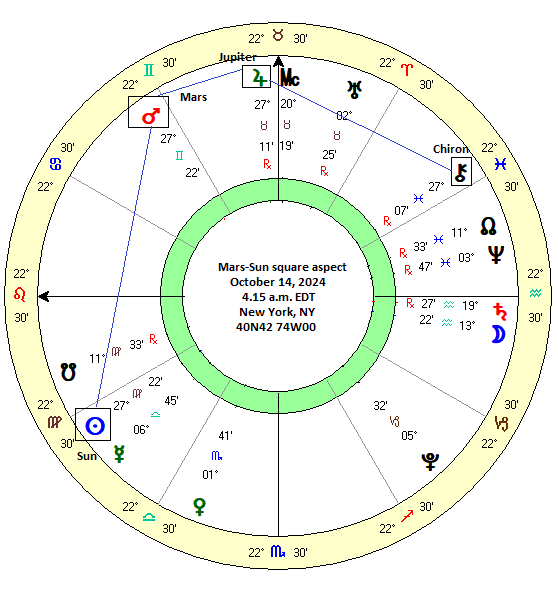
Another reason for choosing the Mars-Sun square is that one is fast approaching. On Monday, October 14, Mars (27 Gemini) will form an exact 90 degree square with the Sun (27 Virgo). Therefore according to traditional astrological principles, markets may be more vulnerable to declines in and around this date. Vedic astrology typically does not focus on exact degrees, preferring to focus on the sign-to-sign relationship as the basis for transit influence. Here I chose to test the Western exact degreewise aspect as it offers the possibility of differentiating the impact of different angular degree separations, i.e. 5 days before and after the exact square, 10 days before and after the square or 30 days before or after the square.
The commonly accepted view is that transit alignments tend to be most effective in the days leading up to their exact aspect and then begin to lose their influence almost immediately thereafter. For the Mars-Sun square, a 30-day window equates to a 16 degree orb (i.e. effective range), 10-day window equates to a 5.5 degree orb, and a 5-day aspect window amounts to a 3 degree orb. While practices vary substantially, most astrologers use the orbs of 10 degrees or less for the square aspect. In my practice, I prefer a narrower window of effectiveness, say about 5 degrees or less.
In this study, I limited myself to the past 33 years of Mars-Sun squares for reasons of brevity. This yields a small data set of 32 cases, which is too small to make any general statistical inference as regards significance. Nonetheless, as an exploratory study, it is big enough to reveal potential patterns which could provide the basis for larger studies.
As the index of stock prices, I used the daily closing price of the blue chip S&P 500 index. Where the time window parameters (0, +/-5 days, +/-10 days, +/-30 days) fell on non-trading days, I used the closest calendar day in either direction.
The table below shows the dates and the S&P 500 prices for the Mars-Sun square aspects from 1990 to 2024.
The percentage table below shows the change in prices for the six different time parameters.
Conclusions
The study suggests that the Mars-Sun square aspect may indeed have a negative impact on market sentiment, although it is very modest. The only time parameter that was negative was the 10-day window that preceded the exact alignment (0 days) which produced an average outcome of -0.41%. This corresponds to an approximate 5 degree applying orb. We should note that other aspect windows also produced results that were below the expected values. Since US stocks tend to rise over time -- about 7.5% per year in the long run -- the negative influence of this Mars-Sun square aspect may also be evidenced as long as the average return is below the expected values. Thus, the -10 to +10 day window posted a relatively smaller decline of -0.18% but this was still below an expected value of +0.4%. Admittedly, this is a minuscule effect which may not stand up in a larger sample size. And it is probably not significant anyway.
The -10 day to 0 day window therefore produced the strongest negative effect on prices. The marginal effect is also reflected in the number of negative cases -- 18 out of 32 -- just a little more than half. In other words, even if this effect did hold up with a larger sample size, it is likely too small by itself to be practical in stock trading.
Differentiating between the 90 and 270 squares
If we separate the effects of the 90 degree from the 270 degree squares, we can see that the forward/counterclockwise 90 degree square is more bearish. Whereas the 10-day window for all 32 cases yielded an average of -0.41% change in S&P 500 prices, its negative effect increased to -0.94% for the 90 degree cases (n=16) while the 270 degree Mars-Sun square was actually slightly positive at +0.13% although it was still a bit below the expected value of +0.2%.
So score one for traditional Vedic aspecting rules. The full strength forward Mars square to the Sun did correlate with negative market outcomes while the backward 270 degree square was more or less neutral. While the sample size of 16 is too small to make any serious conclusions, it does seem like the forward 90 degree Mars-Sun square aspect is more negative than backward 270 degree Mars-Sun aspect. And for such as small number of cases, using the average probably makes more sense than using the median, although there was a negative outcome for both the -5 day to +5 day and - 5 day to 0 day windows in the forward 90 degree square table. This is another clue that the forward Vedic square is more negative than the backward 270 degree square.
Co-factors: how astrology is like genetics
While the effect of the Mars-Sun square is small, it may still be useful as one chart factor out of many. Just as heritable traits like height and intelligence are determined by hundreds or even thousands of individual genes operating together, market performance likely depends on many separate chart factors. In fact, some of these co-factors were more apparent in retrospect. The 5.76% decline leading into the Aug 27, 2022 aspect coincided with a bearish T-square of Venus-Saturn-Uranus. The 6.75% gain that accompanied the Mars-Sun square on Dec 2, 2018 also featured a triple conjunction of the Sun, Mercury and Jupiter. In that case, the negative impact of the Mars-Sun square was redirected by the Sun's alignment with two benefic planets -- Mercury and Jupiter. As always, astrology is holistic and demands an accounting of all relevant influences.
This discussion returns us to consideration of the current Mars-Sun square on October 14. According to the most effective 10-day window, the more bearish period would have started on October 4 and will last until October 14. With stocks were down today (Monday), it is tempting to think that the negative bias of the Mars-Sun square is playing out. But with benefic Jupiter aspecting the Sun for the next few days and Jupiter itself aligning with Chiron, the bearish bias of the Mars-Sun aspect seems somewhat less likely to manifest. We may possibly get another data point after Jupiter turns retrograde on Wednesday morning.
Postscript
(29 October 2024) I have expanded the dataset to include 10 more cases, extending the look back period to 1990.


