- Stocks may weaken early early with gains more likely towards end of the week
- Dollar unlikely to break above resistance at 81
- Gold susceptible to declines early but should rebound strongly later in the week
- Crude to stay firm near $85
- Stocks may weaken early early with gains more likely towards end of the week
- Dollar unlikely to break above resistance at 81
- Gold susceptible to declines early but should rebound strongly later in the week
- Crude to stay firm near $85
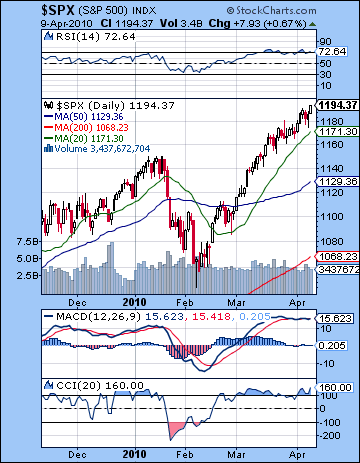 Another week, another high. With nothing new to worry about and more plausible looking economic data, investors pushed stocks a little further up the sisyphean slope last week for a gain a little over 1%. The Dow came to within a hair of 11,000 closing at 10,997 while the S&P fared somewhat better at 1194. I had been a little more bearish here, mostly on the expectation that the early week alignment between Mercury-Mars-Pluto might deliver a down day or two. My worst fears came true, however, as the aspect was already losing strength by Monday’s open so whatever bearishness the aspect contained just disappeared. It also seemed that the fact that three planets were involved here irrespective of their valences may have in itself generated more buying. So Monday did almost get to 1190 as I suggested last week, although there was no midday reversal. Wednesday was the only down day, perhaps not surprisingly with the Moon-Mars aspect in play. The late week unfolded more positively as I thought it might as the Sun-Jupiter aspect lifted prices on both Thursday and Friday. Bullish aspects are prevailing over bearish ones here and the market is trending higher as a result. This is somewhat surprising given the lack of prominence of Jupiter in the sky. Aspects from explicitly negative planets like Saturn and Mars are having little effect to push prices down as buyers invariably return quickly to bid up the market anew. It is very possible that the Uranus-Neptune aspect may be supporting the market. This is a very slow moving aspect — both planets move only a few degrees per year — and I have alluded to in previous newsletters, although I was not certain of its effects. Neither planet is considered a bullish planet by itself, but the fact remains that they have been in close aspect with each other for some months. This is perhaps one reason why this rally is still intact. It is worth noting that this aspect will become exact this week on Tuesday, April 13. While this is admittedly a more speculative turn on my part, we should pay close attention to the possible correlation of this aspect and market trends. Since exact aspects can often coincide with trend changes, it is conceivable that the market may lose one of its medium term sources of support following the perfection of this aspect. That said, I am not expecting any earth-shaking changes this week.
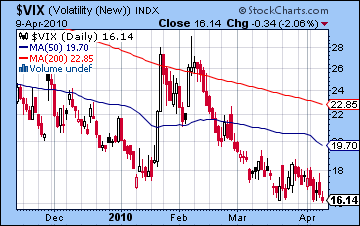
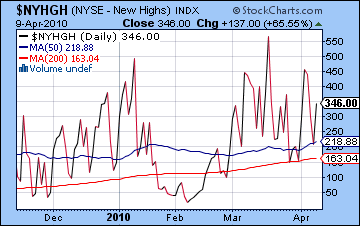
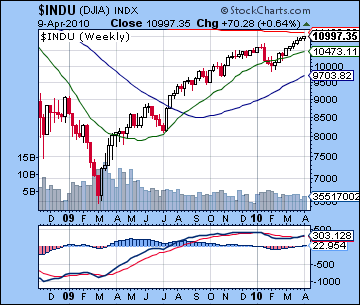
The technical situation of the market is largely unchanged. New yearly highs will of course satisfy bulls as the indexes approach some significant resistance levels on the S&P. CCI (159) is quite bullish and moreover has matched its March level. RSI (72) continues to move into the overbought zone where it has been since March. MACD is only mildly positive, however, and shows a bearish divergence as it has not matched its highs from March. Since it is still quite flat, this divergence is perhaps less glaring that it could be, and hence perhaps not immediately indicative of a correction. Volume remains weak and again we have the situation whereby the highest volume day for the week occurred on the only down day. That ought not to embolden bulls very much since it suggests that commitment to the rally may be half-hearted. Of course, prices are still rising and that is the only thing that really matters. The $VIX continues to bounce along at 16, perhaps in the process of bottoming here despite the new highs. Could this be another possible divergence? It’s too soon to tell, but if we were to see higher prices next week and the volatility index still stayed above 16, then that might provide a little more evidence that it couldn’t go any lower and its next move will be higher when the correction hits. New 52-week highs ($NYHGH) continues to diverge from the new highs on the market. While it spiked Friday to 346, it is still below its two recent highs including the yearly peak from March. This suggests there are fewer stocks participating in this rally and unless the 52-week highs can once again move higher, further advances in the market are unlikely to go far. The weekly Dow MACD chart shows the bullish crossover into its second week but the negative divergence seriously undercuts the strength of this indication.
 Resistance on the S&P stands close to current prices, perhaps around 1200-1220. This is the upper price channel that connects the previous highs from last fall. A breakout above that would be a strongly bullish move and would give added credence to the notion that we are in a bull market as opposed to merely an extended bull rally within a bear market. I don’t see this sort of breakout happening at this point, although I would not rule it out for June. Perhaps even more interesting is where support lies. The falling trend line from the 2007 highs is at about 1100 now so that should be seen as a crucial support level. For bulls, they do not want the market to slip below that point or else it increases the likelihood that the longer term bear market is back in business. The recent move above that falling trend line put air beneath their wings and gave extra credence to their claims that sentiment had undergone a significant change. We should also note that 1080-1100 is also the level of a bottom rising trend line that emerges out of lows from last July. The approximate intersection of these lines around 1100 make that level potentially more important in the event of a correction. If its holds and the market rises higher again, it will give a boost to the bulls’ confidence. If it breaks, then it provides greater technical evidence that we could be in store for much steeper declines this summer. More immediately, the 20 DMA at 1170 should be seen as a key support level since prices have stayed above it for the past six weeks. Even if we see a pullback, it may initially bounce off this line and attempt to continue the rally.
 While the short term aspects favour more gains this week, the influence of the Sun’s entry into Aries and the culmination of the Uranus-Neptune aspect throws the outcome into greater doubt. Monday sees the Moon in Pisces opposite Saturn. This is not a particularly helpful influence, although the effect of transiting between the Sun and Uranus may mute the downside somewhat. There is a lot happening Tuesday as Uranus (4 Pisces) will finally complete its aspect with Neptune (4 Aquarius) and begin to move on. Venus will also be in close aspect with changeable Rahu, thus increasing the chances for a large percentage move. Since the Sun enters sidereal Aries early Wednesday morning just hours before a New Moon, there is a greater chance for a trend reversal at this time. By itself, however, the Moon’s position is actually bullish but it is unclear if it will be able to take prices higher. Thursday sees the Moon approach both Mercury and Venus in Aries in what looks to be a fairly bullish alignment. As an added bonus, Venus will be just two degrees from aspecting Jupiter. Friday is perhaps the better of the two days as the Venus-Jupiter aspect will be that much closer. Overall, the late week period looks somewhat more bullish although the wild card is the Uranus-Neptune aspect on Tuesday. It is possible that the market could fall in the early to midweek and only partially recover after that. That is a less likely outcome, however, as I think there is a better chance the various short term aspects will lift the market higher, probably over 1200 towards the next resistance level. That said, I still believe a correction is close enough at hand that great care should be taken with any long positions. The market could conceivably keep rising into the Saturn-Uranus opposition on April 27, but not much further after that.
 Next week (Apr 19-23) begins with a massive multi-planet alignment involving the Sun, Saturn, Uranus, and Neptune. Overall, this looks bearish especially given the fact that Mercury will have turned retrograde just two days prior. Mercury can represents changes in the trend and the Sun could also act as an early trigger for the Saturn-Uranus opposition. All told, a bearish beginning to the week seems the most likely outcome although we should not rule out a bullish open on Monday. Gains are more likely at the end of the week on the Venus-Uranus aspect although it is unclear if they will be enough to keep the rally intact. The following week (Apr 26-30) looks more solidly bearish as the Saturn-Uranus opposition becomes exact and the Sun and Mercury move into close aspect with Mars. After that, May should begin bearishly as Sun is square to Mars as Mars forms a minor aspect with Saturn. There is a possibility of significant declines in the first week of May. At the moment, the most likely scenario is that the S&P tops out around 1200-1210, and then corrects down to 1100 or higher. Then it will make another final rally attempt into June that may not match its April highs. It’s still quite possible that we could see a high of 1250 or perhaps even higher into June and July, although that may be overly optimistic. In fact, there is a more bullish case to made for the market to stay more or less in rally mode all the way to late July and the Mars-Saturn conjunction. A more bearish scenario would see the correction begin this week and take the S&P below 1100 causing the bull market advocates significant amounts of consternation. Unless we see some bigger changes in sentiment on the Uranus-Neptune aspect and the Sun’s ingress into Aries this week, this is a less probable outcome. Again, the late summer and fall look like the most bearish time of all here so we can expect to see the greatest percentage drop to occur between August and December. If the market rises above 1250 by July, then that will significantly reduce the chances of breaking the March low of 666 anytime in 2010. The decline will still be quite large in percentage terms, but I’m less confident it can fall 45% over a few months.
5-day outlook — neutral-bullish SPX 1180-1210
30-day outlook — bearish SPX 1100-1140
90-day outlook — neutral SPX 1150-1250
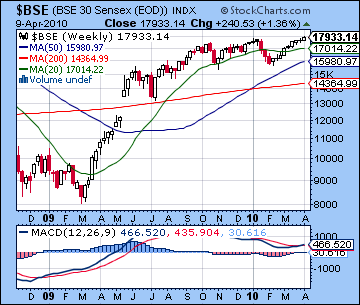
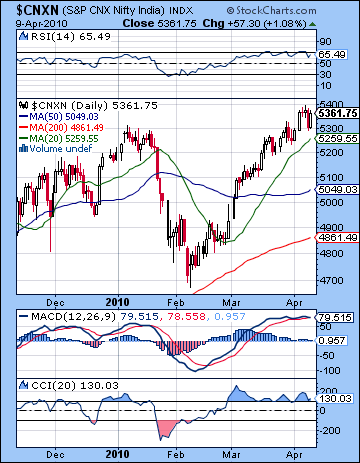 Stocks in Mumbai continued their upward drift last week on foreign buying and favourable global cues. Gaining over 1%, the Nifty made new highs for the year as it closed at 5361 while the Sensex finished at 17,933. I thought we might see more bearishness manifest early in the week on the Mercury-Mars-Pluto alignment but Monday’s gain put the Nifty over the top. In last week’s newsletter, I wondered "if the proximity of benefic Venus to this alignment may be enough to tease another day of gains" before the mood turned negative. While sentiment never turned completely bearish, Monday’s gain put the market near the highs for the week and trading continued in a saw-off after that. I had thought Tuesday might be more negative, but as has so often been the case lately, what appear to be negative transits merely resulted in a fairly neutral or flat day. Stocks merely fractionally higher Wednesday in what I thought might be a fairly nothing day, and then the end of the week saw declines arrive on Thursday and then erased on Friday’s Sun-Jupiter aspect. While I missed the extent of the pullback on Thursday, Friday’s gain came off more or less on schedule. The inability of the bears to gain any significant traction suggests that there is some fairly powerful but hidden force that is keeping sentiment afloat. One possible candidate that I have mentioned briefly before is the minor aspect between Uranus (4 Pisces) and Neptune (4 Aquarius). This aspect between these two slow moving distant planets has been in effect for several months. While neither planet is particularly benefic, the combination of the two working in concert may be one source of enduring quality of this rally. I have certainly underestimated its potential effects here, thinking that the main action would belong more to Jupiter and Saturn. So far, however, Saturn has not played much of role as its aspects have corresponded with only minor declines, with the exception of the January correction. We may be in a better position to judge the effect of this lurking aspect between Uranus and Neptune this week and next as the aspect will become exact on Tuesday, April 13th. After that date, Uranus, the faster moving of the two, will move away from its aspect with Neptune so its influence may begin to wane. As we’ve seen with other aspects, this influence is not always immediate. It may take the added impetus of the Saturn-Uranus opposition on 27 April to make a cleaner break with the up trend.
The new highs are definitely a source of celebration for bulls as the indices finally managed to push above significant resistance. Volume was not exceptionally strong, however, so that ought to mitigate some of the optimism in the bull camp. We can see how even the new high in ICICI (IBN chart) was achieved on weak volume with the down days on Wednesday and Thursday actually occurring on higher volume. So how significant are these new highs? The daily MACD on the Nifty hardly gives a ringing endorsement. The bullish crossover that has marked this latest rally off the February low has all but disappeared and MACD looks like it is about to rollover. Despite the new highs, it has been mostly flat indicating a possible slackening of momentum. CCI (130) is more bullish and while it has come off its high of 200, it is still well above the 100 line. RSI (65) has fallen below the 70 line and may be trending lower, although that would not preclude another short run higher. Friday’s gain completed a successful test of support from the 20 DMA at 5259, a sure sign that the bulls are firmly in charge here. Nothing much can change unless the 20 DMA is broken. Once that goes, the 50 DMA around 5050 is likely to offer some support. This also roughly coincides with the bottom rising channel from the July low which now stands at 5000. The market is still in a rising bearish wedge here so that 5000 level is potentially more important because once breached, it could spark a rush to the exits as the extended liquidity-driven party comes to an end. The next level of resistance is the top of the rising wedge, now at about 5500. From a technical standpoint, it would appear more likely that the upper level of resistance at 5500 will be tested before support at 5000. If we get to 5500 this week or next, that would set up another correction scenario. Certainly as prices creep to 5400 or above, investors should be aware of the possible downside. A correction may well occur near the Saturn-Uranus opposition in late April and early May. At this point, I am unsure if we will break below 5000. It’s certainly quite possible, but given the recent strength of the market and the likelihood of more gains in May and June, we simply may not have enough time for the bearish planets to do their work. As a result, the correction may be brief and stunted. If the Nifty cannot break below 5000, it will increase the likelihood of fresh new highs in June or perhaps into July. In the most bullish scenario, the bottom of the bearish wedge would only be broken in July ahead of the deeper correction for the late summer and fall.
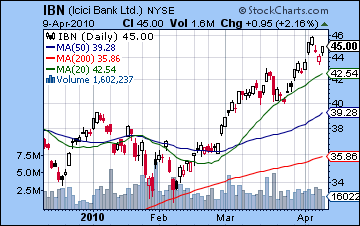 This week the short term aspects suggest the bulls may be able to wring out another percent or two from the market. However, the culmination of the Uranus-Neptune aspect on Tuesday and the entry of the Sun into Aries on Wednesday are two medium term wild cards that might disturb that outcome. Monday opens favourably with the Moon conjoining Uranus in Pisces. This should produce enough optimism to outweigh any negatives from transiting Mars and its aspect to the natal Moon in the NSE chart. Tuesday will feature Venus in close aspect with Rahu which would often coincide with speculative buying, however, I note that Venus will sit exactly atop the NSE’s Ketu so it may confound any predictive attempts. Given we have the Uranus-Neptune aspect perfecting on this day, we really need to be open minded for any outcome. I would lean towards a down day here, especially if Monday is higher as we expect. Wednesday is closed for a holiday when the Aries New Moon will occur. Thursday sees the Moon join Mercury and Venus in Aries but the conjunction may not be tight enough to take markets higher. A down day is possible here, although that is not clear. Friday looks to be a good candidate for a gain as Venus moves towards an aspect with Jupiter and the Sun approaches Uranus and Neptune. Friday looks like it may be the best day of the week, followed by Monday. Tuesday may be somewhat worse than Thursday, although that is related the greater possibility of a large percentage loss rather that the actual probability of a down day. Assuming there is no huge one day decline, I would lean towards another positive week, with the Nifty touching above 5400 at some point.
 Next week (April 19-23) looks more bearish as Mercury turns retrograde on the previous Saturday and the Sun forms a large alignment with Saturn, Uranus, and Neptune early in the week. Large multi-planet alignments have failed to deliver much in the way of downside recently, but there may be more reason to think the bears could have their way here. Mercury will now be heading into a difficult aspect with Mars and the Moon will be transiting Gemini and thus receiving Saturn’s aspect. The early part of that week could well be negative. Gains are more likely towards the end of the week on the Venus aspect to Uranus-Neptune, although this may only produce one reliable up day — Friday. The following week (April 26-30) features the exact Saturn-Uranus aspect on Tuesday the 27th. This may or may not correlate with a market high although I think there is a chance we will have already seen the high put in by that time. It’s possible the market may simply tread water here. At the same time, a Sun-Mercury conjunction on Wednesday and Thursday would appear to punctuate the week with a large gain. After that, there is a greater likelihood for declines in the first week of May as the Sun-Mars square is exact on the Monday. Mars also forms an alignment with Rahu and Saturn in the early week so that also may encourage selling. The whole week looks negative so we could see a sizable decline, perhaps up to 10%. Watch for a rebound rally after that through May and June. Markets could largely escape further corrections until July when Mars enters Virgo to join Saturn. This is perhaps the most bullish scenario, as the Jupiter-Uranus conjunction will propel markets to new highs for the year until mid to late July. The direction should trend down after that for much of the rest of the year.
5-day outlook neutral-bullish NIFTY 5350-5450
30-day outlook bearish NIFTY 4800-5100
90-day outlook neutral-bullish NIFTY 5200-5500
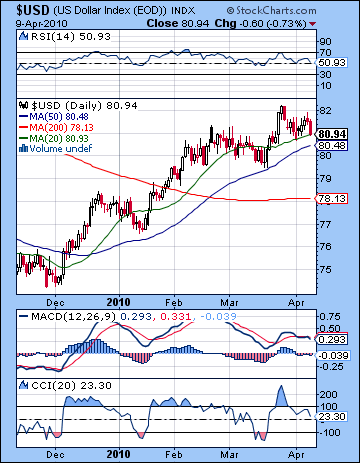 As more news of an imminent bailout of Greece filtered through the markets, the US Dollar gained fractionally last week closing just below 81. I had been modestly bullish so this result was not wildly out of line with expectations. However, the intraweek dynamics were very much at odds with the forecast as the gains were largely confined the earlier part of the week. Monday was up as expected on the Sun’s aspect in the USDX chart, but the rally continued without interruption into Wednesday, which was more than I had expected given the lack of clarity of the planets. The difficulties presented by the Sun-Jupiter aspect later in the week manifested on Friday on a day where I had thought we would see more upside. The technical position of the Dollar remains strong as it now sits on its 20 DMA. This should therefore be seen as a possible support level. The 50 DMA is just half a cent below here and still roughly corresponds to the bottom of the rising channel off the December low. This is likely a stronger level of support so we should not be surprised to see this tested in the coming days before getting a reversal higher. Daily MACD is looking a little tattered here as it has begun a bearish crossover and shows evidence of a negative divergence. CCI (23) has slipped close to the bearish zone here and RSI (50) has undergone substantial erosion. It’s worth noting that the previous pullback in February saw the RSI dip to 45 so even if this level was touched upon again it would not necessarily interrupt the medium term up trend. Weekly MACD is still in a bullish crossover and promises an extension of upward momentum over the next several weeks at least.
This week looks fairly choppy with the possibility of gains more likely in the early part of the week. The Venus-Rahu aspect occurs in close aspect with the natal ascendant so that is likely to generate a sizable move. There is a greater likelihood of a gains here although I would note that Venus is sitting on the unfavourable 6th house cusp in the natal chart. This diminishes my confidence in calling for an up move although I still think it is the somewhat more likely to occur going into Tuesday. The midweek is harder to call as the New Moon in the first degree of Aries is not activating anything in particular in the USDX chart. The end of the week looks more bearish on the Venus-Jupiter aspect. Next week may see further consolidation with a greater chance for declines early in the week. The picture should brighten by week’s end. The week of May looks to be the most bullish period as the Sun-Mars square will spark a flight to safety. This rally should continue intact until early June. After that, the planets are somewhat less emphatically positive. This does not mean the Dollar will fall, but there is a greater uncertainty around it. We would therefore have a greater likelihood of prices falling below the rising trendline, for example. It would likely tend to extend its rise, but with less upside. More negativity is likely to creep in in late August, so that could mark the start of a topping pattern where new highs would be harder to come by. Steeper declines are perhaps more likely starting in October and November. October may therefore be a good time to consider exiting the dollar for the medium term as there are a series of bearish looking aspects forming that continue into early 2011.
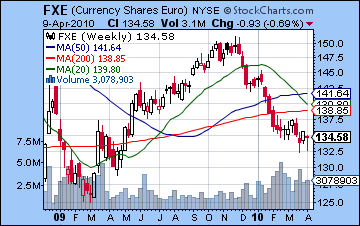 Despite continued fretting over Greece, the Euro managed to hold its own this week closing just under 1.35. After retesting recent lows below 1.33 on Thursday, the Euro rebounded in Friday’s session on the confidence generated by the Sun-Jupiter aspect. While I was correct in expecting further declines this week especially on Wednesday and Thursday, we did not get the early week sell-off I had forecast. The Euro has improved its technical situation sufficiently to to be perched on its falling trend line from its December highs. Any move higher here will break through resistance and could spark a more significant move up. Friday’s up volume in the FXE ETF was quite strong so it would not surprise me to see something like that happen, perhaps to the 50 DMA which is about a cent higher than its current price. Daily MACD shows the possibility of a bullish divergence here but unless we see something strong here, it does not look overwhelmingly positive. This week looks more bearish in the early going with the Sun’s entry into Aries corresponding with the malefic 8th house in the Euro’s natal chart. The New Moon on Wednesday may see this negativity highlighted. The late week period looks more positive on the Venus-Jupiter aspect. Friday or next Monday the 19th could see significant rises. Even if the Euro rises above its trendline this week and next,. it seems locked in a bearish move lower in the medium term. The Saturn-Uranus opposition occurs just one degree from its natal ascendant and this looks like it will be fully activated by the Sun-Mars square in the first week of May. This alignment has the power to take the Euro down to 1.30. Meanwhile, the Rupee maintained its winning ways rising to 44.2 as more global investors were drawn to the India story. Further strengthening is possible this week and next, perhaps below 44, but there will be some unwinding by early May.
Dollar
5-day outlook — neutral
30-day outlook — bullish
90-day outlook — bullish
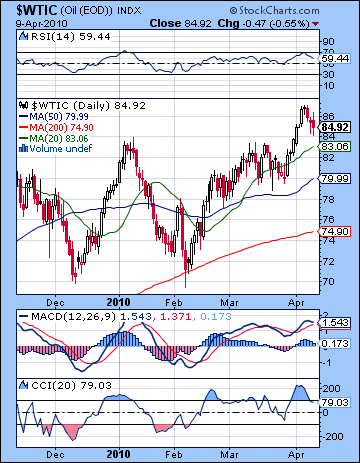 After punching higher early in the week, crude settled back to its previous week’s level just under $85 on the continuous contract. I mostly missed this pattern as I had expected more selling early on with gains coming afterwards. There is no easy astrological explanation for last week’s price movements other than to note that the Mercury-Mars-Pluto alignment may have been offset by the continuing presence of Jupiter very high in the Futures chart. I had previously speculated that crude may continue to do well through April due to this underlying strength from Jupiter’s transit of the 10th house. So far, that medium term influence appears to be outweighing many passing transit effects. MACD is maintaining its bullish crossover here and it also rising. CCI (79) has slipped below the 100 line but nonetheless is coming off a series of higher peaks in the recent rally since the February lows. This suggests that momentum may have staying power. RSI (59) has come off its recent highs but remains in bullish territory. Recent dips only corresponded with lows around 50 so as long as crude stayed above 50, bulls may feel more confidence. Prices tested resistance of the upper price channel around $86-87 this week so that remains a significant level. After that, $90-92 would be the next level where would selling may occur. Support roughly aligns with the 20 and 50 DMA. The 20 DMA coincides with the sharply rising bottom price channel from the February lows now at about $83. This should be sufficient to withstand an initial move down. After that, the 50 DMA lies around the $80 level and this corresponds to a congested trading area over the past several months. A move higher is certainly possible in the short term, although it is unlikely to break all the way to $92. Once the Saturn-Uranus opposition hits on the 27th, a retracement is likely with $80 very possible and $70 and the 200 DMA is not out of the question.
This week looks somewhat more positive as Friday’s Venus-Jupiter aspect is likely to make up for most of any declines that could occur beforehand. While Monday is harder to call and could well be negative, Tuesday’s Venus-Rahu aspect is likely to generate gains. Wednesday could go either way on the Aries New Moon. Thursday may be negative as the Sun conjuncts the natal Mars. As a pair, Wednesday and Thursday appear to be net negative as the effects of the Sun to Mars aspect could be spread over two days. Friday sees a likely gain on the Venus to Jupiter aspect. Next week is likely to start with gains but then the rally could unravel on the Sun’s opposition to the natal Moon-Saturn conjunction. Crude should continue to weaken in the last week of April and into the second week of May. We could see a possible low formed near Wednesday May 12 at the end of the Mercury retrograde cycle. What makes this cycle of particular note to the crude price is that it will come to an end as Mercury stands at 8 degrees of Aries, nearly exactly opposite the natal Saturn (9 Libra) in the natal chart. If we are going to see crude get back down towards $70, this would be the most likely time.
5-day outlook — neutral-bullish
30-day outlook — bearish
90-day outlook — neutral-bullish
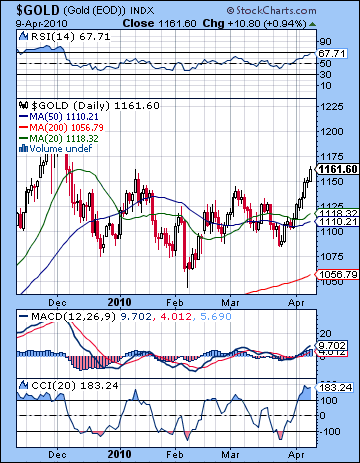 As more investors considered the possibility of a Greek default, gold surged higher closing above $1160 for the first time since January. This was a disappointing outcome since I had been more bearish here, especially in the early part of the week. Gold actually rose modestly Monday and Tuesday despite the Mercury-Mars aspect. Given this aspect hit the natal Mars in the ETF chart, I believed that a negative outcome was more likely. As it turned out, however, I underestimated the effects of the close proximity of benefic Venus to this pattern and prices went higher. As expected we saw bigger gains occur on the Sun-Jupiter aspect later in the week, although Friday’s gain came as a surprise. Gold’s rise was impressive as it has broken out above its recent pennant pattern. It matches a recent high around $1160 so that should be seen as resistance. Above that, its previous high of $1220 would be the next resistance level, although I do not expect to see gold reach that point just now. Support is found near the confluence of the 20 and 50 DMA near $1100-1120. We could see a test of this level over the next two weeks, but it should hold initially. Daily MACD is in a strong bullish crossover and is rising. CCI (183) is also strong and has reached its highest levels since November. RSI (67) is also bullish and perhaps moving towards the 70 level. Bears can point to the weekly MACD chart since it is still in a negative crossover although other indicators are showing distinct signs of improvement.
Gold seems likely to extend its recent winning streak this week as the Sun enters Aries, its sign of exaltation. As an added bonus, this ingress will occur very close to the New Moon and hence may signify a further boost in sentiment. The Sun is in aspect to the natal Venus in the ETF chart so that offers a little more support for the notion that we could see more gains. Declines are perhaps more likely before the ingress on Monday and Tuesday as the Sun conjoins the bottom of the natal chart, but here I am less confident in a bearish outcome given the presence of some positive aspects involving Mercury. The mood should stay mostly buoyant into Friday and the Venus-Jupiter aspect. While I had thought gold would not be able to break above its recent highs, it has managed to do so. I would therefore not rule out another run to $1200 here, especially if we don’t see much downside on Monday. Next Monday the 19th should be very interesting for gold since the Sun, the planet that most symbolizes gold, will be in aspect with Saturn, Uranus and Neptune. It will also be forming a close aspect to the ascendant of the ETF chart. While Saturn is rarely a positive influence, there is a chance this could be an interim top in gold with declines more likely afterwards. Gold may have a bearish bias in the last week of April also and this should extend into May. The first week of May has that very tough Sun-Mars-Saturn-Rahu pattern that could see a sudden steep decline. I would not rule out a one-day 5% decline, possibly on May 3rd or 4th. We could see a low on Friday the 6th or perhaps more likely, Monday the 9th. Given the proximity of Jupiter to Uranus, another rally phase seems likely through May and June. Prices may fall again in late June but it is unclear how severe this pullback will be. Picking the low for the year is tricky due to conflicting indications. Late June is one possible candidate for the yearly low. If the rebound rally from this imminent correction is fairly weak, then we could see the low made in October. However, the medium and long term influences look very bullish here so there is good reason to expect gold prices to explode higher at some point over the next 6 to 12 months.
5-day outlook — bullish
30-day outlook — bearish
90-day outlook — neutral-bullish

