- Stocks under pressure early with rebound possible by Friday possible
- Dollar likely to stay above 80, with another run to 82 possible
- Gold weakening towards $1100
- Crude to consolidate at lower levels
- Stocks under pressure early with rebound possible by Friday possible
- Dollar likely to stay above 80, with another run to 82 possible
- Gold weakening towards $1100
- Crude to consolidate at lower levels
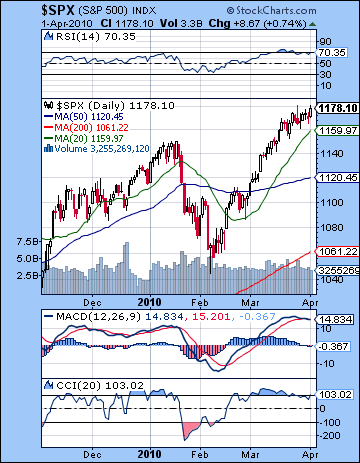 Stocks continued their incremental ascent last week as jobless claims and manufacturing activity offered more evidence of a recovery taking root. The Dow climbed less than 1% closing Thursday at 10,927 while the S&P finished at 1178. While I suggested a bearish bias last week, I was anything but certain about that call given the positive aspects in the mix. Therefore, it did not come as a surprise that the two bullish aspects last week seemed to have overruled any downside generated by the ingress of Venus and Mercury into sidereal Aries. As expected, Monday was higher on the Venus-Uranus-Neptune pattern although this turned out to be a very modest gain. Tuesday’s Full Moon was more bearish than Monday as outlined in the forecast, although the outcome was merely a flat day. I had been unsure about the late week dynamics thinking that we would see one up day and one down day. This in fact occurred although Wednesday saw some very modest selling while buyers returned in force on Thursday. In the final analysis, it may have been Thursday’s grand trine between the Moon, Jupiter, and Ketu that provided the fuel to lift stocks to new highs for the year, although prices did not sufficiently buoyant to reach the rising trend line at 1190. As noted last week, the effects of the Aries transits are harder to pinpoint since they will last for several weeks and therefore represent more of a background influence. Venus will leave Aries on April 19 while Mercury will remain there all the way until June 6, as its transit will be extended due to its retrograde cycle. The Sun will also transit Aries from April 14 to May 14 so that is another possible source of bearish sentiment worth watching. It may well be that the negative effects of Aries are so mild may only manifest in the absence of any positive planetary aspects. That was certainly one of the lessons from last week.
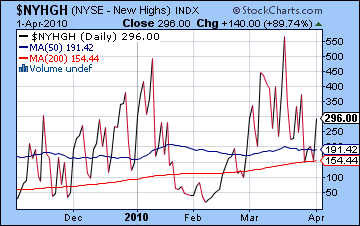
Despite the new highs, the technical picture of the market offers hope to both bulls and bears. Bulls can of course note the new highs on all major indexes and see that the market may still reach the rising trendline at 1190 before another correction may ensue. The market is only 1% away from that point but it nonetheless creates a new pivot point to consider. Also the weekly MACD on the Dow has now been in a positive crossover for two weeks running. This suggests that there is growing evidence that the rally could be sustainable over the medium term. For their part, bears can point to the negative crossover in the daily MACD in the S&P as a sign that this latest rally off the Feb 5 low is very fragile and ripe for a correction. MACD is rolling over here so that is another bearish indication. Volume remains middling at best as the highest volume last week occurred on — you guessed it — Wednesday’s down day, while the day of lowest volume coincided with Thursday’s gain. CCI (103) is still bullish but appears to be coming off its recent highs and may be indicating another correction. RSI (67) is also strong but the negative divergence is hard to miss here as momentum has fallen off in the past couple of weeks. The falling number of stocks making new highs (296) is another intriguing sign of a narrowing of the rally as the chart for $NYHGH shows. While this number is bound to fall as the rate of increase diminishes, there is a fairly steep drop-off here since mid-March. This may either foreshadow a broader correction as happened in January, or it may merely indicate a pause in the rally. Resistance remains around SPX 1190 while support is likely found near 1150 and the 20 DMA. Another potentially key support level is the 50 DMA at 1120. This is perhaps doubly important because it also corresponds to the falling channel line from the 2007 and 2008 tops. The market broke out above this falling resistance line in early March after bouncing off it in January. Resistance becomes support in a bull rally, so it may be a critical price level in the coming weeks as bulls will be hoping that prices can stay above this long term trend line. If prices break substantially below 1120 in any correction — something that I believe is quite likely over the next 4-6 weeks — then it will damage the medium term view for this extended bull rally. It will also wreak havoc with the notion that we are in a genuine bull market rather than simply a bullish phase in a secular bear market.
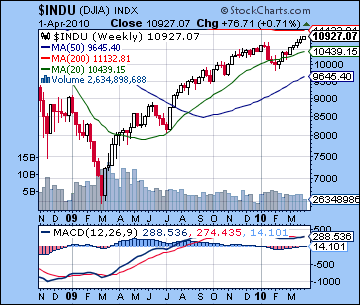 The growing signs of economic recovery present a dilemma for Ben Bernanke. As Friday’s jobs report suggests, those green shoots of 2009 are starting to bloom now in 2010 as private sector job gains were greater than expected. While stocks may take a short term cue from this optimism, treasury yields will also continue to rise as inflation is seen as more likely down the road. These inflationary fears may force Bernanke’s hand and compel the Fed to raise rates sooner than expected. In fact, there is word of an emergency Fed meeting Monday to discuss the possibility of raising the discount rate. While this does not have the importance as the overnight rate, it nonetheless will be watched closely. Some commentators have suggested that the key levels to watch for are 4% for the 10-year and 5% on the 30 year bond. At the moment, we are only 10-15 basis points away from 4% on the 10 year. If rates should rise above that level, it may trigger an outflow from equities as bond yields simply become too attractive to ignore. How would the market react to rising rates, either from a Fed move or the market collectively deciding to push rates above 4%? To some extent, many traders have already discounted a rate hike since it is part and parcel of the economic recovery. It would begin to normalize lending conditions and allow firms to make clearer decisions about future borrowing. But it remains to be seen the extent to which the year-long rally was predicated on free money and endless amounts of government-supplied liquidity. The removal of these government supports is going to be a major source of concern for stocks over the next several months as quantitative easing moves are wrapped up.
The planets this week looks somewhat more bearish than last week’s although even here there should be sufficient positive energy for one or two up days. Monday features a Mercury-Mars-Pluto alignment that looks quite negative. One possible saving grace is that Mercury will have moved past its aspect with Mars by the open of trading so that may mute some of the bearishness. Certainly, the initial reception to the bullish jobs report would tend to indicate a positive day but the results of the Fed meeting may short circuit that pent-up optimism. I would also note that three planet alignments are sometimes positive for the market, even though they involve malefic planets such as Mars and Pluto. I would not rule out a large move here in either direction, although I would lean towards a bearish outcome. A Sun-Rahu aspect on Tuesday also does not seem very positive and with Mercury still in close proximity to Pluto, I would also incline towards a negative outcome here. Wednesday may see some rebound but a weak close is indicated by the Moon-Mars aspect in the afternoon. The end of the week looks somewhat more positive on the Sun-Jupiter aspect. This is likely to result in an up day either Thursday or Friday. I would lean towards Thursday as the more likely candidate for a rise. So overall perhaps we will see a rise early Monday — perhaps to 1190 — followed by a reversal during the day. This may then set the tone for the week as the market seems more vulnerable to a correction here.
 Next week (Apr 12 -16) looks somewhat more positive than this week, although the picture seems quite mixed. The week may begin with gains, but some deterioration is likely on the Venus-Rahu aspect on Tuesday or Wednesday. The Sun enters Aries on Wednesday so that is another potentially bearish influence. The following week (Apr 19-23) seems more positive again so some kind of rebound is likely, particularly if the market has been in decline the preceding week. Watch for much of the strength to manifest later in the week on the Venus aspect to Uranus and Neptune. As an added bullish influence, Venus enters Taurus on Tuesday April 20. After that, the picture worsens significantly as retrograde Mercury is in aspect with Mars (25th) and Saturn lines up in opposition to Uranus (26th). The Saturn-Uranus aspect is quite important here, as it could hasten a decline in its wake as it has done on a couple of recent occasions. But this is not a certain outcome and we should be aware of another scenario. It is possible that the market could trade sideways and even drift higher through April and form a top very close to the day of the exact aspect on April 26. This is what happened in November 2008 when an interim top was formed after the initial October meltdown. The market then fell another 20% over the next two weeks. The more likely scenario is that the market will trend lower through April, and then the decline will accelerate in the last week of April and first week of May. The common thread there is that we may see the bulk of any decline occur after April 26.
5-day outlook — bearish SPX 1140-1170
30-day outlook — bearish SPX 1100-1150
90-day outlook — bearish-neutral SPX 1100-1200
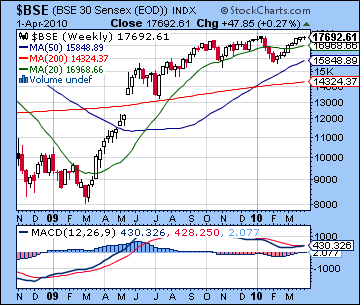
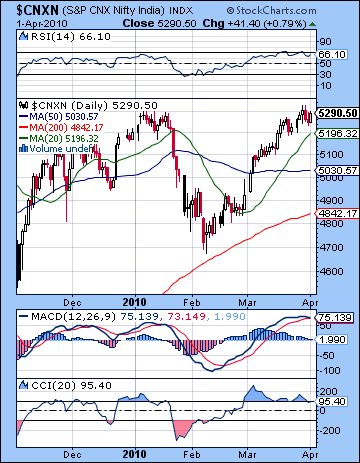 Stocks in Mumbai mostly treaded water last week as foreign buyers shored up any weakness in domestic demand. The Nifty closed fractionally higher on Thursday at 5290 while the Sensex finished the week at 17,692. This middling outcome was more or less in keeping with expectations, although I thought we might see a little downside probing. Certainly, the positive Venus and Mercury aspects with Uranus and Neptune did produce some gains. Monday was higher as predicted on the Venus aspect and we even saw a close above 5300. As expected, Tuesday’s Full Moon reversed the sentiment and we saw stocks pull back in the aftermath of the Venus aspect. I thought we would see a gain either Wednesday or Thursday and indeed the Moon-Jupiter aspect on Thursday pushed stocks higher. I had recognized this bullish aspect but did not think it could generate a higher close. Wednesday’s Venus-Saturn aspect was enough to take stocks down very modestly, although much of the bearishness was likely tempered by the Mercury-Uranus aspect. Overall, we had another week without clear market direction despite the new Aries influence from Venus and Mercury. Last week, I wondered if this effect might weigh on sentiment since Aries is associated with malefic Mars. I noted that it was likely to have more of a background influence that was less amenable specific predictions. Given the availability of bullish energy from the two positive aspects, the Aries effect may only be able to take markets moderately lower, and only then in the absence of any good planetary aspects. The Saturn-Uranus opposition becomes exact on 26 April and this is another medium term negative influence on prices. Like the Aries effect, it is harder to pin down in terms of likely times of manifestation. Prices may fall both before and after the exact aspect, although recent experience might suggest that the greater declines are more likely afterwards. This is what happened both in November 2008 and February 2009.
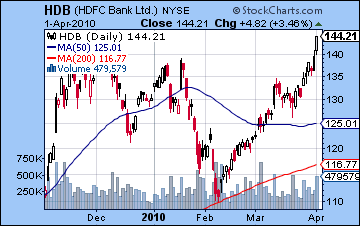
The technical picture remains mixed at best as last week’s marginal gain only equaled the January high. The prospect of a bearish double top therefore looms over the market. In the event of any pullback here, it would definitely increase the odds of a protracted correction. The likelihood of some kind of correction seems high given the daily MACD which is now showing signs of rolling over. It is barely in a positive crossover now although it should be noted that it is at a higher level than the January high, a possible sign of legitimate momentum. CCI (95) has already slipped out of the bullish zone but that should not be taken as a definitive in any way. RSI (66) is very bullish and appears to be trending lower although that should not preclude another up day or two. Bulls can point to a tiny bullish crossover in the weekly MACD that a more promising medium term trend may be at hand. It seems hard to be persuaded that this crossover has staying power given the apparent weakness in the daily MACD chart, however. These sorts of medium term indicators are best understood when reinforced with short term signals. Financials were strong this past week as evidenced in the HDFC chart (HDB). It broke out to a new high (144) which pushed it past its previous January high. While volume was strong, the viability of this breakout comes into question because the breakout volume was still lower than on several recent big down days. Resistance in the Nifty is still formidable around 5300 so any closes above that line are important. The rising price channel off the February low suggests support is around 5150-5200, which is near the 20 DMA. This would be the first line of defense for the bulls in the event of a pullback. After that, the 50 DMA at 5030 could also bring in new money and help support prices. It is worth noting that the 50 DMA is now more or less flat, as if poised to move in one direction or another. Below that, the 200 DMA at 4850 coincides with the rising channel of the recent lows and should also been seen as an important level of support.
 This week looks like a mixed bag with perhaps a greater likelihood for declines than last week. The early part of the week seems more bearish as an alignment between Mercury Mars and Pluto dominates the sky on Monday and Tuesday. The Mercury-Mars aspect is exact on Monday so that, on paper at least, this makes a decline somewhat more likely then. Nonetheless, the proximity of benefic Venus to this alignment may be enough to tease another day of gains before the bearishness takes hold. Just when we get a down day out of this pattern remains something of an open question. Tuesday is perhaps more problematic since the Moon conjoins Rahu and the Sun is in a square aspect with Rahu suggesting confusion or loss of confidence. Wednesday could go either way, although I would incline towards a down day, with weakness more likely at the close. A gain is perhaps more likely later in the week as the Sun forms a positive aspect with Jupiter. This aspect is exact early Friday so that may coincide with a positive open. Bullishness may slacken by the afternoon, however. While two days of gains are quite possible here, I think the bearish energy will rule the week so we will end lower. If Monday ends higher, then we could see the Nifty close around 5200-5300. If Monday is lower, however, we are likely going to see closes below 5200, perhaps near the 20 DMA.
 Next week (Apr 12-16) ,looks bearish to neutral with gains possible on Monday’s Moon-Uranus conjunction but weakness increasing with Tuesday’s Venus-Rahu aspect. The Sun enters Aries on Wednesday and that may also be a negative influence, albeit a background one. The remainder of the week looks mixed The following week (Apr 19-23) looks more bullish as Venus enters Taurus and then forms aspects with Uranus and Neptune on Friday. While Mercury turns retrograde on the 17th, it may not immediately affect markets one way or the other owing to a lack of aspects to other planets. There is an aspect with Rahu here but it looks a little too wide (2 degrees) to directly influence outcomes. In any event, Monday the 19th will likely reflect the influence of this aspect. The last week of April looks more solidly bearish as Mercury is in square aspect with Mars on the 25th and Saturn opposes Uranus on the 26th. In particular, I will be watching the Sun-Mars square from May 3-6 since this will also form minor aspects with both Saturn and Rahu. This pattern has the potential to take prices down sharply. We should also note that this transit pattern also hits some key planets in the NSE chart so it is somewhat more reliable as a bearish indicator. While the outlook seems more bearish in the near term, the month of May could see some recovery on the approaching Jupiter-Uranus conjunction. I am expecting a significant rally in the second and third weeks of May so we will see just how much bullish energy this Jupiter-Uranus conjunction can generate. If we see a correction ahead of that time, then this rally may not be sufficient to make new highs.
5-day outlook — bearish-neutral NIFTY 5150-5250
30-day outlook — bearish-neutral NIFTY 4800-5200
90-day outlook — neutral NIFTY 5100-5400
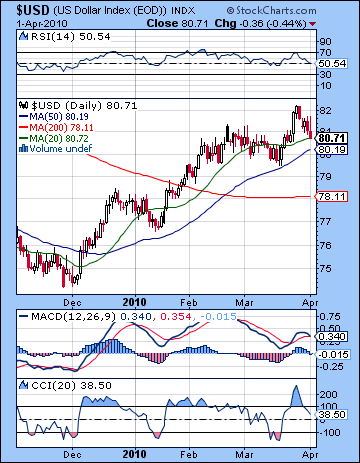 The US Dollar took a hit last week as commodities were back in favor on inflation concerns. After running up against its resistance level, the Dollar closed below 81. I had expected more upside here, although the down days did not come as a surprise. Monday’s decline in particular was very much in keeping with expectations as the Venus aspect increased risk appetite. As predicted, Tuesday was higher but prices failed to return to Friday’s levels. Wednesday was also down as expected as the Mercury aspect sent investors looking for more rewarding assets. My biggest error was Thursday as prices continued to fall despite some bullish signs in the USDX chart. Despite the pullback, the Dollar remains in a fairly good technical situation. Prices are now sitting a little above the rising support channel from the December low. This coincides with the 50 DMA around 80-80.5. Breaks below that level should be seen as significant interruptions in the Dollar rally and may well spell the end to this move. I do not think this is likely but it is nonetheless an important level that most traders will be watching. Daily MACD has just moved into a bearish crossover, although it sits higher than its previous low and thus this should be a seen as only a partial disconfirmation of the trend. CCI (38) is weakening here and could fall into the negative area before reversing higher. RSI (50) is declining and threatens to go into the bearish zone. Since previous down moves have been arrested around this level, I would not take any down moves too seriously unless they fell below, say, 45. As more evidence that this pullback is merely a pause in the rally, volume in UUP, the dollar ETF, has been significantly higher on up days and lower on down days. This suggests that the bullish trend is still intact as price rises are bringing in new buyers.
This week could see gains return although there will be down days also. Monday offers a reasonable chance for a gain as the Sun aspects the ascendant in the USDX chart. Tuesday and Wednesday are harder to call owing to a lack of clear aspects although with the Sun-Jupiter aspect building on Wednesday and into Thursday, we could see at least one significant down day there. Friday looks fairly bullish, however, as Venus and Mercury conjoin natal Rahu. Next week should see prices stay firm and perhaps rise higher although I am not anticipating any great gains here. Mid-April is looking more bearish however, so the down trend may continue into the last week of the month. Another rally is likely to take hold as we move into May. Another correction is likely from mid-May to early June. June should be quite bullish, however, with prices likely higher than current levels, perhaps towards 85.
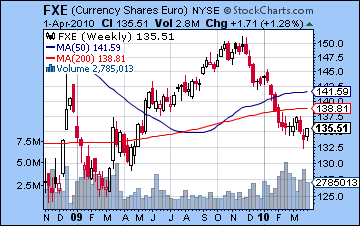 With sovereign debt fears moved into the background, the Euro gained last week closing near 1.35. As expected, Monday was higher on the Venus-Uranus aspect and Tuesday was down. But the bullishness took over the rest of the week as Thursday failed to produce any of the forecast selling. One possible explanation was that the normally bearish Mercury to Saturn conjunction was negated by the co-presence of Uranus in the same pattern. Multi-planet alignments can sometimes reverse otherwise negative aspects and coincide with bullish outcomes. Technically, the Euro is still in a weak position since it has not yet managed to rise above resistance in the falling channel off its December high. Resistance now sits just a little above the current price perhaps around 1.355. This roughly corresponds to the 50 DMA and should be considered a critical level. I do not expect this resistance level to be broken in the near term, but it may go by the wayside in May. Weekly MACD is still negative, suggestng that no significant change in the overall trend has occurred. This week looks more bearish for the Euro as the Mercury-Mars-Pluto alignment could increase fear levels early in the week. We can also expect a down day on the opposition aspect between the Sun and the natal Mars in the Euro chart which occurs Wednesday and Thursday. A better chance for gains will come in mid-April when Jupiter will aspect the Mercury-Jupiter square in the natal chart. The Rupee continued its recent strength as it moved below 45 for the first time since 2008. It seems more likely to consolidate this week.
Dollar
5-day outlook — neutral-bullish
30-day outlook — neutral-bullish
90-day outlook — bullish
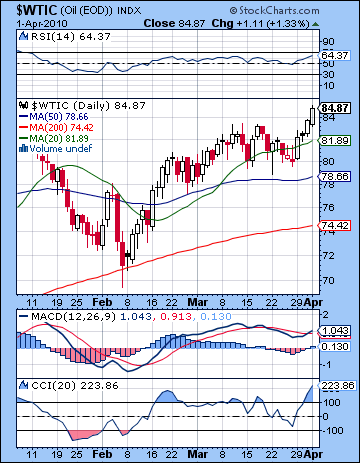 With recovery and inflation on everyone’s minds last week, crude jumped towards a new high for the year closing just under $85 on the continuous contract. While I had foreseen Monday’s big up day on the Venus-Uranus aspect, the extent of the move through the rest of the week was surprising. Tuesday only produced a very mild decline while Wednesday was up substantially on the Mercury-Uranus-Neptune pattern. Thursday was the back breaker, however, as new highs were put in on the Sun’s aspect to the natal Jupiter. This admittedly bullish influence completely overshadowed the negative effects of the Mars square to the natal Moon which I had expected to take prices lower. While the new highs are welcome news to bulls, it is interesting that they were made on only middling volume. The USO ETF shows how these higher prices may not have a solid base from which to launch a longer rally. Certainly, up day volume was higher than down day volume last week, but it was still very much within the 3-month average. Daily MACD is now in a bullish crossover, but we note a negative divergence with the previous high. CCI (223) is very bullish and RSI (64) is also bullish although it is moving into an area of overhead resistance where previous rallies have foundered. Resistance is likely around $86 which coincides with the rising upper channel from previous highs. Based on the bottom of the most recent rally off the February low, support is probably around $80-81. Breaks below that line may spark further selling. The 50 DMA has become a fairly reliable support level in recent months and it currently stands around $78.5. The 200 DMA near $74 may be considered another support level, although I would tend to lean towards $70-72 here since it refers to the rising trend line from previous lows. At this point, the earliest we may see this tested is in early May.
This week is another opportunity for the effects of the Mars aspect to the natal Moon-Saturn conjunction to manifest. It is possible that these were merely delayed from last week but there is no certainty on that score. Nonetheless, I do think that a bearish outcome is more likely this week with the early part of the week looking more susceptible to declines. Gains are still likely here, with the late week perhaps more favorable. I would not be surprised to see $80 tested. Next week looks mixed with the possibility of a rebound in the case we see some correction here. April generally looks mixed until the last week when there is a greater chance for declines. So we could see crude trade between $80 and $85 (or perhaps even $90) until the 26th after which is should fall. There is a chance we could see crude fall hard in early May but the evidence for that view still seems sketchy thus far. The rebound should be sharp, however, as Venus will transit Taurus and this is the first house of the Futures chart. Look for an especially sizable gain around May 14.
5-day outlook — bearish
30-day outlook — bearish-neutral
90-day outlook — neutral-bullish
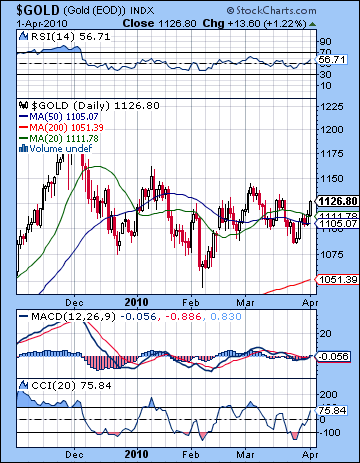 Gold awoke from its recent slumber last week on inflation worries and climbed 2%. It finished the week at $1126. I had been more bearish here, although I did correctly forecast some specific days. Monday was higher as expected on the Venus-Uranus aspect and Tuesday saw a small loss. Wednesday turned out to be higher, no doubt on the Sun aspect to the natal Jupiter, while Thursday saw a rise as per the forecast as Venus activated the natal Rahu in the ETF chart. Gold’s rise did not eclipse its previous high and therefore should still be seen weaker than other assets. Daily MACD is in the start of a bullish crossover, although it is still below the zero line. The overall direction in this MACD chart still looks to be down. CCI (75) is rising but recent rallies have seen only the shortest of durations over the +100 level. RSI (56) is bullish but it also seems mired at current levels since prices have struggled of late. Weekly MACD is still in a bearish crossover and confirms the notion that gold is not looking particularly attractive in the event of an economic recovery. Volume was also fairly average for the gains of Wednesday and Thursday and thus do not reflect any special enthusiasm for extending the rally much further. Gold closed near some important resistance at $1130. So far, it is adhering to a bearish pattern of lower highs. If it can close above $1130 this week, then that might encourage more buyers to come in. The next level of resistance would be near another interim high around $1160-1170. This would also correspond to the bottom of the rising channel dating back to the 2008 low. Support is likely found around $1090-1100 and the 50 DMA. Below that, the 200 DMA stands at $1050 so that should also be seen as a safety net that could bring in more money into the market.
This week looks fairly negative for gold as the Mercury-Mars aspect sets up in aspect to the natal Mars in the ETF chart. This is likely to be stressful for gold on Monday and perhaps Tuesday also. Overall, we should be net negative over those two days, perhaps by a lot. Wednesday is harder to call. On the bullish side, the Sun forms an aspect with the natal Mercury and Moon. But the transiting Moon’s opposition aspect to Mars seems negative. One possible outcome would be an up day but with more selling at the close. The Sun-Jupiter aspect should also produce some gains along the way, perhaps on Wednesday or even Thursday. Friday seems less positive, so another loss is more likely here. I would not be surprised to see gold fall below $1100 at some point here. Gold should rebound somewhat next week with April 15 and 16 looking like positive days. Things look more choppy after that although I would not expect any great declines until early May. So it is conceivable that gold will trade between $1080 and $1130 until May 3. It should drop after that, perhaps sharply. Some recovery is likely by May 14th as Jupiter will aspect the natal Sun in the GLD chart. Gold will fall sharply again in the last week of May and into early June. By this time, it is possible that the price may be under $1000.
5-day outlook — bearish
30-day outlook — bearish-neutral
90-day outlook — bearish

