Summary for week of August 1 – 5
- Stocks likely to remain weak into mid-August despite possible intermittent gains
- Dollar to remain mixed but with more bullish bias
- Crude could be mixed with bullish bias especially late in the week;
- Gold likely to continue bullish
Summary for week of August 1 – 5
- Stocks likely to remain weak into mid-August despite possible intermittent gains
- Dollar to remain mixed but with more bullish bias
- Crude could be mixed with bullish bias especially late in the week;
- Gold likely to continue bullish
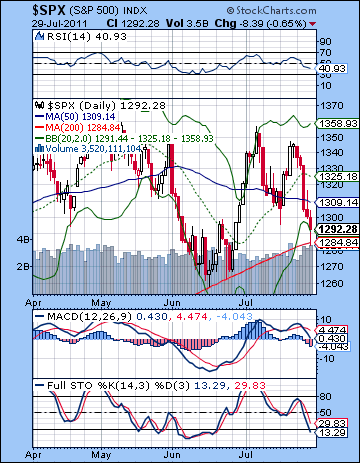 Stocks fell out of bed last week as soft GDP data and the mounting uncertainty over the debt ceiling debate undermined confidence. The Dow fell for five days in a row closing at 12,143 while the S&P500 finished at a lean 1292. This bearish outcome was definitely unexpected as I thought we had a good chance of seeing some upside in the second half of the week. I had been generally bearish for the first half as the entry of Mars into Gemini coincided quite closely with declines into Wednesday. I had been particularly uncertain about Wednesday as I thought there was a chance for a major move in either direction. Alas, it turned out to be negative while I was leaning positive. We did test support at 1320 on Wednesday but the downdraft was stronger that expected as support failed and the SPX closed below the 50 DMA at 1310. That technical failure seemed to overshadow all else as the market then drifted lower for the final two days of the week.
While I had been expecting some bearish surprises from these debt ceiling negotiations, I was mistaken in thinking that they would occur closer to the August 2 deadline. It seems that my timing was off somewhat as we are seeing negative fallout manifesting ahead of that date. Washington’s dysfunction is now on view for the whole world to see as the the various party factions are unable to compromise. What is interesting is how the Mercury-Neptune opposition slated for August 2 is already in evidence. Mercury (communication) turns retrograde on the same day as the deadline while it is opposite Neptune (confusion). Even now, Mercury has moved into an approximate opposition with Neptune so this may reflect the muddying the waters. Nobody seems to know just what the deadline is any more for a deal. August 2 had been the deadline for many weeks, but now it seems the President can extend it several days and thereby give a grace period for the two parties to hammer out a deal. Other commentators have suggested it could be even longer. What does it all mean and how will it all shake out? I honestly don’t know exactly how it will play out although I continue to believe that the deal will underwhelm or confuse. I had originally thought that the deal would get done but that it would be misunderstood or disappointing for the markets. Since I thought that a US default would be a catastrophe for stocks, I didn’t see this in the planets for the week ahead. However, it is possible that a US default may not be so bad after all, especially if it is piece meal or just a technical default for a few days. It seems it can all be papered over by a few strokes of the Obama’s pen. Alternatively, we could see some kind of deal, but US debt could be downgraded anyway and this could put more pressure on stocks as bond yields rise. The downside risks remain quite evident here so that even if we get a sudden relief rally if the Senate’s deal goes through over the weekend, the euphoria may not last very long. Mercury-Neptune is all about confusion and bad judgment so we are likely to see more evidence of that over the next week or two.
 The bulls and bears continued their game of hot potato last week as the bulls coughed it up big time. That falling trend line from the highs of 2007 and May 2011 turned out to be pretty important after all as Monday reversed lower from the open and the bears never looked back. Some of the intermediate levels of support did not hold either as the 50 DMA at 1310 was easily violated. All the bulls can claim is that the rising logged trend line from the 2010 low and the 200 DMA held quite nicely on Friday morning. The intraday low of 1282 slightly pierced the 200 DMA but the subsequent recovery was fairly strong as there were enough buyers who felt confident that Harry Reid could deliver the goods over the weekend.
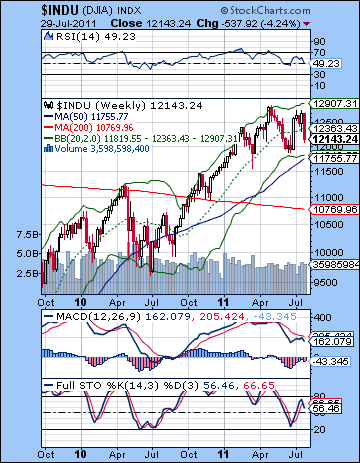
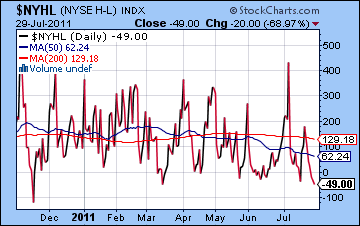
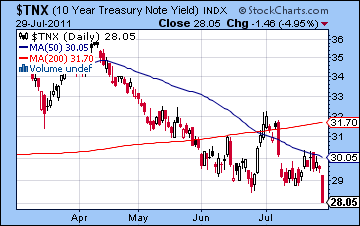
The daily SPX chart shows a series of lower highs and higher lows — the very picture of a range bound market that is seeking a new direction. An interruption of this converging price pattern will likely cast the die. The indicators do not provide clear evidence either way. RSI (40) is falling and looking quite weak and has some room to fall before becoming oversold. MACD is in a bearish crossover and is falling to the zero line. It could well have more downside. However, Stochastics (13) are oversold and once we see a crossover there, there will be less compelling support for further downside. This is especially true as long as support form the 200 DMA and the trend line around 1285 continues to hold. A close below that level would be quite bearish obviously, but until it does, the market seems primed for some kind of bounce. The high-low index also looks close to a bottom here suggesting that some upside is more likely than more downside, at least in the near term. Of course, this presumes that the size of the correction is more on the order of what we have seen in 2011 rather than the larger corrections of 2010. For a somewhat longer term perspective, the weekly Dow chart looks pretty anemic here as the recent rebound did not produce a bullish crossover. Since the 20 WMA (middle Bollinger band) did not hold, there is a somewhat larger probability of another test of the bottom Bollinger band at 11,819. This is only about 3% below current levels so it may not count for much. With the debt ceiling the center of attention here, all eyes are on treasuries and potential associated scenarios. In keeping with the soft GDP data, yields plunged to new lows of 2.8% on the 10-year. Clearly, bond traders are not very fearful that Uncle Sam will be able to pay on time as the slowing economy is taking precedence. It seems we’re in uncharted territory here as the bond market will eventually sort out the relative risks of another recession and the possibility of a US debt default at some point in the future. For the moment, it’s the risks of recession that are carrying the day. This is bad news for stocks as it sets up a negative divergence with respect to the previous June lows.
 It’s show time this week the debt ceiling deadline arrives on Tuesday. I am expecting some choppy action here as there are both bearish and bullish influences in play. Mercury turns retrograde late on Tuesday so that increases the likelihood of some downside near that day and it may well spill over into other trading days. The difficulty in predicting outcomes here is that the bearish Mercury-Neptune aspect could be offset with some fairly bullish Jupiter aspects involving the Sun and Venus. Monday could therefore go either way as the Sun-Jupiter aspect looks positive. Since there could be some hope of a Senate deal over the weekend, I would think Monday has a decent chance to be higher. Tuesday is harder to call, although I would think the bias would be negative as the Mercury-Neptune could assert itself once again. Wednesday could be more negative as the Moon forms an aspect with Mars. The late week Venus-Jupiter aspect offers some hope for a rebound although even here the Mercury-Mars-Neptune aspect does not look positive. The presence of this unusual stationary Mercury opposite Neptune makes it very hard to suggest a bullish outlook. And yet from a technical perspective, the market shows signs of being oversold here and this could produce some kind of relief rally. Perhaps the early week delivers some kind of deal that produces some rally back above 1300 to perhaps 1310 (50 DMA) and then sells off again for whatever reason. This could test support again at the 200 DMA at 1280. Where we finish the week is harder to call. Perhaps somewhere between 1280 and 1300 is most likely. That is a somewhat uninspired forecast and yet with influences in both directions, it may be the most prudent. That said, there is still significant downside risk here that is likely to manifest more fully next week. It could arrive ahead of schedule, although that seems unlikely.
 Next week (Aug 8-12) features a very nasty looking configuration involving Mars, Uranus and Pluto. This suggest unexpected or sudden situations that could involve disputes, conflict or violence. Worse still, the configuration occurs in a sensitive place in the USA horoscope. While it is conceivable that this will only correlate to a geopolitical or terror attack that does not have market implications, I think it is more likely that it will have market consequences. Declines would therefore be more likely here and there is a good chance they will be fairly sizable. Tuesday and perhaps Wednesday look the most bearish. The Sun-Venus conjunction towards the end of the week looks somewhat more bullish so perhaps that will signal a rebound. The larger question is whether support of the 200 DMA will hold. I think it could be in jeopardy here and that we could revisit the March lows of 1250, or maybe lower. This would be a major set back for the Bernanke rally. The following week (Aug 15-19) looks somewhat more bullish as the Sun and Venus will conjoin retrograde Mercury in the first degree of Leo. If the market has declined in the preceding week, then this has a good chance of representing the relief rally back towards previous support (1285?). Despite some downside from the Mars-Saturn aspect on Aug 25, the end of August could actually be net positive. Perhaps we will see a back test of that trend line at 1290-1320. That could set up another move lower in September and October as Saturn is in aspect with Ketu. A lower low seems the most likely outcome here, perhaps below 1200. A major rally is likely in late October and through November as Jupiter strengthens and forms aspects with Uranus and Pluto. But December and January look quite negative again so that will probably erase most if not all of the preceding rally. I would generally expect lower lows here, although that may be getting ahead of myself.
5-day outlook — neutral SPX 1280-1300
30-day outlook — bearish-neutral SPX 1260-1320
90-day outlook — bearish SPX 1150-1250
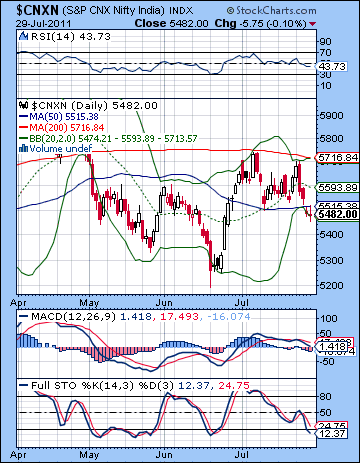 Stocks tumbled last week as the bigger than expected RBI rate hike conspired with the ongoing uncertainty surrounding the US debt negotiations. Despite Monday’s valiant test of the falling trend line, the Sensex slumped more than 2% closing at 18,197 while the Nifty finished at 5482. While I was correct in calling the early week decline on the Mars entry into Gemini for Monday/Tuesday, the subsequent rebound later in the week never materialized as the Mercury-Neptune opposition manifested somewhat earlier than expected. Tuesday’s fifty point rate hike caught many investors off guard and wiped out Monday’s gain and then some. I had been uncertain about Wednesday given the presence of mixed signals but the bears maintained control. I thought we could go below 5600 early in the week and I did not rule out 5500. However, that only occurred on Thursday, just at the time of an apparently bullish planetary pattern. As surprising as this protracted bearishness was, it was nonetheless in keeping with our medium term bearish expectations as bulls are unable to break above major resistance levels and so the market remains trapped in a trading range.
The inability of the market to rise at all last week may be a signal that Saturn may be strengthening a little ahead of schedule. Saturn is always there of course, but it’s influence on market sentiment waxes and wanes according to its interaction with other planets. In recent newsletters, I have suggested that we are in a holding pattern as the market is mostly range bound. This stalemate is reflected in the fact that neither Jupiter nor Saturn are predominant in the sky. My longer term view is that Saturn will assert itself more and more through the second half of 2011. This is one important reason why I think the market will tend to decline and we will see lower lows in the coming months. And yet I had thought that the next big move down might not occur until September when Saturn formed its very powerful aspect with Ketu, the South Lunar Node. Last week’s very bearish outcome offers some evidence that Saturn may become stronger at a somewhat earlier date in August. While I had generally expected the first half of August to be difficult for the markets, it seemed likely that the rebound in the second half of August would more than make up for the preceding decline. It could well be that rally attempts will tend to falter quickly, and will simply be opportunities to sell long positions and consider taking on new shorts. That has been my overall assumption for most of 2011 anyway, but I’m prepared to be underwhelmed by the upside in the weeks ahead. Given the political uncertainty in the US surrounding the debt crisis, we can now see how real world events might end up producing some of the bearish outcomes I am expecting for the next 6-12 months. A US default (very unlikely) or credit downgrade (more likely) will push upward pressure on their interest rates and this could weaken demand worldwide. It now seems global financial markets will only be able to avert another major sell-off if the Fed embarks on QE3. Even then, there is no guarantee it will produce the same bullish results that previous market interventions.
 It was a bad week for bulls as that falling trend line was tested but Monday’s rally was met by a wave of selling pressure that forced the Nifty back below its 50 DMA. As a result, we can see a series of lower highs going all the way back to 2010. Not only did the trend line resistance hold, but the 200 DMA also held firm as bulls could not push prices above that critical line in the sand. While one could still argue diplomatically that stocks were range bound, the falling 200 DMA makes this a somewhat scarier picture for bulls than for bears. Of course, to make it more bearish we would have to see lower lows. We aren’t quite there yet, but the technical picture suggests we could get there before too long. 5200 could act as support for a while, but 4800 is looking like more reliable support in the event of a deeper correction.
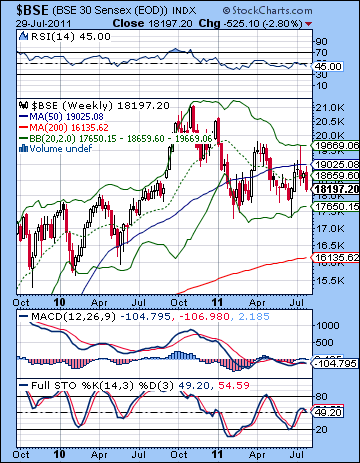
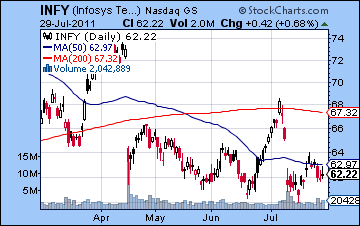
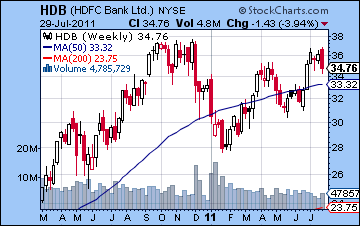
The short term picture suggests the market may be close to being oversold. Friday closed at the bottom Bollinger band while Stochastics (12) are deep into oversold territory. It may be too early for a reversal, but once there is a crossover there, it could very well signal a technical bounce. But RSI (43) is falling and below the 50 line suggesting a bearish mood may have overtaken the market. Given the recent touch of the 70 line in early July, there is a somewhat greater chance that we could revisit the 30 line sooner rather than later. MACD is in a bearish crossover and is about to head south of the zero line. The weekly BSE chart reflects the more neutral range bound assessment as MACD is flat and cruising along just below the zero line. Stochastics (49) are very much in between overbought and oversold without any compelling reason to favour one or the other. Resistance is likely offered around the 50 WMA at 19K while support is likely found near the bottom Bollinger band at 17,650. Infosys (INFY) suggests that it could be close to a bottom as it suffered only minor losses last week. As long as the low of 18 July holds, it may attempt another rally to recapture the 200 DMA. At the same time, investors may be fairly skittish here as the 200 DMA is now clearly sloping downward. HDFC Bank (HDB) has fared somewhat better than its financial sector counterparts. Despite a losing week, it did make a brief retouch of the recent high at $36. This is only a couple of per cent lower than the all-time high set in late 2010. A breakout higher would be very bullish but given the current climate, many investors may be cautious as we could be on the verge of a forming a bearish double top.
 This week will feature a range of aspects that could move markets in both directions. The most important aspect will likely be the Mercury-Neptune opposition which will be in effect all week. Mercury-Neptune aspects symbolize confusion, deception and bad judgment so it is perhaps fitting that this aspect should be dominant as the deadline for the US debt ceiling arrives on Tuesday 2 August. I expect there to be continued fallout from this ongoing political impasse in Washington so we should be on guard for more market uncertainty. Mercury turns retrograde near the open on Wednesday so that could be focus on that bearish energy. Monday could also be bearish as the Moon conjoins Mercury. There could be some upside possible from the Sun-Jupiter aspect that is exact late Monday and early Tuesday. Most likely this will manifest in a rise Tuesday, although it could conceivable produce a gain Monday. The late week looks somewhat more bullish as the Venus-Jupiter aspect should produce at least one up day on either Thursday or Friday. While I would not be overly shocked with a small rise this week, I tend to think that the difficult situation of Mercury this week favours the bears. If Monday is lower as I expect, then it is important for the bulls to get a rally on the Sun-Jupiter aspect on Tuesday. Wednesday’s probable bearishness may more than offset any preceding gains, however. There is a reasonable chance we could test 5400 here. The least likely scenario would be a strong gain, say above 5600. While one or two days of gains are likely, they are unlikely to erase the previous days’ declines.
 Next week (Aug 8-10) looks bearish again as there is a very difficult configuration of Mars, Uranus and Pluto. This combination symbolizes disputes, sudden events and violence so it is possible the markets will have to make some quick adjustments to changing circumstances. While this alignment does not directly afflict the BSE horoscope, I think it is unlikely that Indian market will escape the damage. Some downside therefore seems likely here. It is possible that lower support levels could be tested, including 5200. The following week (Aug 15-19) could begin more positively as the triple conjunction of Sun, Mercury and Venus is likely to generate some enthusiasm, perhaps a relief rally after a preceding sell-off. But more downside looks probable as the Mars-Saturn square of 25 August is likely to induce some serious selling. We could very well test the lows of the year (5200) here and I would not rule out still lower prices. Some rebound is likely in the final days of August and early September which could back test support, including perhaps a rise to 5200-5400. But the second half of September could be very bearish indeed as Saturn sets up in aspect with Ketu. By early October, the Nifty could easily be down to 4800. Some rally is likely through November with could be quite strong given the Jupiter aspects in play. I don’t expect it will alter the basic bearish pattern, although it may entice just enough hopeful bulls in the market before the next leg down begins. December and January 2012 look quite bearish given the Jupiter-Saturn opposition aspect.
5-day outlook — bearish-neutral NIFTY 5300-5500
30-day outlook — bearish NIFTY 5200-5400
90-day outlook — bearish NIFTY 4800-5100
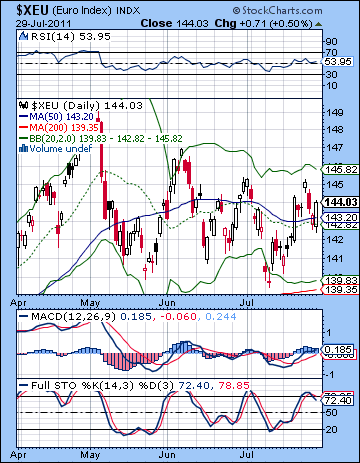 Despite the dysfunctional family drama unfolding in the US last week, the Euro only made slight gains closing just above 1.44. The USDX made its low on Tuesday before recovering somewhat to 73.9 while the Rupee ended the week at 44.11. I had expected the Euro would see further upside although I was expecting more of it to occur later in the week. As it happened the up days were more spread out, although Friday was strongly higher. Ironically, the fallout from this debt wrangling may be a higher Dollar as investors seek safe haven. Even in the event that the US credit rating is downgraded regardless of what kind of deal is struck, the Dollar will likely benefit as the upward pressure on interest rates would reduce the risk trade and put pressure on the Euro. Despite the modest gains this week, the Euro remained trapped in a recent trading range. It closed Friday just above its 20 and 50 DMA but after its recent trip to the upper Bollinger band one wonders if it is merely on its way to visit the bottom one in due course. The bottom band at 1.40 is also very close to a series of recent lows that should provide decent support. Finally, the 200 DMA is also right there to add to support just above 1.39. It’s unclear if the next test will be enough to break it, but if it does break, it could begin a major move lower. While MACD is in a bullish crossover, Stochastics (72) has recently come down from being overbought. It’s not exactly a compelling reason to buy the Euro.
This week the Mercury-Neptune could be problematic for the Euro as the debt debate may or may not find resolution. The midweek period looks somewhat more bearish here as Mercury reverses direction late Tuesday. Monday and Thursday could therefore be more positive as we will get some short term Jupiter influence from the aspects of the Sun and Venus, respectively. Next week looks even more bearish for the Euro as the Mars-Uranus-Pluto alignment could produce a sudden move towards the Dollar. It is possible that the next two weeks could unfold with this week being mostly flat and a big decline next week. The Euro should be net negative across this two week window, however. It is unclear if support at 1.39-1.40 will hold. At this point, it seems that it will. Some upside for Euro is likely around the Jupiter station on August 31. This may well test resistance at 1.44 once again and it could conceivably move higher into early September. But by mid-September, the trend will once again be down, with some serious downside more likely in the second half of September and into October. It is this time that we could see 1.30. After some rally attempt, another swoon is likely in December and January and the Jupiter-Saturn aspect. 1.20 is definitely possible by early 2012.
Dollar
5-day outlook — neutral-bullish
30-day outlook — neutral
90-day outlook — bullish
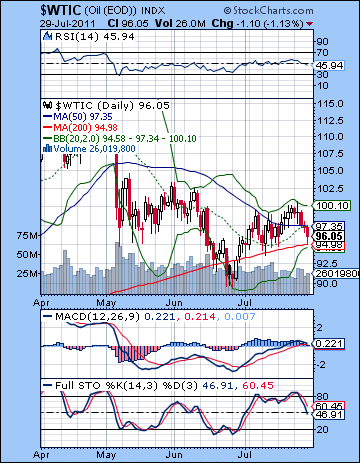 Crude oil slumped last week as the uncertainty surrounding the debt ceiling negotiations undermined demand prospects. Weak GDP numbers out of the US did not help matters either, as crude closed near $96. While I thought the early week could see a retracement back to support $97, the late week rebound never happened as the Mercury-Neptune began to manifest its bearishness ahead of time. As a result, my forecast for a close above $100 was very much off the mark. Instead, we can see that bears have once again wrestled control from the bulls as the $100 resistance held quite well. All of a sudden, the crude chart looks more bearish in the intermediate term since we see a series of declining highs. We can still detect some support from the 200 DMA at $95 but it’s unclear how solid this will be. One one hand, it does correspond with the lower Bollinger band so that could bring in new buyers. However, Stochastics (46) are nowhere near oversold which suggests that the bears may take crude lower. Even more ominously, MACD is on the verge of a bearish crossover. RSI (45) is trending lower and has a long way to go before being oversold. In other words, there are significant downside risks if we see a close below the 200 DMA.
Despite the difficult technical picture, the astrology this week looks somewhat favourable for crude. There will likely be some down days here, perhaps on Wednesday as Mercury turns retrograde. Monday is also a question mark as there is a negative looking hit in the Futures horoscope. But the Jupiter aspects here ought to prevent further significant downside and could even end up boosting it above current levels by Friday. Next week looks more bearish, however, as the Mars aspect with Uranus and Pluto could see a sudden drop that once again tests the 200 DMA. It is possible we could test the previous low of $90 at that time. The second half of August doesn’t look much better actually as the Mars-Saturn square aspect of Aug 25 will have a bearish set up on the Futures chart. This adds to the likelihood that we will see more downside and the possibility of a close below $90 by the end of the month. The general trend looks down going into September and October. A rally in early September is possible although I’m not sure it will do more than delay the inevitable. After a possible interim bottom ($80?) in early October, there are a number of Jupiter aspects with Pluto and Uranus lasting into November that should correspond to a significant rise. By December, the up trend will reverse and a new corrective phase will begin.
5-day outlook — neutral-bullish
30-day outlook — bearish
90-day outlook — bearish
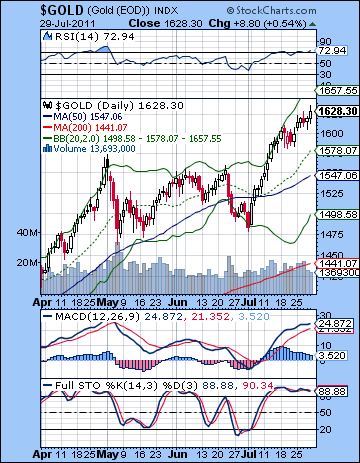 As anxiety from the US debt talks enveloped the financial world last week, gold was one of the few winning asset classes. Gold rose almost 2% on the week closing near $1630. This bullish outcome was in keeping with expectations as I thought the combined aspects involving the Sun and Venus would be enough to offset any negativity. The early week Mars ingress into Gemini exacted little damage on bullion as Friday’s Venus-Mercury aspect corresponded with the best gain of the week. With the US unlikely to get their debt under control any time soon, inflationary fears are likely to continue. This will only further feed the appetite for gold as a safe haven. The only possible end to the bull market in gold will come about if there is a broad-based sell off in most assets that forces investors into the US Dollar as they liquidate holdings to cover losses. We don’t seem to have arrived at that point in the game just yet. Gold continues its relentless climb here although there are more signs that it is getting overstretched. It’s way above its 50 DMA and may be due for a pullback at least to that level ($1547). Daily RSI (72) is again overbought, as is the weekly RSI (71) (not shown). MACD appears to be leveling off here and may be primed for a bearish crossover in the not-too-distant future. Stochastics (88) are also overbought, although that is definitely nothing new. Resistance may well be close to the Moon (as in "how high the Moon?") but support is initially close to the 50 DMA at $1550. Below that, the rising logged trend line off the 2009 penultimate bottom comes in around $1500 and the 200 DMA stands at $1440.
This week looks generally bullish for gold. Despite the potential for some downside around the Mercury retrograde station on Wednesday, the Sun and Venus aspects to Jupiter this week would suggest that more upside is likely. We could easily see $1650 with corresponding gains in silver also. Next week could see more damage inflicted by the Mars-Uranus-Pluto alignment. The Sun and Venus are still strong in conjunction in Cancer but this Mars aspect could shake things up a bit. There should be a decent pullback, although somehow I doubt it will test support at $1550 and the 50 DMA. We shall see. The triple conjunction of Sun, Mercury and Venus on August 16 is likely to be bullish again and this could begin another rally that extends into the first week of September. Higher highs are a likelihood here as Jupiter stations on August 31. The gold story gets a little murky after that so I would expect more sideways trading through mid-September will some downright bearish moves as we go into October. If there is going to be a breakdown in key support at $1500-1550, this is the first good time when it would occur. Late October and November look bullish again as Jupiter returns to dominance. How high that bounce will go is hard to guess. It could be a higher high than the high we see in late August-early September, although I would tend to doubt it. December and January are looking pretty bearish so that has a decent chance of taking out the October low. In any event, the first half of 2012 looks mostly bearish.
5-day outlook — bullish
30-day outlook — bullish
90-day outlook — bearish

