Summary for week of August 8 – 12
Summary for week of August 8 – 12
- Stocks likely to fall further in first half of week on nasty Mars alignment; rebound possible by Friday
- Dollar may rise further as Euro tests support by midweek
- Crude bearish into midweek with some recovery later
- Gold more vulnerable to early week declines although rally should stay intact
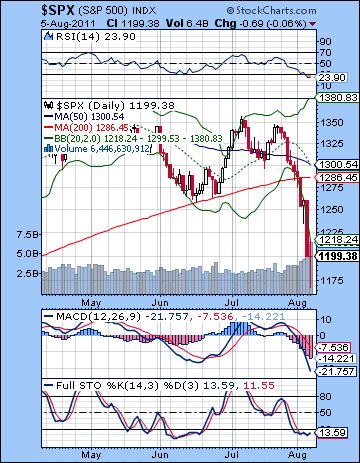 It was a game changing week to be sure. After all the drama and uncertainty leading up to the debt ceiling deal, investors decided that the brave new world of austerity and reduced government spending wasn’t so rosy after all and sold en mass. Stocks had their worst week since 2008 as the Dow lost more than 6% closing at 11,444 while the S&P500 finished the week at a very lean 1199. Never in my most bearish fantasies did I expect the August sell-off to be this swift or this severe. While I had a generally bearish outlook for the first half of August, I expected we would see a larger decline this week (Aug 8-12). As sometimes happens, the planets do not quite play out in the precise way one expects them. As it turned out, that Mercury-Neptune aspect was devastating for the markets. Mercury stationed late on Tuesday and so it more fully absorbed all of that negative energy from Neptune. Mars joined the alignment by Thursday and the rush to exits turned into a stampede as the Dow lost 500 points. For all the gloom, there were some hints of optimism along the way as I suspected there would be. There were unable to reverse the tide, however. Monday’s Sun-Jupiter aspect didn’t last much longer than an hour or so at the open as the halo from the debt ceiling compromise quickly vanished. The late week bullishness from the Venus-Jupiter aspect manifested quite feebly on Friday as the market barely eked out a gain after Thursday’s slaughter.
This market is definitely not in Kansas anymore. As expected, the debt ceiling deal underwhelmed and exposed the structural weaknesses of the US economy. With the government now facing a much stricter austerity regime, Obama and the Democrats seem unable to make the case for more taxes and more intervention in the economy. Since the rally of the past two years was largely based on a panoply of stimulus measures and the Fed’s QE1 and QE2 programs, investors are wondering who will save them now. The implication of the trillions in US government debt is now starting to sink in as Uncle Sam may be limited in the extent to which it can bail out the markets. All that goosing and priming of the market by Bernanke and Obama over the past two years can no longer be counted on as the markets may have to confront the cold hard facts of another phase of de-leveraging and debt destruction. In the harsh logic of capitalism, the losers must lose. Governments had been able to protect some of the losers for a while, but time seems to be running out on that approach. This strongly argues for further declines in the value of most asset classes including stocks, bonds (eventually), as well as the currencies of countries that can no longer manage their debt levels. The speed and size of the decline has some commentators wondering about QE3, and the prospects for a a new round of Fed easing. While this is possible, it is unlikely to have the same bullish impact on the market as before. Stimulus measures are unlikely to be as comprehensive given the balance sheet constraints of the US. Also investors now may be less willing to believe that more stimulus is the answer to the problem of anemic growth. From an astrological perspective, a major new injection of money usually requires a stronger Jupiter presence in the sky. While there should be some Jupiter-like boost in the second half of August around the retrograde station on Aug 30, I’m not convinced it will be a significantly large program in the way that QE2 was. October-November is perhaps a better bet for expecting some new Fed initiative to support the economy and boost markets when Jupiter is strong through its aspects with Pluto and Uranus.
 All the technical damage inflicted by the sell-off suggests that the bull market could be over. The linear rising trendline at SPX 1280 now seems like a distant memory as several key support levels simply melted away with the sell-off. With both of the logged (1340) and linear (1280) rising trend lines now gone, the best long term investors can hope for is for a period of sideways consolidation before the market finds a bottom and resumes its climb. Perhaps bulls are looking longingly in Ben Bernanke’s direction this weekend as he may hold the key to any sustained rebound rally as the Fed’s FOMC meeting is scheduled to release its statement at 2.15 on Tuesday afternoon. Aside from such divine intervention, the bulls can perhaps point to the 200 DMA which is only now just turning flat. If the markets reverse higher in the near term, the 200 DMA may resume its climb and thereby provide some plausible evidence for a continuing bull market. But that’s not much to go on. Of course, the market is oversold by most measurements, but when there is widespread panic, that may not be a very reliable signal for a rebound.
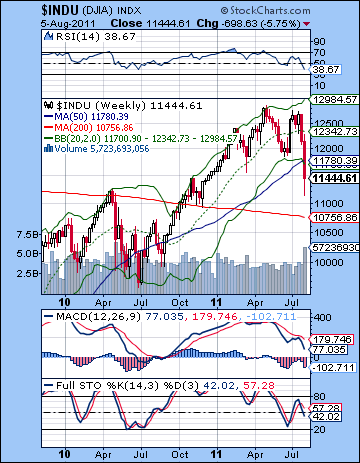
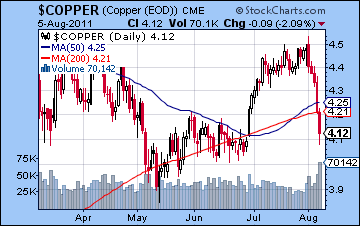
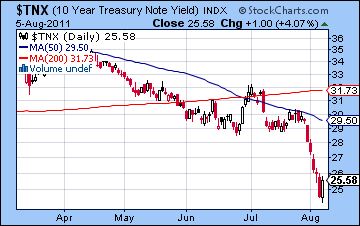
With 1280 taken out, and the previous March bottom of 1249 also taken out, where is support here? Friday’s intraday low tested the bottom target of the H&S pattern at 1150 when it touched 1168. We also had a brief flirtation with the neckline at 1250 on Wednesday but then the pattern largely played out to its downside target. We could well revisit this intraday low in the week upcoming with 1150 quite possible. 1200 may also be acting a support as Thursday’s decline halted at this level and Friday finished there also. We can also see some horizontal support dating back to mid-2010 around the 1120-1130 level which would become important if the SPX broke through 1150. Below that, of course, lies the lows from 2010 at 1040 and 1010. I honestly don’t think we will be testing 1040 until September or October but there is a chance they could arrive much sooner. In situations of extreme panic, fear can sometimes feed off itself so that lower prices simply leads to more selling as mutual fund redemptions force institutions to liquidate their positions and attempt to lock in whatever is left of their long term gains. In the event of a rebound rally, resistance will likely first be seen around 1220 and then 1250. A rally to either of these levels will likely invite more selling and shorting by active investors. Longer term, we may anticipate a back test of the rising trend line at 1280 although that seems to be somewhat fanciful at this point. The weekly Dow chart suggests that another area of support might be the 200 WMA near 10,756. (This equates to about 1150 on the S&P) This was resistance during the early stages of this bull market so it may turn into support in the event we get more selling in the days and weeks ahead. While this decline is oversold on the daily chart, the weekly chart suggests there is more downside to go before we reach that level, including on the more sensitive Stochastics chart. The volume spike for the week echoes the correction of May 2010 and is another clue that we are entering a new bearish phase. Copper finally sliced through support from its 200 DMA on Friday and this was another sign that the world economy is slowing. It will likely require a new low below 3.90 to confirm this technical breakdown. In any event, it offers more evidence that a correction is underway. Amidst all the carnage, frightened investors fled to the safety of treasuries as yields on the 10-year fell below 2.5%. While this confirmed the bearish move in equities, it may find some support from the rising trend line from its 2008 low on the weekly chart. A break below current levels would be quite deflationary and likely force the Fed to act and take new easing measures. Lower yields now seem unlikely given Friday’s stunning downgrade of US debt by Standard and Poor’s. It is possible that we have just seen the top in treasuries and bonds. All of this creates a somewhat mixed technical picture with a bounce may be just as likely as more follow through on the downside.
 This week could be another critical one in the markets as we will see the effects of a potentially dangerous Mars-Uranus-Pluto alignment. As I have noted previously, the Uranus-Pluto square is a long term bearish aspect that began this year and will last through to 2013. If Saturn is bearish, this aspect is super-bearish. Due to the slow velocity of both Uranus and Pluto, the last square aspect occurred in 1931-1932. Not exactly a banner year for the stock market. Similar sorts of economic hardship and dislocation are possible this time around. When faster moving planets line up with this aspect, it has the potential to manifest some of its energy. The presence of this Mars-Uranus-Pluto t-square alignment at this time was the key reason that I have been forecasting a bearish period for the markets in early August. Last week’s action may have released some of this negative energy already but I think there is more downside to come. And now the S&P downgrade of US debt offers a plausible cause for more selling as investors react to the news. It is possible that the alignment will manifest as a violent (Mars) military or incident or accident that has only limited market consequences. That is quite possible although the debt downgrade now looks like a more worthy candidate for this pattern. Not violent in the conventional sense, but quite sudden and shocking in its own way. This is the first downgrade of US debt in its long and illustrious history. The closest aspect occurs on Tuesday and Wednesday. This is interesting because the Fed’s statement occurs on Tuesday at 2.15 p.m right in the middle of that nasty pattern. It is therefore possible that the Fed’s statement will disappoint investors, perhaps by lacking any concrete plans to intervene in financial markets. It’s a tough call here since I would acknowledge it is possible that markets could fall ahead of the 2.15 meeting on Monday and Tuesday and then rally afterwards and continue to rebound for the rest of the week. While that is a possible scenario, it does not seem probable to me. There is a decent Moon aspect to the Sun and Venus that could conceivably produce a positive open on Monday but I suspect it won’t hold as the Mars aspect takes effect. Tuesday looks quite negative as the Moon lines up opposite Mars suggesting anger and frustration will be in the air. This could be directed at the Fed for what it does or what it doesn’t do. Wednesday could be a selling climax as the Mars-Pluto opposition is at its closest. I would also not rule out a reversal day on Wednesday. Thursday and Friday look less incendiary so that augurs well for some kind of rebound by the end of the week. It’s hard to say how low we will go. This aspect is at least as strong as last week’s on paper if not more so, so I would not rule out anything including a crash. But Bernanke is a bit of a wild card here that would have me hedging my bets a little in terms of a possible turn date. So I would tend to think 1150 is quite doable here, if not 1120. No doubt the market will have its own ideas but I would be quite shocked if we didn’t make another one or two daily closes significantly below 1168. We shall see!
 Next week (Aug 15-19) is a good candidate for more upside as there will be a triple conjunction of Sun, Mercury and Venus on Tuesday. A Mars-Jupiter aspect on Thursday is likely to boost risk appetite which should also be positive for stocks. So we could see a significant rally here, perhaps as much as 5% for the week The following week (Aug 22-26) starts off very bullishly on the Sun-Venus-Neptune alignment but some of those good vibes may fizzle by the end of the week as Mars forms a square aspect with Saturn. This is an extremely negative pairing that could erase a lot of the preceding gains. Aug 25-26 are the most bearish looking days in that respect. I don’t think it will be enough to break the rebound rally but it will likely put a major dent in it. There will likely be more downside on Aug 30-31 as Mercury is in aspect with Rahu while the Mars-Saturn aspect continues to percolate. We could see some upside in the aftermath of the Jupiter retrograde station (Aug 30) that lasts into mid-September. But the situation will likely turn negative again by that time due to the Saturn-Ketu aspect. This window looks worst for the last week of September and first week of October. A significant bottom is possible on October 14 on the Sun-Saturn conjunction. This is likely to be lower than any low we see in August and it may well test the 2010 low of 1010. Then a rally is possible, either through QE3 or just a natural snap back after some major selling that takes us into November. The rally could even extend into December and is likely to be significant. But the mood should darken again by January at the latest and the Jupiter-Saturn opposition. This is a bearish influence that could mark another corrective phase that lasts for up to two months. Whether this fulfills the promise of a bear market and a lower low is less clear, although I would expect that. Gold and silver are likely to partake in the correction so it could be fairly significant. Another move higher is likely from March to June but the second half of 2012 is looking very bearish. This could be the final washout for stocks and who knows where the Dow will be at that point. I definitely think it will be below 10,000 in 2012 and it could test its March 2009 lows of 6500.
5-day outlook — bearish SPX 1120-1180
30-day outlook — bearish-neutral SPX 1180-1250
90-day outlook — bearish SPX 1000-1150
 Stocks fell prey to more global headwinds last week as the European debt crisis threatened to spread to Italy. After Monday’s gain, the Sensex fell for the next four sessions closing at 17,305 while the Nifty finished at 5211. While I had been generally bearish last week, I underestimated the extent of the sell-off. The early week advance coincided fairly closely to the Sun-Jupiter aspect, even if this arrived a little early for Monday. But the difficult Mercury-Neptune opposition aspect prevailed over the middle the week and this reversed sentiment and took stocks lower. I thought that some of the fallout would be the result of the US debt ceiling deal on 2 August and this proved to be only partially correct. I thought the post-debt ceiling fallout would be the result of a lack of clear resolution, rather than a simple case of "selling the news." The late week Venus-Jupiter aspect did not manifest in any gains at all, however, as the growing gloom over the world economy took hold.
In my conservative projection last week, I thought we could test 5400, thinking that we would leave 5200 for the following week. As it happened, the bears have taken firmer control of the market somewhat sooner than expected. Of course, I have suggested previously that the the first half of August would be bearish and that forecast is definitely coming to pass as a wave of panic has swept over international markets. Saturn’s pessimistic and austere influence is growing as it is finally dawning on many investors that the future does not look as bright as once hoped. The US debt deal revealed the nature of the current problem: America must reduce its borrowing or else it would risk higher interest rates from an increasingly skeptical bond market. This lack of fiscal flexibility is a potential problem for equities since markets have relied on government stimulus measures to boost demand and liquidity. With the US now painted into a corner, there is a realization that investors may not be able to count on government largesse as they have over the past two years. In other words, the stock market is being left to sink or swim on its own. This is not to say that the Fed may not launch QE3 at some point in the future. But it may be both less sweeping and less effective than previous interventions as US fiscal constraints limit Bernanke’s hand. All of this is by way of confirming my expectation that there are lower lows ahead for the rest of 2011 and 2012. Recent developments now provide some real world evidence for the notion that the world is entering a significant new economic contraction that could well rival 2008-2009. As I have stated in previous newsletters, the Uranus-Pluto square may be the underlying cause behind all this economic chaos as the current capitalist order is undergoing fundamental reorganization. This aspect is a long term influence which lasts into 2013. I would therefore expect markets to stay vulnerable through that date.
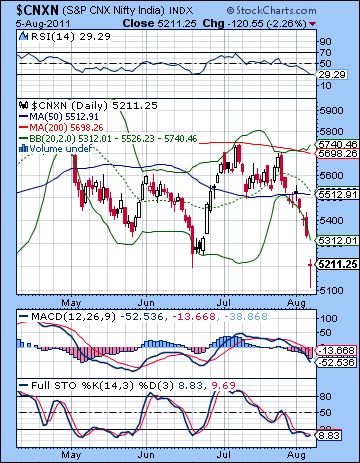
 It was a good week for bears as Monday’s gain failed to hold above the 50 DMA (5512). The failure to hold onto to this middle range level allowed bears to move in with vengeance and take the market lower. Support at 5400 also did not prop up the Nifty as the late week action saw intraday prices plunge to new lows for 2011 below 5200. This technical breakdown also negated the possibility of a potentially bullish inverted head and shoulders pattern forming at 5328 (RS). Friday’s hammer candlestick could be seen as a potential reversal but it first needs confirmation to the upside. The bulls may also take some solace in the fact that the market is oversold by two different indicators. The RSI (29) is now below the 30 line for the first time since February and offers some evidence that the market is close to a temporary bottom. Stochastics (8) is also oversold. MACD remains in a bearish crossover but we can see a positive divergence with respect to previous lows from May and June. Just how salient this divergence will be is unknown as the trend may continue to prevail in the short run.
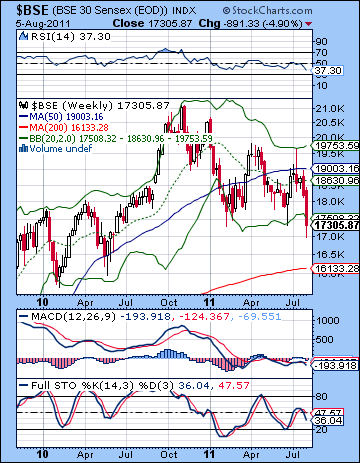
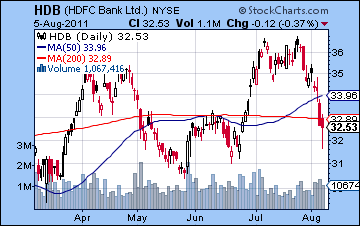
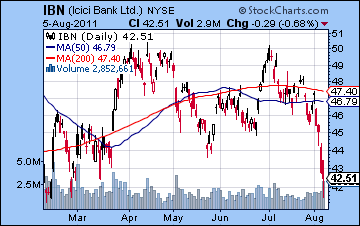
While the Nifty traded at a new 2011 low, it is basically forming a triple bottom here. It may find support near current levels in the near term. If it does not, it could quickly retest the low from May 2010 at 4800. Friday’s trading created a larger gap towards 5300 so that could be a magnet for some bullish action also. It may also become significant resistance at 5320 in the event of any rally attempt. Above that, the 20 and 50 DMA at 5500 would likely be the next level of resistance. But the 200 DMA continues to slope downward and thus creates underlying bearishness that bulls have to confront. The weekly BSE chart shows how price closed below the lower Bollinger band. This line has acted as support in the past, although it could take several weeks of riding this line lower before a substantial rally comes together. If this level does not hold, then the 200 WMA may act as the next level of support at 16K. This is well below the May 2010 low so this may be more of an intermediate technical target. Even though this more recent pullback has been substantial, there is more room on the downside. RSI (37) is not yet oversold on a weekly basis and Stochastics (36) may require more downside before it also becomes oversold. After its recent impressive run-up to resistance, HDFC Bank (HDB) retreated to close below its 50 and 200 DMA. It was a dramatic reversal of momentum. Perhaps the recent double top in July had made such a retracement more likely. Failure to close above current levels at the 200 DMA may invite more investors to unwind their long positions. ICICI Bank (IBN) fared little better as an early test of resistance changed into a widespread sell-off which challenged the February low. If that does not hold, then the next firm level of support would be the 2010 low which is about 15% below the current price.
 This week is dominated by another very difficult configuration. Last week’s Mercury-Mars-Neptune took stocks sharply lower while this week sees Mars make another appearance but this time with the Uranus-Pluto square. These three planets will form a t-square alignment where each is separated by 90 degrees. It is a very negative pattern that often marks situations of frustration, conflict, and violence. As I noted above, the Uranus-Pluto square is a key underlying planetary influences and the fast-moving Mars has the potential to draw out some of its inherent bearishness. This aspect is closest on Tuesday and Wednesday. Wednesday looks somewhat more bearish due to the addition of the Moon into the mix as it opposes Mars. This is a highly volatile mix of planets that has the potential to take markets sharply lower. I would not rule out a crash here, although I realize that is somewhat unlikely given how oversold the market is. Monday offers the hope of some bullishness, however, as the Moon forms an aspect with the Sun-Venus conjunction. This is a short term aspect so it’s unclear if it will be sufficient to keep the markets green by the close, especially as markets react to the US debt downgrade. The end of the week looks somewhat less bearish, so we could see some kind of rebound on Thursday and especially on Friday. Overall, however, there is a good chance for another down week. If Monday is higher, then bulls may attempt to fill that gap at 5300. That would be quite a tall order given the current level of bearishness. But even if they manage to close the gap, the midweek looks pretty bad so we are likely to see 5100 taken out and 5000 may well in the cards. The intensity of this alignment is difficult to gauge so I would not rule out any particular support level, including 4800. At the same time, I do acknowledge that there is a chance that this planetary pattern may be somewhat less negative for markets than expected. Perhaps its negative energy will pertain to a military situation or natural disaster that does not have relevance for financial markets. It’s always a possibility although the S&P downgrade of US debt may well be a manifestation of this type of shocking and disruptive energy. And given the extent of the bearishness last week, it may be that some of that energy has manifested early. With those caveats in mind, I do think the most probable outcome is for more downside.
 Next week (Aug 15-19) will likely extend the recovery rally as the triple conjunction of Mercury, Sun and Venus on Tuesday and Wednesday is likely to boost sentiment. Monday is a little uncertain due to the presence of the Sun-Rahu aspect, although this could well turn out to be positive also. Thursday could also tilt bullish as the Mars-Jupiter aspect could increase risk appetite. Overall, this week looks quite positive. The following week (Aug 22-27) could begin well enough on the Sun-Venus-Neptune pattern. This could be rally back into previous resistance. But Mercury ends its retrograde cycle at the end of the week while in aspect to Rahu. This is likely to make markets more negative. The second half of the week will have the added burden of a tight Mars-Saturn square aspect. This is exact on Thursday but its bearish influence could overflow plus or minus a day. This Mars-Saturn influence should be enough to offset any previous bullish moves in this week While it’s very negative, I’m less certain it will be enough to create new lows. I suspect that the probable rally from Aug 11-23 will be larger than any down move around this particular aspect. The final days of August and first days of September could be quite choppy as late August looks positive but the first days of September look quite bearish. The first half of September could have a bullish bias in the wake of Jupiter’s retrograde station on 30 August. This does not look hugely positive, however. Then the second half of September is likely to be more solidly bearish as Saturn forms its aspect with Ketu (South Lunar Node). There is a reasonable chance that a bottom will be formed in mid-October near the Sun-Saturn conjunction. After this time, Jupiter is more likely to create optimism as it aspects Pluto and Uranus over the next few weeks. This looks like a powerful rally that could last well into November and perhaps December. This could take the Nifty back above 5000 and we could well be testing the falling trend line from the late 2010 high once again. This rally could be another opportunity for investors to sell their long positions as Q1 2012 looks very bearish.
5-day outlook — bearish NIFTY 5000-5150
30-day outlook — bearish-neutral NIFTY 5000-5300
90-day outlook — bearish NIFTY 4700-5000
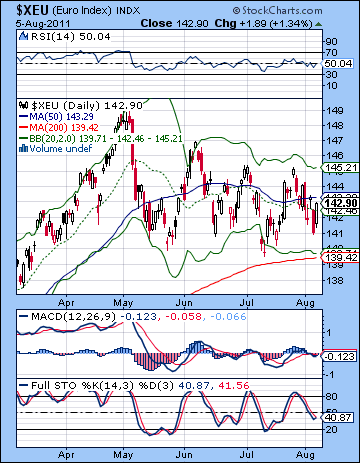 The Dollar regained some of its safe haven cachet last week as the Eurozone’s preoccupation with Italy pushed the USDX above 75 by midweek. Friday’s plan for the ECB to buy Italian bonds in an effort to stave off a deeper crisis removed some of those gains as the Euro ended the week just under 1.43. Reflecting the extent of the global turmoil, emerging market currencies such as the Rupee lost ground and closed near 44.73. This outcome was largely in keeping with expectations as I thought the midweek Mercury troubles would hurt the Euro. The late week Venus-Jupiter aspect also coincided fairly closely with Friday’s gain. The Euro remains trapped in a triangle pattern of lower highs and higher lows. When it comes, the breakout could be sharp. We finished smack dab in the middle of the Bollinger bands which was also just shy of the 50 DMA. MACD is in the start of a tiny bullish crossover while traversing the zero line. Stochastics (40) is also in a crossover but is very much on contested terrain. RSI (50) illustrates just how indecisive the market is about the Eurodollar. Europe is coming apart at the seams, but if the ECB starts buying Italian bonds and they can increase the size of their bailout fund, then maybe enough market players will go along with it. Now S&P has just downgraded US debt, so that may ironically add to the Euro’s woes as the flight to quality still favours the greenback. We shall see what happens Monday morning.
The Mars-Uranus-Pluto alignment will likely produce some major moves. In all likelihood, this could be bearish for the Euro as investors seek safety in the Dollar. We could be bumping up against support at 1.40 quite quickly. While I wouldn’t rule out a break of support, this pattern may not have enough energy to break it. The Fed makes its pronouncement on Tuesday at 2.15 so it is possible that could stabilize markets if the Euro has been falling beforehand. But the Mars aspect looks strongest on Wednesday actually, so that is one possible area of discrepancy. Some rebound is likely on Thursday and into Friday as the Sun-Venus pairing form a minor aspect with Uranus. I would expect the Euro to generally rally into early September as the Jupiter retrograde station on 30 August will aspect the natal Sun in the Euro horoscope. This may test resistance once again at 1.43 and may well go beyond that level. The rally will be short lived. By mid-September, the Euro will begin to fall and should break support quite quickly. We could see the Euro at 1.30 by mid-October. Beginning as soon as October 17, the Euro may rally again and this rise should last into November and possibly even December. Another correction in the Euro is more likely in December and January and this will likely be larger than the Sep-Oct correction.
Dollar
5-day outlook — bullish
30-day outlook — neutral
90-day outlook — bullish
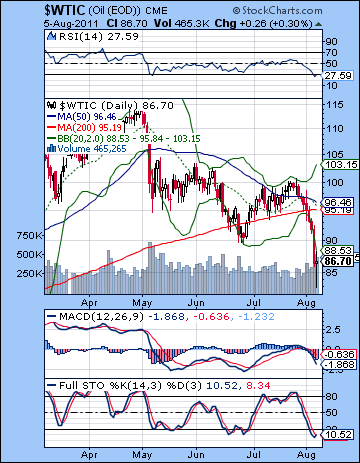 As financial world revisited its 2008 panic mode last week, crude oil suffered major collateral damage as it fell below the $90 level for the first time since February. It closed at 86.70. Well, I was miles off the mark in last week’s forecast as I thought the two passing Jupiter aspects could support crude through the troubles created by Mercury-Neptune aspect. No way! I thought most of the downside would occur this week. What is interesting here is how crude has finally reached the downside target of that old head and shoulders pattern around the early May top. Crude is now on the wrong side of the 200 DMA looking back up at it now as resistance rather than support. MACD is now in a bearish crossover and falling below the zero line. Stochastics are oversold (10) and just beginning a bullish crossover. RSI (27) is oversold and offers perhaps the best piece of evidence for the bulls that a bounce may be coming soon. The 200 DMA is flattening out here and threatens to roll over in the coming weeks. This would likely spell the end of the long bull market in oil that has characterized this post-2009 rally. Crude is sitting on support here around $85 which matches the lows from January and February. We got an intraday test of $82 on Friday, so that may light the way forward. There appears to be quite a bit of support at $80 dating back to 2010 so it seems unlikely that crude would fall too far from current levels in the event of some kind of widespread capitulation this week. Resistance is $95-96 and the 20, 50 and 200 DMA which converge at that level. Even if we do get more downside this week, that $95 level could act like a magnet in any rebound rally.
This week looks bearish as the Mars-Uranus-Pluto alignment has the potential to do a lot more damage. The most likely time for declines would be Tuesday and Wednesday. It’s possible we could see rise Monday, but I would expect lower lows here, perhaps as low as $80. The late week period looks more bullish however. Next week is also likely to see gains as the triple conjunction of Sun-Mercury-Venus on Tuesday and Wednesday should propel prices higher. Thursday’s Mars-Jupiter aspect also looks bullish so there is a possibility that the market could rise substantially here through the week. Perhaps it can rise all the way back to $95. The following week may begin favourably on the Sun-Venus-Neptune pattern but Thursday’s Mars-Saturn aspect on the 25th could be very bearish indeed. I’m unsure if it will be powerful enough to negate preceding gains from Aug 11-23. At this point, I would think that unlikely. Crude could be choppy into September with a bullish bias until perhaps the middle of the month. This may not be a strong rally not particularly lengthy either. The Saturn-Ketu aspect should dominate the second half of September and push prices lower into October. I would expect $80 to be seriously tested again by mid-October. I would not be surprised to see it break down. A major rally is likely to begin in late October and continue through November as Jupiter becomes dominant in the sky. December will likely see this rally begin to top out or fail outright. Another major corrective phase is due for Q1 2012.
5-day outlook — bearish
30-day outlook — bullish
90-day outlook — bearish
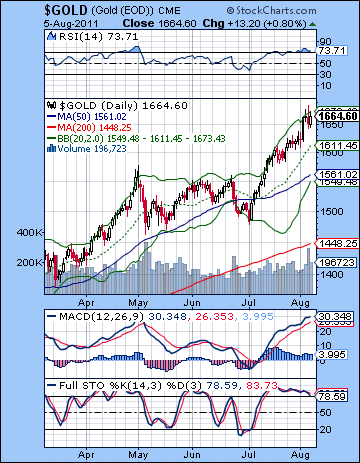 Gold benefited from last week’s financial turmoil as investors sought safe haven from the twin plagues of rising Eurozone bond yields and a weak US debt deal. After trading as high as $1680, gold settled at $1664. This bullish outcome was in keeping with expectations as the Sun and Venus aspects to Jupiter were more than enough to offset the brief negativity from the midweek Mercury-Neptune aspect. Gold actually suffered a mild decline Monday but that was followed by a powerful gain Tuesday just a day after the Sun-Jupiter aspect. The other down day was Thursday, which fit fairly well with the Mercury-Neptune aspect. Friday’s bullish engulfing candle occurred on a nice Venus-Jupiter aspect. Gold is staying quite strong here despite the recent market uncertainty although Thursday’s massive selloff in equities should give all gold bulls pause. When investors have to sell due to margin calls, they will liquidate whatever assets they have. In extreme situations, it is possible to see how this may phenomenon could force a larger gold correction. For the moment, we are only in the early phases of a stock market correction. The gains once again produced an oversold condition on the RSI (73) while the more sensitive Stochastics indicator (73) is showing a bearish crossover and has fallen below the 80 line. This is the only hint that something may be amiss in the gold market. Support is near the 50 DMA at $1561 while the all-important rising trend line comes in around $1520. That line must hold for this unassailable bull market to continue. It’s not to say that the bull will be over if we break below it. But it begin to resemble a more normal market. And depending on the circumstances of such a breach, it could actually produce some nervousness among the gold bugs.
This week should be quite interesting for gold. On the face of it, the Mars-Uranus-Pluto aspect looks bearish for most asset classes. If gold remains true to form, it should rise further on its safe haven status as investors flee riskier assets. A further rise is possible, especially since Venus is still approaching its conjunction with the Sun in the coming days. (due to be exact on Aug 16). But if this Mars configuration is as powerful as I think it might be, it could reproduce a wave of selling and subsequent margin calls that could induce more downside for gold. The aspect is closest on Tuesday and Wednesday so those will be the most dangerous days for gold. The late week period looks more bullish although I would not be surprised to see gold end the week lower overall. Even in the worst case scenario, I do not expect the trend line to be tested. Next week looks more bullish again on the triple conjunction of Sun-Mercury-Venus on Tuesday. This is likely to coincide with a big rise. Gold should stay mostly bullish until early September as the Jupiter retrograde station on 30 August is likely to give lingering bullish bias. Gold should reverse lower starting in September, perhaps around the 15th. While I expect a decent sized correction lasting into October, I’m less sure it will do much technical damage. A 10% correction looks possible, but beyond that, it’s hard to say. The correction should last until the Sun-Saturn conjunction in mid-October. Gold will rally again in the fall and this could last into December. This will set the stage for what I believe will be larger correction that could start as soon as December and last well into January and February 2012. This could finally break the upward momentum of the gold market.
5-day outlook — bearish-neutral
30-day outlook — bullish
90-day outlook — bearish-neutral

