- Stocks may gain early in the week but declines more likely later ahead of Jupiter-Saturn opposition
- Dollar poised to rally off bottom; new rally begins and will last into September
- Crude oil to be firm early in the week and then weaken
- Gold strong on Monday and Tuesday and then declines more likely; significant move down is likely in coming weeks
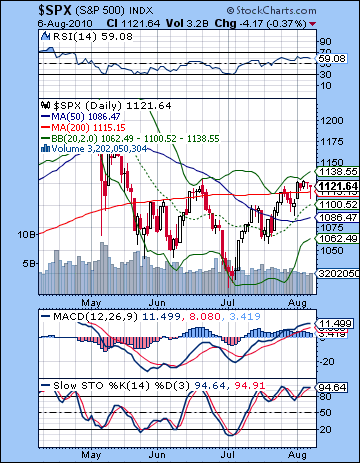 Alas, it was another week of purgatory for both bulls and bears as the market remains stuck in a sort of grey interzone. After Monday’s surge, the market traded pretty flat with most dips being bought aggressively including most notably on the bad jobs data at the end of the week. The Dow closed almost 2% higher to close at 10,653 while the S&P ended the week at 1121. Given my expectations for a meaningful start to the downdraft, this was disappointing to say the least. The biggest source of error was Monday as the entry of Venus into Virgo did not coincide with a decline but rather an impressive gain. In retrospect, I probably put too much emphasis on this factor, especially since Venus will transit the sign of Virgo for the next four weeks and hence may act instead as a background influence. I had also expected the markets to head south immediately following the Mars-Saturn conjunction on July 31 so this was another incorrect assumption. It seems that the unusually high density of aspects here are confounding some basic planetary interpretations. The market has continued to rise even after the Saturn-Uranus aspect of July 26 thus nullifying an important ongoing thesis. It may be that Saturn has to also begin to separate from the other planets like Jupiter (exact August 16) before some of those expected bearish effects will be felt. This is in fact my current hypothesis. While Venus in Virgo was a bust, the rest of the week’s forecast was not as much of a washout as we did get further buyers midweek and the Mars-Jupiter aspect. I suspected we could see some more speculation here that could drive up prices and we did. Aspects involving Jupiter are often associated with gains and in that respect Mars did not disappoint. The late week Mercury-Rahu also roughly followed our script as we saw some modest declines on Thursday and Friday. Even here, however, the bottoms were bought by bulls looking to buy the dips and the market ended in much better shape than it otherwise might have. The moral of the story is that Jupiter continues to exercise some influence here as its close aspect with Pluto, although separating (and weakening) is still pretty close. The market seems to be locked into a minor bull phase here which many investors are reluctant to leave behind. The next possible switch in sentiment may therefore not arrive until the Jupiter-Saturn opposition on August 16. This will be closely followed by the Saturn-Pluto square on August 21. This double dose of Saturn would appear to be inimical to any further rally attempts, at least for the time being. And the second half of August has the added burden of the developing Venus-Mars conjunction that will carry over into September due to the approaching Venus retrograde period. Jupiter’s bullishness may come back for an encore in September, however, as Jupiter (4 Pisces) will conjoin Uranus (4 Pisces) on September 18. This is most likely to manifest as a gain ahead of that conjunction date. After that, Saturn appears set to take the reins again in its nasty square aspect with Rahu on September 27.
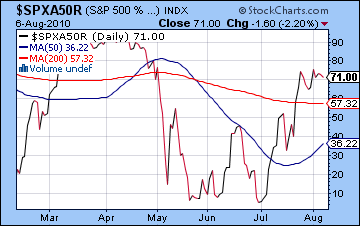
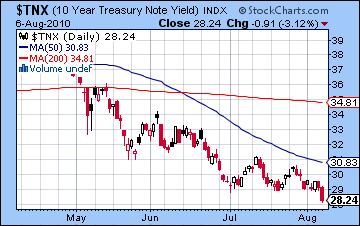
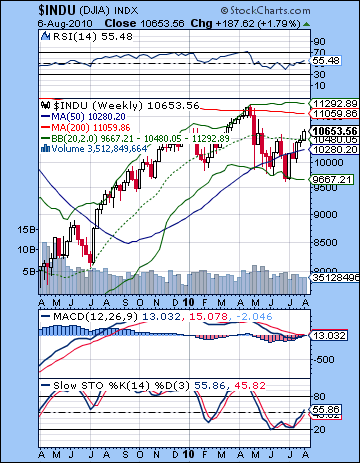 The technical picture remains cloudy after last week. The bulls are still in command here, although they have so far failed to take out the previous high on the S&P of 1131. Perhaps we shouldn’t make too much of this since the Dow has already eclipsed the June 21 high, although the Nasdaq has not. And the bulls managed to bid up stocks after Friday’s morning selloff and the NFP data disappointment. Crucially, the initial decline broke below the rising trendline from the July 2 low thus giving ammunition to the bears. However, the inability of the bears to keep prices below this trendline line (approx. 1115) by the close was a significant victory for the bulls. Although we can attach an asterisk to it, the trendline is intact and the bulls are still in charge. The 1115 level is doubly important since it coincides with the 200 DMA. Things are looking up for the bulls actually since they can rightly point to recent support from the rising 20 DMA as pullbacks to that level have initiated more advances. The 50 DMA is now rising also thus suggesting this is not just a simple snapback rally after a steep selloff. Stochastics are still overbought (94) but there are no obvious divergences there nor any sign of an immediate decline. MACD is rising and still in a bullish crossover although the histogram is faltering. RSI (59) is still climbing and looking fairly solid without any clear divergences. Volume is still MIA here but that has been the case recently and indeed through much of the preceding rally. The number of S&P 500 stocks above their 50-day moving average has climbed all the back above 70%, the highest since the start of the April correction. This is impressively bullish although this needs to be watched carefully for any signs of topping. If stocks rally higher early next week without higher highs on this indicator, it could be a sign of narrowing breadth which might foretell the end to the rally. While the Dollar continues to get pounded here, treasuries are the bears’ ace in the hole as yields on the 10-year fell to new lows for the year at 2.82%. Clearly, the bond market is increasingly looking for a double dip recession. The difficulty is that there is a gap between what the bond market expects and what the equity market expects. In the long run, both cannot be right. It seems that equity markets are looking for the Fed to announce new stimulus measures, perhaps as early as next week in Tuesday’s FOMC meeting. While this is likely positive for stocks in the short run, it remains to be seen how the bond and currency markets will react to even greater borrowing by the US government.
 This week may center around the FOMC meeting on Tuesday. If there is an announcement of new stimulus measures such as an extension of the bond or mortgage buyback scheme, then stocks could react favourably to the fresh liquidity even if such a move would further underline the fact the much ballyhooed US recovery is in big trouble. There is some reason to expect that stocks will tend to rise into the meeting as Venus forms an aspect with Jupiter and Pluto on Monday and perhaps Tuesday. Since Venus will be past Jupiter by Tuesday, any rise going into or following Bernake’s appearance seems to be either short lived or not happening. Since Venus is in Virgo here, it can’t deliver the bullish results one would normally expect. Moreover, it’s hemmed in between Mars and Saturn and that is another reason to anticipate limited upside. In fact, it is possible that this weakened Venus could spark declines as soon as Tuesday. I’m less confident in this outcome but it is certainly possible. The end of the week looks more reliably bearish, however, as the Moon joins Venus, Mars and Saturn in Virgo on Thursday and Friday. A big down day is quite possible on Friday, and even likely. So there’s a reasonable chance for a down week here, perhaps significantly as the end of the week could finally see the bears gaining some traction. If we do see a gain Monday, it may even be enough to knock out 1131 on the S&P and thus spark another round of short covering. This would be more confusing to the market and for that very reason makes it more likely to happen. A more bullish scenario would have the S&P trading over 1130 going into Thursday and then closing somewhere between 1100 and 1120 by Friday. I’m reluctant to even give a bearish scenario since the market has been anything but bearish lately, but it’s possible we see a decline begin on Tuesday that takes us below 1115 then and below 1080 by Friday. That said, I don’t want to rule out the possibility that the market rally doesn’t really break until Monday August 16 and the Jupiter-Saturn. Those are two big planets that can act as a dividing line between rally and correction.
 Next week (Aug 16-20) begins with the Jupiter-Saturn opposition. This is often bearish although there are numerous exceptions to this tendency. However, given the intensity of aspects in play here, I think the likelihood of more downside around this aspect is increased. The important thing about Monday the 16th is that Mars will exactly aspect Rahu that day so that will likely increase the size of the move, hopefully down. Without falling into the easy trap of astro-sensationalism, there is a possibility of a crash-type decline here (esp Monday). And with each passing day, Venus moves a little closer to Mars. On Monday, the separation is just two degrees and by Friday, the separation is zero as they will exactly conjoin around noon. This is likely to be another drag on sentiment through this week. With any luck, markets could be down 5% or more. The following week (Aug 23-27) looks more mixed as the bullish Sun-Jupiter aspect on Tuesday may offset some of the ongoing bearishness of the Venus-Mars conjunction that continues here into late Virgo. Thursday looks particularly negative on the Sun-Saturn and Mercury-Mars aspects. We are likely to see some kind of rally going into September, although this may not get going until after Labor Day. Jupiter approaches its conjunction with Uranus on September 18, so it is possible that prices will rise from about Sept 3/7 to that date. But even here, I can spot a potentially devastating aspect between Mercury and Saturn on Friday Sept 10 and Monday Sept 13. After Monday, Sept 20, stocks may start to fall in earnest again as Saturn approaches its aspect with Rahu and Mars aspects Ketu. This looks like a rough approximation of the early May alignment that started the initial correction. I would expect at least a 10% decline over a few days, perhaps more. A possible significant low may occur near October 7 and the Mercury-Saturn conjunction. What’s especially interesting here is that this will occur at the same time as the Venus retrograde station. Venus turned retrograde back on March 5, 2009 and fell with one day of the low in the current overall corrective phase. History may not exactly repeat itself, but it often rhymes.
5-day outlook — bearish SPX 1080-1120
30-day outlook — bearish SPX 1000-1050
90-day outlook — bearish SPX 900-950
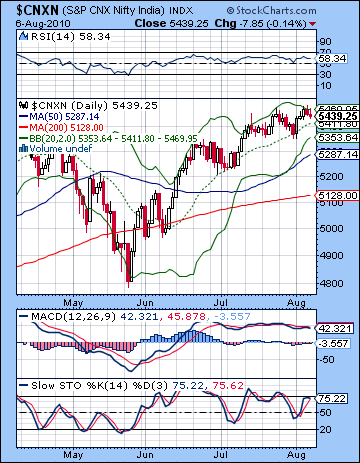 Stocks rallied last week on more upbeat earnings reports and a stabilizing global environment. After Monday’s significant rise, the Sensex coasted to an almost 2% gain on the week before closing at 18,143 while the Nifty finished at 5439. Since I had expected more early week downside, this bullish result was surprising to say the least. A couple of interpretive errors here led to underestimation of positive sentiment. First, I had expected more immediate downside in the aftermath of 1) the Saturn-Uranus aspect on 26 July and 2) the Mars-Saturn conjunction of 31 July. While last week’s highs roughly matched the 26 July high and thus did not invalidate the Saturn-Uranus thesis, the inability of the bears to take over in the wake of the Mars-Saturn conjunction was definitely disappointing. One possible explanation is due to the high number of close aspects in the sky right now. This means that an aspect that might ordinarily serve as a clear demarcator of sentiment is blurred by the proximity of other aspects. In this case, the Mars-Saturn conjunction is blurred by the presence of the Jupiter opposition. In real terms, this may mean that we won’t see the full effects of the Mars-Saturn conjunction until both Mars and Saturn have moved past Jupiter. Mars moved past Jupiter midweek and Saturn will move past Jupiter on 16 August. Both are therefore plausible dates for interim market tops. In any event, the rest of the week more or less unfolded as expected, if a little more muted that I would have liked. The Mars-Jupiter aspect did produce some gains into the midweek period as both Tuesday and Wednesday were higher, while the late week Mercury-Rahu aspect saw weakness return. Of course, this was hardly much consolation to bears since the declines were tiny. Nonetheless, it was somewhat reassuring that the planets were broadly falling in line with their essential qualities. As unexpected as the gains were, I am sticking with my basic thesis here that we are poised for a significant pullback. While I would humbly acknowledge some uncertainty here, it appears likely that the Jupiter-Saturn opposition of 16 August will mark a significant break down. This may begin to occur ahead of that date, but this coming together of Jupiter, the planet of bullishness and Saturn, the planet of bearishness is usually highly indicative of either a major shift or a major move. And it may well begin a cascading effect of the effects of the preceding Mars-Saturn and Saturn-Uranus aspects that we have just recently witnessed. The second half of August also features an unusually long Venus-Mars conjunction in Virgo that will further serve to dampen sentiment. It’s not all doom and gloom, however, as the Jupiter-Uranus conjunction on 18 September is likely to correspond with some rally attempts, most likely in the days ahead of that date. However, Saturn’s aspect to Rahu on 27 September is still looming large here and is likely to correspond with another significant move lower.
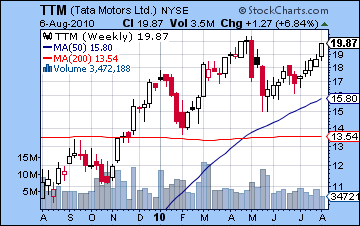
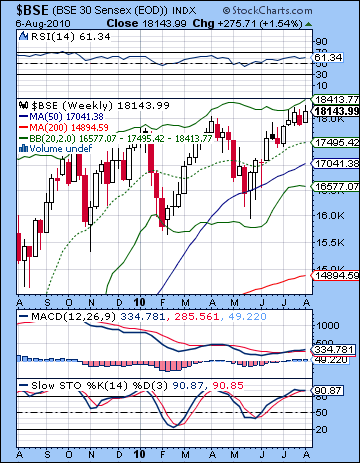 Despite last week bullish sentiment, technicals seem overstretched here. We can see a possible double top at 5470 on the Nifty that could scare off new money should prices fall back below 5400. Volume was very low last week, averaging just 11-12k. When bulls moves occur on low volume it is another reason not to trust them. Even last week’s up move can be seen in a bearish light since Friday’s close met with resistance from the bottom of the rising wedge. Readers will recall that this wedge was violated on July 30 and opened the door to a possible waterfall decline in the coming days. While the decline was delayed, it has not been cancelled. The rise back up to this resistance line follows a classic "kissing" of a line before a larger move down. We can see the Nifty pushing up against the top of the Bollinger band last week so that may increase the likelihood of a pullback in the near future. In previous bounces off the top Bollinger band, prices have only retreated to the 20 DMA (now about 5411). It will be interesting to see if this level of support returns. My guess is it won’t and prices will fall quickly to the bottom band at 5353. Perhaps more important is how narrow the bands have become. A narrowing of bands usually precedes a big move in either direction. For its part, MACD is still in a bearish crossover and maintain its negative divergence. RSI (58) is falling and we can see a negative divergence there, too. Stochastics (75) are even more bearish as they have broken below the oversold line and there is a bearish divergence forming with respect to the late July highs. The Sensex weekly chart is also looking pretty bearish as divergences are clearly evident in both MACD and RSI. Stochastics (90) are still oversold although they have yet to begun to turn down. And if we squint, we might even see the beginnings of a negative divergence with respect to the high of early April. Tata Motors (TTM) has seen an impressive run lately, but it has not yet knocked out its previous high in its New York chart. This is actually not a bad chart, although it runs the risk of forming a tilted head and shoulders pattern dating back to January. The potential bearishness is accentuated here since volume is significantly lower in this current run-up into the right shoulder. In terms of support levels on the Nifty, I think once the bottom Bollinger band is taken out, there will be a retest of the 200 DMA around 5100. I doubt it will offer any hard support but will rather act as a cushion through which prices may fall briefly below before snapping back. 4900 is perhaps a firmer support level since it marks the bottom of the rising channel that dates back to late 2009. If and when that is broken, support levels get more murky.
This week again offers the prospect of lower prices, and this time with some better justification. The early week period may see more upside, however, as Venus aspects Jupiter on Monday and Tuesday. While this is normally a positive influence, it is important to note that the condition of Venus is increasingly compromised here. Not only is it in a debilitated state in Virgo, but it will be hemmed in between malefics Mars and Saturn. Venus will be hemmed in until 20 August and therefore it should be considered seriously weakened. All of which is to say that even with a nice Venus-Jupiter aspect Monday and Tuesday, the upside potential may be less than it otherwise would be. After Tuesday, declines will be more likely with the greatest likelihood towards the end of the week. On Thursday and Friday, the Moon will transit Virgo and will therefore line up with Saturn, Venus, and Mars in opposition to Jupiter. Friday in particular could be a significant down day. The most bullish day appears to be Monday. Overall, I would expect a down week here, although it seems likely we stay above 5353. We may even end up near the 20 DMA at 5411 although that seems too bullish given the troubled nature of Venus this week. But I’ve been too bearish here so it’s possible this lingering Jupiter influence can continue for another week right up until the opposition with Saturn on Monday 16 August. I would think we break down lower ahead of this date but we shall see.
 Next week (Aug 16-20) begins with the aforementioned Jupiter-Saturn opposition. That’s a bearish influence on its own but what makes the early part of this week even more dangerous is the Mars-Rahu aspect that is exact on Monday and into Tuesday. This is likely to correspond with a major down move. The rest of the week is unlikely to see much recovery as Venus will conjoin Mars exactly on Friday. A decline of more than 5% is therefore quite probable here, and it could be greater. The following week (Aug 23-27) will likely begin positively on Tuesday’s Sun-Jupiter aspect but these gains are unlikely to hold on the Sun-Saturn and Mercury-Mars aspects late in the week. After that, we could see some kind of temporary bottom put in in the first week of September as Venus enters Libra. Prices may rebound somewhat going into the Jupiter-Uranus conjunction on 18 September but a decline is likely soon after as Saturn aspects Rahu on 27 September. Mars conjoins Venus again in early October and this will roughly correspond with the beginning of the retrograde cycle of Venus on 7 October. This is potentially important since the previous start of a retrograde cycle on 5 March 2009 coincided with an interim low. This retrograde station does not look quite as afflicted as that one was, but the Mars conjunction is nonetheless important in this respect. Stocks may well rally after this date. Prices look to be fairly choppy for the rest of 2010 with significant rallies and corrections after this big decline is out of the way. December looks generally more bullish.
5-day outlook — NIFTY 5300-5400
30-day outlook — NIFTY 4900-5200
90-day outlook — NIFTY 4500-5000
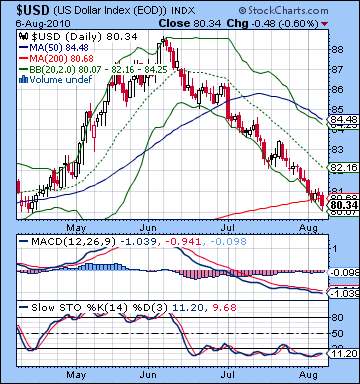 The Dollar lost more ground last week as bad economic data was the latest reason to abandon the greenback. It barely managed to hang on to the 80 level. This was depressing news given my expectation for a turnaround here. Alas, rumors of the Dollar’s return to life have been greatly exaggerated. While I did not expect the bulk of the rally to occur until late August and into September but I would have expected a little more upside here nonetheless. Technically, the Dollar is very oversold and seems poised to rise. Prices are bouncing along the bottom Bollinger band here and worse still was Friday’s close was actually below the 200 DMA. Scary times indeed. MACD is deep underwater and still trending lower while RSI (24) is oversold although there is evidence of a positive divergence. Stochastics (9) are mired in the underworld and show no sign of coming up for air any time soon. One would think the Dollar would find support here at the 200 DMA because it is unclear just where the next level of support might be. Perhaps the March low of 79.5. Resistance is everywhere and anywhere at this point, more decidedly at the 20 DMA at 82. This corresponds with the falling channel and if and when the Dollar climbs over this level, it will be free and clear for another major rally. So as bad as the technicals are, there is some reason to expect a turnaround sooner rather than later.
This week may see more interest in the Dollar, although it is nowhere near as clear as I would like it. Tuesday and Wednesday offer decent opportunities for a rise as both the Moon and Mercury are in Leo and this translates to a strong position in the relevant natal chart. The late week, especially Friday, also seems pretty good as the Moon conjoins Mars and both fall under the natal aspect of Jupiter. It’s been a while since that natal Jupiter has done anything positive so I’m not holding my breath. At least this time, transiting Venus is sitting on the natal Midheaven so that is one possible bonus area. Early next week, the Venus-Mars aspect to natal Jupiter tightens, so that ought to boost the Dollar further. Hopefully, this ought to get the ball rolling and start a new uptrend. The rocket fuel is the Jupiter-Uranus conjunction in September so I expect the rise to accelerate somewhat into that period. Enthusiasm may fade in late September and then again in early October and the Venus retrograde cycle. The trend should still be fairly bullish until October 7 but after that date, the Dollar may be increasingly vulnerable to selloffs.
The Euro extended its winning streak last week as it closed above 1.32. I had been prematurely bearish on the expectation that the Mars-Saturn conjunction would exert more pressure on the natal ascendant in the Euro horoscope. As it happened, Jupiter is still calling the shots here and remains a significant influence on the first house. The technical condition seems unsustainable here, especially given Friday’s shooting star candle. It opened gap up, then rose intraday above 1.33 and then settled back at the opening level. It’s usually a bearish indication when it occurs at the top of the trend so let’s see if that is borne out in next week’s trading. This week may see some weakening as transiting Mars forms a minor aspect with the natal Ketu later in the week. The picture is less clear before that time, however. Monday, August 16 looks like a particularly bad day for the Euro so we could see it fall by more than a cent. Generally, there is a good chance for a retracement here leading into September. Meanwhile, the Rupee gained more ground last week closing near 46. This week may see some of those recent gains go by the boards as the Dollar is poised to strengthen.
Dollar
5-day outlook — bullish
30-day outlook — bullish
90-day outlook — neutral-bullish
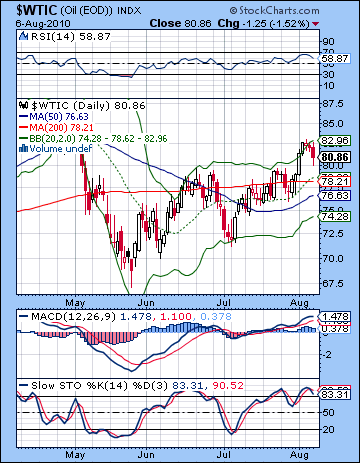 Crude oil is coming off a good week as prices rose by more than 2% closing just under $81. While I thought we would see more downside, the intraweek pattern closely adhered to expectations. Major gains arrived on schedule early in the week on a nice Sun-to-Jupiter aspect in the natal chart. I had wondered if the rise would fall on Monday or Tuesday, but it turned out that both days were in the green with the largest gain occurring on Monday. Prices began to retreat after that as the Jupiter influenced faded and the Moon entered Gemini for Friday’s session. Friday saw the biggest decline of the week as prices fell 1%. While the rise was impressive, the technicals still look vulnerable here. The early week rise to the top of the Bollinger band may have pushed things about as far as they can go for the short term. Nonetheless, the 20 and 50 DMA are now rising and prices are above both. MACD is rising and still in a bullish crossover. RSI (58) is still in the bullish area but is now falling after a run-up very close to the 70 level. This may be a signal that it is losing steam here. Stochastics (83) are overbought and starting to turn down. More significant, however, is the bearish divergence in the lower recent peaks after price has risen. Resistance is probably around $83 here with support first appearing around the 20 DMA at $78.50. Below that, the lower Bollinger band may be a more useful intermediate support level at $74. We can see that this caught the previous down move in early July quite nicely. Prices are still hovering near the 200 DMA so we may see that indecision resolve fairly soon. The 200 DMA itself is still gently rising which is a mildly bullish indication although if we do get another significant correction, it may well tip the scales to the bears as prices will trade below this level and it will force the 200 DMA into a downward slope.
This week looks — dare I say it — bearish for crude although like last week, there is likely to be some bullishness early in the week. Monday will see the Venus-Jupiter aspect so that is likely to boost speculative interest in commodities. Also, the Moon joins the Sun in watery Cancer on Monday and Tuesday so that is another reason to expect some upward lift to prices. The gains don’t look quite as well-defined as last week’s so perhaps there will be limited upside, perhaps back to last week’s highs of $82.50. The late week period seems more bearish as Venus is trapped between malefics Mars and Saturn. Thursday and Friday in particular seem most bearish. Transiting Mars will aspect its natal position in the Futures chart so that is additional reason to expect a pullback. Friday is perhaps worse than Thursday in that respect. Next week looks even more bearish on the Jupiter-Saturn opposition, although it is worth noting there is limited affliction to the Futures chart with these transits. Monday’s Sun placement is actually in a favorable place in the Futures chart. Friday’s Venus-Mars conjunction, however, will be in near exact contact with natal Venus thus emphasizing some negative effects for crude towards the end of the week. Overall I am expecting a significant correction here, at least to $74 by next week, perhaps $70. Crude looks fairly weak until October where sharp but short rallies are likely. Jupiter’s station in November is also likely to generate a substantial lift to sentiment which should carry into December. However, the period from October to December still looks very choppy.
5-day outlook — bearish
30-day outlook — bearish
90-day outlook — bearish-neutral
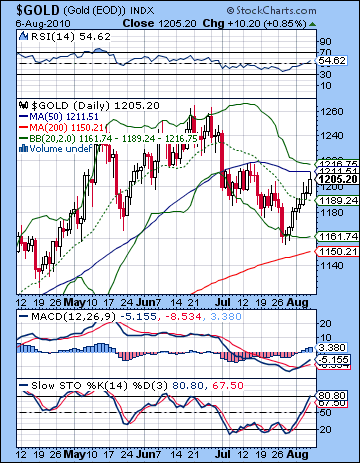 As the US Dollar continued to falter, gold extended its bounce from recent lows last week as it closed near $1205 on the continuous contract. This outcome was disappointing given my bearish forecast of Venus in Virgo. While I allowed for some optimism on the midweek Mars-Jupiter aspect, prices more or less rose throughout the week. It’s important to note that this protracted weakness of Venus will last until early September when the planet of luxuries will enter Libra. Therefore, last week’s miss does not significantly change my outlook on gold. The technical picture still looks shaky as last week’s advance is still lower than the previous high of mid-July. Lower highs are part and parcel of a bear market and until gold can close above $1220 it will be more vulnerable on the downside. Friday’s close was also just below the 50 DMA, suggesting this level may become significant resistance in the near term. Both 20 and 50 DMA are now falling. Stochastics (80) have reached the overbought area and may be headed back down. Support is likely around $1160 which is both the bottom Bollinger band and the previous July low. This is just a stone’s throw from the 200 DMA at $1150. A significant break below this level could produce a cascading effect of bringing in more sellers as previous support of the 200 DMA would become resistance. The gap between the 50 and 200 DMA is now narrow enough (<5%) that a correction may cause a death cross which would make the technical picture that much worse.
This week is likely going to start off bullish for gold as Monday’s Venus-Jupiter aspect should correspond with more buying. This could well extend into Tuesday as the aspect will still be fairly close. I would not be surprised if gold tested resistance at $1220 here. A close above that level seems less likely but still within the realm of possibility. Prices are likely to back off after that as Jupiter will move away from its aspect with the natal Moon in the GLD chart. At the same time, Saturn will begin to move in so we could see significant declines by Friday. This week will be the second test for Venus in Virgo so we could see more weakness even without any clear afflictive aspects to Venus. Next week looks more bearish for gold as Mercury turns retrograde in Leo and Venus conjoins Mars on the 20th. Although gold could get a boost in the first week of September when Venus enters Libra, this is likely to be short lived. Late September looks particularly bearish, especially around the 21st. This will likely correlate with a major rise in the US Dollar. A rebound will likely take hold in October as Jupiter approaches its retrograde station.
5-day outlook — bearish-neutral
30-day outlook — bearish
90-day outlook — bearish

