

Summary for week of December 12 – 16
Summary for week of December 12 – 16
- Stocks likely lower in early week with gains more likely by Friday
- Euro lower by Tuesday but could recover late in week; correction to continue into January
- Crude lower early this week butlarger correction may wait until January
- Gold may decline early in the week but rebound by Friday; correction may extend into Q2 2012
Another week, another EU agreement. Stocks finished higher last week as the much-anticipated EU summit produced an apparently workable solution towards fiscal union. Despite a three-time rejection at 200-day DMA, the Dow gained 1% closing at 12,184 while the S&P 500 ended the week at 1255. While stocks were stubbornly bullish early in the week, the overall outcome was not too surprising given the ongoing Jupiter-Uranus aspect. I thought we might get the down move a bit earlier (Tuesday-Wednesday) on the Sun-Rahu aspect, but we had to wait until Thursday for any kind of pullback. Friday’s bounce back was in keeping with the more positive energy of the Sun-Venus aspect. As expected, we did get a lower high (<1292) and this sets up the possibility for further retracement lower this week. Nonetheless, the takeaway is that Jupiter is putting up a valiant fight on behalf of the bulls here so it seems less likely that any major decline will occur in December. While I cannot quite bring myself to believe in a big Santa Claus rally this year, Saturn may not yet be strong enough to offset the Jupiter-Uranus pairing. That may have to wait until January.So all is well again in Euroland. Or is it? Friday’s agreement for a new fiscal union that promises to boost financial accountability at the expense of national sovereignty was cheered by most markets. The refusal of the UK to join was perhaps not unexpected, given its original reluctance to join the currency union. Merkozy & Co. now have a more viable plan to reduce excess spending and hopefully lower the cost of borrowing. Bond yields fell on Friday so that was a positive sign. But the Europeans are still not giving the market want it wants — more liquidity from the ECB and more bond buy backs in the manner of QE. In other words, the market wants Draghi to act more like Bernanke. Well, so far he is refusing all helicopter rides. That was the reason why stocks sold off on Thursday. This leaner, meaner approach was not unexpected from an astrological perspective since Saturn is in close proximity to both Jupiter and Uranus. Of course, Jupiter and Uranus may be implicated in some of the December rally. This planetary pairing is usually inflationary and may be seen behind the previous week’s coordinated central bank intervention as well as the ECB’s rate cut to 1%. But the reason why we are unlikely to see the big bazooka option from the ECB is because Saturn is probably too close to allow the orgy of money printing that a Fed-style bond buyback would entail. This leaves the Eurozone vulnerable to bank insolvency down the road and may not be sufficient to prevent another visit from the bond vigilantes.
 The technical picture continued to improve as Thursday’s decline may have provided the necessary outlet for the overbought condition that is required for a new move higher. That said, the inability for the SPX to close above the 200 DMA should be a source of some concern for bulls. The market is very choppy lately and is increasingly range bound between the 50 and 200 DMA. A close above resistance at 1270 would be quite a bullish signal and would greatly increase the likelihood to a run to the next resistance level of 1320. This is where the falling trend line from the May high hits the 78.6% retracement level and would be considered another opportunity to short the market by bearish investors. Before that time, the battle for the 200 DMA is still front and center as bears will likely defend 1260-1275 as much as possible. While Friday’s rally did erase most of Thursday’s losses, it did not quite produce a bullish engulfing candle. Therefore the preceding series of three doji candles still could be significant in so far as they may mark a top. Stochastics is still in a bearish crossover although it has not yet crossed below the 80 line. This opens the door a bit for the bears. If we do get a sell-off next week (as I expect), we could see support again tested near the 20 and 50 DMA around 1220. Buyers came in at 1230 last week and if there is a scary Euro development over the weekend, then it is also possible the 50 DMA at 1219 could be tested. This could create a gap fill scenario all the way down to 1210 which would amount to a 50% retracement from the most recent high and low. Of course, the market currently belongs to the bulls here since the last low at 1158 was higher than 1074. But the longer it takes the bulls to break above the previous high of 1292, the weaker the bulls will become. I would tend to think that if 1210 doesn’t hold, then it is unclear when the pullback may stop. Perhaps stocks will set up a triangle pattern as we are seeing in gold now — a series of lower highs and higher lows until a final breakout in one direction or the other.
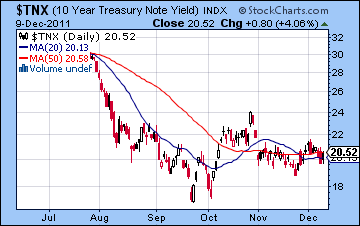
 The weekly chart finally moved into the bull column was the 13-week EMA moved above the 34-week EMA. This a reflection of the strength of the rebound after the initial August waterfall sell-off. Stochastics got a bullish crossover and are pointing upward once again although they remain below the 80 line. MACD is still in a bullish crossover and has moved above the zero line. ADX is still mired in bearish crossover, however, although the ADX line is still sloping down suggesting a possible trend change higher may lie ahead. The Dow has moved quite close to the upper Bollinger band here suggesting that further upside would require significant news to generate more enthusiasm. The Summation Index is still on sell as it remains below its 10-day EMA, although the gap is narrowing. Yields on the 10-year treasury is still quite low suggesting the bond market is not buying the strength in equities. Yields are still close to 2% and reflect the likelihood of a deflationary slowdown in the months ahead. Overall, the technical picture is mixed to bearish as long as we don’t rise above 1270. As long as 1200-1220 holds, then the short term bias is still up as it would show that the dips are being bought, presumably in anticipation of whatever central bank intervention is necessary to prop up the market. This is a very real possibility of course, and it is one very good reason why many investors are bullish. Eventually, those central banks may be constrained by their top heavy balance sheets. It is unclear just when this constraint will become more real, however.
This week has a good chance of being more bearish. The key planetary factor is the Mars-Rahu square aspect which is exact on Tuesday and Wednesday. Both of these planets are considered negative influences, and their alignment here is a fairly reliable indicator of fear and an intolerance of risk. Rahu’s exact positioning is open to some interpretation (i.e. mean vs. true), however, so it is possible that the decline may not occur when the aspect is closest. Last week’s decline arrived a little later than expected due to this margin of error in Rahu’s exact location, so it is possible the same could happen again. Nonetheless, the most likely time for a decline is early in the week. There is a chance that Monday could be higher due to the Moon-Venus aspect, although I would not call this likely. Tuesday’s open looks quite bearish, although we could see some recovery through the day. Mercury returns to direct motion on Wednesday so that may reverse the down trend. I don’t think this is a reliable indicator, however. We have a better chance for a solid up day on either Thursday or Friday. That is when both Sun and Venus enter new signs. Friday is probably a better bet for gains, although it is also a better bet for a significant loss due to the Moon’s conjunction with Mars. In that sense, an extreme outcome is more likely here, whether it be positive or negative. I would nonetheless expect a net positive outcome across both of these days. The wild card here is Saturday’s lunar eclipse. This could magnify the downside move when it arrives. Of course, Jupiter-Uranus will be trying to support the market as they are in exact aspect this week also. On balance, however, the bears have a very good chance of retesting last week’s low and then some. The gap fill at 1210-1220 is quite possible here, and I would not be surprised to see something lower than that. The rebound should be smaller so there is a chance we will finish somewhere between 1230-1250.
 Next week (Dec 19-23) could be quite interesting as we will see a multi-planet alignment around the Jupiter-Saturn-Uranus pattern. This really could go either way so I am reluctant to call for more downside here, especially since the seasonal bias around Christmas is bullish. Nonetheless, there is a somewhat greater probability for weakness on Monday and perhaps Tuesday as both Sun and Venus are in aspect with Saturn. If Monday is lower, then the odds increase of a significant rebound on Tuesday. The bias should become more bullish into the rest of this week as the Sun and Venus form aspects with Jupiter. The last week of December is hard to call. It could well be mixed, although the Jupiter station on the 26th suggests that some bullishness should manifest. We could conceivably be range bound until January between 1200 and 1260. January, however, looks more bearish as Saturn moves into a closer opposition with Jupiter early in the month. Mars turns retrograde on the 23rd so that is another potentially negative influence. While I am expecting a significant correction from this broad alignment of planets, I am unsure exactly when it will occur. The first half of January is perhaps somewhat more likely to see sustained declines. We should see a significant rally underway by February which should last into March and the Jupiter-Pluto aspect. Another corrective wave looks likely in late March and April on the Uranus-Rahu aspect. I am unsure if this will produce a lower low.
5-day outlook — bearish SPX 1230-1250
30-day outlook — bearish SPX 1100-1150
90-day outlook — bearish-neutral SPX 1150-1250
 Stocks slumped last week as negative global cues out of the Eurozone and domestic political opposition to retail FDI soured sentiment. Despite briefly flirting with 17K, the Sensex lost 4% closing at 16,213 while the Nifty finished at 4866. While I thought we would see some downside, I expected it would arrive in the first half of the week when the Sun-Rahu aspect was tighter. As it happened, markets were mostly flat through Wednesday, and the sellers only showed up on Thursday and Friday. The proximity of Saturday’s lunar eclipse may have played a role in this bearish outcome which will coincide with a potentially destabilizing Uranus direct station. The bearish result was nonetheless in keeping with our medium term expectation as Saturn slowly approaches its opposition aspect with Jupiter in January.
The EU summit has produced a new agreement for a fiscal union which enhances financial accountability at the expense of national sovereignty. The UK has broken with the rest of the EU over this pact since it was unwilling to limit its national spending patterns and impose a financial tax on its lucrative London trading hub. While most global markets cheered this latest agreement for taking austerity seriously and limiting spending, it does nothing to address the larger issue of bank solvency. On Thursday, the ECB refused to unleash its financial bazooka to buy back bonds in a QE-type program made popular recently by the Fed’s Ben Bernanke. While we have seen some more measured moves to enhance liquidity, they have been cautious thus far. This is broadly in keeping with our astrological expectations since Saturn is beginning to exercise a greater influence here. The ECB did lower its lending rates to 1% last week and we did see the coordinated central bank move to loan dollars in the preceding week. These lesser moves were perhaps a reflection of the limited pro-expansionary effects of the Jupiter-Uranus aspect. But we are unlikely to get a full-blown money-printing move by any central bank at the moment as long as Saturn remains a key player in the sky. That means that Draghi’s hands in the ECB may be tied, as Merkel and Sarkozy were compelled to focus on fiscal arrangements only. Merkel is likely calling the shots here in any event, and Germany has no interest in boosting inflation and is demanding restraint and spending limits. That’s about as Saturnian as you can get. Interestingly, we can see the current opposition to FDI in the Indian retail sector as reflecting this conservative influence of Saturn. The need to protect markets is paramount here so that augurs poorly for retail liberalisation at the moment. Saturn and the emphasis on austerity and accountability will likely remain in place until January at least as it stays in tight geometric alignment with Jupiter, Uranus and eventually Neptune also.
 As expected, the 5100 level on the Nifty proved to be fairly solid resistance as Wednesday’s intraday reached that level but could not hold it. Friday’s decline filled a big gap below 4900 so now the bulls may be enticed into taking new positions. But such a move would be quite risky indeed since we now have a bearish crossover in stochastics and it has fallen below the 80 line. This suggests lower prices in the near term are a strong possibility. MACD is in a bullish crossover, but the histograms are shrinking and may argue for lower prices also as momentum has shifted. RSI (42) has fallen below the 50 level suggesting a bearish bias is in place now and after a recent visit to the 60 level, there is some reason to expect more downside. Friday’s close below the middle Bollinger band (20 DMA) may also hasten a trip to the lower band in short order at 4657. All three moving averages are in a bearish alignment now (20<50<200) and are all sloping down. The last time price moved below these three averages was in mid-November on the way to a re-test of long term support at the 4700 level. Of course, a positive development on the political front over FDI could radically change this bearish technical picture but it is important to note that the technicals are a burden on the market.
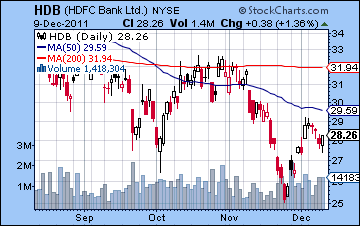
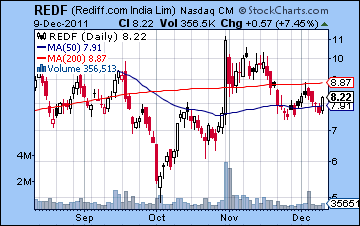
If 5100 is still important resistance, support is still at the critical 4700-4800 zone. Many bulls will no doubt be buying at this level in the expectation of yet another bounce. It may hold, but the Nifty is forming a rather large descending triangle which tends to breakdown eventually. Long positions are therefore that much riskier at those levels. The weekly chart perhaps shows this triangle pattern better. The weekly BSE chart also shows price clearly breaking below both the 13- and 34-week moving average. These moving averages are again pointing down and are still locked in a bearish crossover indicating a bear market in progress. MACD is still in a bullish crossover but momentum has clearly shifted as the histogram bars are shrinking. Worse still, stochastics are in a bearish crossover and are now below the 80 overbought line. A reversal down to the 20 line is perhaps more likely now. RSI has slumped back below the 50 line and may be headed lower. Perhaps the BSE will be headed down to the lower Bollinger band at 15,500. A break below support at 15,500 (Nifty 4700) would be quite dangerous as it would hasten a move first to 4500 and then perhaps all the way down to 4000. Rediff (REDF) illustrates the weakness of the current environment. Despite a massive surge at the end of October, it has gradually slipped back under the 200 DMA and is now clinging on to the 50 DMA. It failed to climb above the 200 DMA in early December, so any break below the 50 DMA could indicate lower lows ahead. As the debt crisis shows no signs of abating, financials are still under pressure here. HDFC Bank (HDB) shows a familiar pattern of lower highs and lower lows. This bearish pattern will only be reversed if it can hold above the October low. Since it failed to recapture the 50 DMA in early December, it seems a retest of the October low is not far off.
 This week looks like it could be bearish again. The culprit here is the Mars-Rahu aspect that will likely manifest in the first half of the week. Both planets are malefic so that increases the likelihood and the size of the decline we should expect. Moreover, it is hitting a sensitive point in the NSE horoscope so that makes it even more reliably negative. Since we are in the immediate aftermath of a lunar eclipse, we cannot rule out some sizable declines here since eclipses can sometimes act as magnifiers. The Jupiter-Uranus aspect will also be exact this week so that may act as some kind of support for the market. Nonetheless, these planets look quite negative to me and suggest another retest of 4700 is possible. It is possible that Monday could be higher but I would expect the weakness to manifest by Tuesday. Thursday’s open could be negative but recovery may occur by the close as both the Sun and Venus change their respective signs late in the week. This perhaps makes Friday more bullish than Thursday although I am somewhat uncertain about that. Both days should be net positive, however. While we will likely see two or even three up days this week, the Mars aspect looks stronger so I expect we will finish lower. If we test 4700 by Wednesday or Thursday, then we may finish near 4800 by Friday. Jupiter and Uranus are very tightly aspecting one another here so I would be somewhat cautious in my downside expectations here. We therefore cannot rule out another central bank intervention somewhere along the line that could cause a rally. But the close presence of Saturn means that extreme outcomes in both directions are more likely. The bottom line is the bears would appear to be favoured here as rallies will tend to be sold.
 Next week (Dec 19-23) may begin bearishly on the Sun-Saturn aspect. However, the week as a whole looks more bullish as both the Sun and Venus will aspect Jupiter and Uranus later in the week. Overall, this looks like a good set up for a rebound. The more important question therefore is: rebound from what level? Perhaps we get a second test of 4700 on Monday (or even a higher low) from which a rally ensues for most of the week. Weakness is likely by Friday, however. The following week (Dec 26-30) is quite mixed and hard to call. Jupiter ends its retrograde cycle on Monday and therefore should be quite strong and bullish. But then Mercury conjoins bearish Rahu by midweek. Jupiter would appear to be stronger here so perhaps the market melts higher. It’s hard to say. Then January arrives with a difficult Saturn-Rahu aspect. January seems more bearish with declines quite likely in the first week. A crash is possible at some point in January although I am unsure when it might occur. Bearish Mars turns retrograde on 23 January so that may figure into the larger scheme of things. If January is as bearish as I expect it to be, then 4000 is possible on the Nifty. February should see a reversal take place and rebound into March and the Jupiter-Pluto aspect. Jupiter-Pluto aspects are fairly reliable indicators of higher prices, as October’s rally coincided closely with a similar aspect. Another corrective move lower is likely to begin around 15 March and last into April. I am unsure if it will be a lower low. However, I am generally bearish about 2012 so we need to be mindful of the possibility of revisiting 2500 on the Nifty by year’s end.
5-day outlook — bearish NIFTY 4700-4800
30-day outlook — bearish NIFTY 4200-4600
90-day outlook — bearish-neutral NITFY 4500-5000
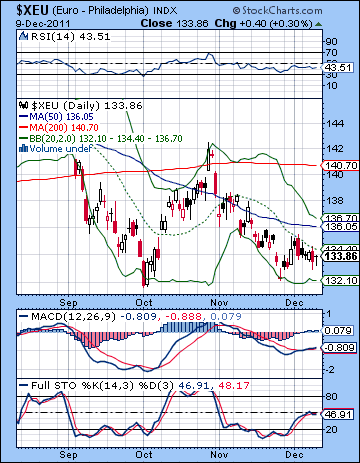 For all the sound and fury of the summit, fiscal austerity, and the ECB rate cut, the Euro ended the week largely unchanged just below 1.34. The USDX closed below its familiar 79 level while the Rupee weakened to 52. I thought we might see more weakness on the Sun-Rahu aspect but Friday’s summit stick save prevented a serious retest of support at 1.32. Early reaction to the new fiscal pact seems mixed, with skeptical critics insisting that nothing has really changed and the banking system remains under-capitalized and overexposed. More sympathetic observers are stressing the possibility that a more responsible approach to deficit financing will be better in the long run, even if it may not jump start growth any time soon. But with no major ECB action planned here to backstop the dubious debt of the southern tier, it seems like the Euro will run into more problems in the not-too-distant future. Fundamentals aside, the technicals actually look somewhat promising. The December low looked like a good retest of 1.32 from which is it mounting another rally attempt. MACD is in a bullish crossover here and there is a clear positive divergence forming. RSI looks limp and without any clear direction although it is also in a positive divergence with respect to the previous low. Stochastics has turned lower again, however. As promising as the technical picture may be, the Euro has yet to close above its 20 DMA at 134.40. That will be its first hurdle. Then it needs to rally to its 50 DMA and upper Bollinger band at 1.36-1.37. This would be fairly easily done from a technical perspective as it would not mark a substantive break with the overall down trend. It would simply be a bear market rally.
This week’s Mars-Rahu aspect could be troublesome for the Euro if only because the probable rise in fear is likely to undermine confidence in the floundering currency union. And yet the absence of any close hits to the Euro horoscope somewhat weakens the probability of a negative outcome. It’s still more likely than not, but the margin of error is larger than one would like. We should see a rebound by Wednesday or Thursday at the latest as Venus and Sun prepare to change their respective signs. So there is a possibility we could test 1.32 if Monday and Tuesday play out as expected. The rebound could well see the Euro return to current levels. I would not rule out a possible move beyond the 20 DMA by Friday. Weakness is likely early next week (Dec 19-23) but strength should return again for the pre-Christmas week. The Sun and Venus aspects to Jupiter could be quite bullish and push the Euro to the 50 DMA at 1.37 quite easily. The last week of December looks mixed and hard to call, but January could well be more bearish as Saturn moves into its closest aspect with Jupiter. Along with the Mars retrograde station on 23 January, I am expecting support at 1.30 to be broken with a possible low of 1.28. I would not rule out a shock move down to 1.20 but that seems a bit fanciful at this stage. February and March look more bullish but will likely only retrace a portion of the previous losses. The outlook seems unclear for the rest of this year. I would not rule out further weakness, but there may well be a rebound in the second half of the year. My long term expectations are very bearish. The Euro may well cease to exist by 2015.
Euro
5-day outlook — bearish-neutral
30-day outlook — bearish
90-day outlook — bearish
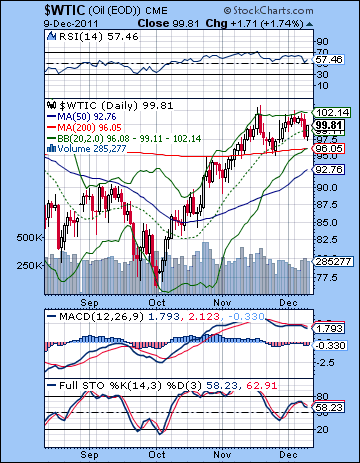 Crude edged lower last week as worries of slowing growth and reduced demand outweighed Eurozone optimism. WTI crude finished below $100 down about 1%. This outcome was largely expected although I thought we might see the downside manifest earlier in the week. The early week was actually stable with the negativity from the Sun-Rahu aspect only arriving on Thursday. As expected, Friday did see a partial recovery as the Sun-Venus aspect tightened. The technicals look vulnerable here as MACD is still in a bearish crossover and the histograms are getting larger. RSI may have peaked already although we can see a possible positive divergence with respect to the previous low. Stochastics are in a bearish crossover and Friday’s gain was not big enough to change that. The line is also pointing down. That said, Friday did see a reversal at the 20 DMA that managed to push price back above this support level. But with resistance close by at $100-102, there may not be enough incentive for bulls to go long. Support remains at the Nov 23 low and the 200 DMA around $95-96. This also matches the lower Bollinger band. In the event of a sell-off, this level would likely bring in buyers to push prices back toward the $100. Below $95, we could see a decline back to the previous interim high at $90.
This week looks bearish, at least in the first half. There is a Mars-Rahu aspect which is likely to force investors out of risk assets and into the Dollar. This aspect also hits a fairly significant point in the Crude Futures chart so the probability of a decline is somewhat increased. It is still not certain, however, due to the ongoing Jupiter-Uranus aspect. This is a bullish combination that could act as support in the event of any weakness. In any event, the decline seems more likely to occur on Monday or Tuesday. A recovery is likely to be underway by Wednesday as the Moon transits Cancer. The Sun and Venus also change signs late in the week so that should help prices to rebound. We could easily test support at $95 early in the week, but the rebound may also be quite substantial by Friday. I would lean towards an overall down week, although I would also not be surprised to see a slightly positive outcome either. Next week looks like it will begin bearishly on the Sun-Saturn aspect. The bulls will run again by midweek, however, as the Sun and Venus form aspects to Jupiter. Crude may well stay elevated close to $100 through to the end of December. By January, I am expecting greater weakness to take hold. At that time, I would expect support at $90 to be broken to the downside (assuming that it stays below $100 beforehand) and we could see a decline to $80. Another rally is likely in February and March but more weakness is probable starting in mid-March and lasting into April. This could well produce lower lows.
5-day outlook — bearish-neutral
30-day outlook — bearish
90-day outlook — bearish-neutral
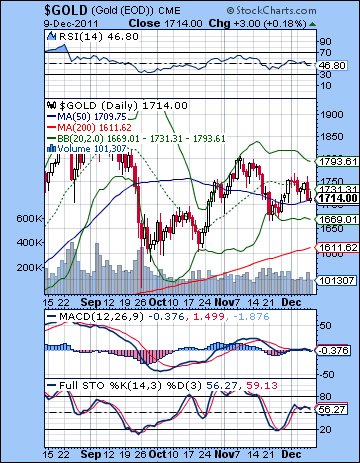 With the ECB refusing to undertake any QE-style bond buyback, gold lost ground last week losing more than 2%. It closed at $1714. This bearish outcome was in keeping with expectations as I thought the early week Sun-Rahu would be negative. Monday turned in a losing day with a midweek rebound into Wednesday. Thursday’s decline was somewhat unexpected, although it did partially reflect the Sun’s weakness. Friday’s rebound was more modest, however, as I thought the Sun-Venus aspect would bring in more buyers. Gold remains in a large triangle pattern here as Thursday’s high tested resistance in the falling trend line while Friday’s low tested support. The range of this pattern gets narrower with each passing weak so it presumably won’t be long now before there is a break out one way of another. Gold is currently near support from the 50 DMA at $1700. A break lower would likely mean a hasty visit to $1600. A break out higher above the previous high of $1750 could invite a retest of $1800. As a possible reflection of this see-saw battle, MACD is flat and shows no bias one way or the other. This is perhaps reminiscent of the Euro before it break below support. Longer term, gold remains in the upper half of its rising channel that started back in 2007 when it bottomed at $400. Slowing inflation data from China and India suggest that gold’s inflation hedge may be less attractive here. Only a massive (and unlikely) intervention by the ECB would make the inflation play attractive once again. The US Fed is currently unable to print more money due to domestic pressures against bigger deficits. Gold likely needs a new chapter in the ongoing financial drama before it gets a fresh boost. Even there, it is just as likely going to be sold off to raise cash if there is another round of de-leveraging.
This week looks like more difficulties for gold as the Mars-Rahu aspect in the early part of the week is bearish. This is unlikely to correlate to inflationary moves and seems a reflection to greater slowdown fears. This is likely to test support at $1700 by Tuesday or Wednesday. Given how close gold already is to this level, there is a reasonable chance that we could move below $1700, perhaps significantly so. Some decent rebound is likely by Thursday and Friday, however, as both the Sun and Venus will strengthen as they enter new signs. Next week is likely to begin negatively on the Sun-Saturn aspect but some bounce is likely by midweek at the latest. The short term aspects look positive here so I would expect gains overall. The end of December will likely have a bullish bias given Jupiter’s direct station on the 26th. But it seems unlikely that gold can recapture $1800 or even $1750 by that time. January seems negative given Saturn’s opposition to Jupiter and we could see a sizable retrace to $1600 or below at that time. After another rally into March, a further corrective move into April and May could see gold make new lows. While we could see a significant rally in 2012 — especially between June and October — gold is unlikely to break above its recent highs of $1900 anytime soon. A deeper correction seems more likely.
5-day outlook — bearish-neutral
30-day outlook — bearish
90-day outlook — bearish-neutral