- Stocks likely to decline early in week; midweek rally probable, with weakness returning by Friday
- Dollar mixed with losses at midweek
- Crude vulnerable to more losses, especially late in the week
- Gold bearish early, then rebound likely midweek
- Stocks likely to decline early in week; midweek rally probable, with weakness returning by Friday
- Dollar mixed with losses at midweek
- Crude vulnerable to more losses, especially late in the week
- Gold bearish early, then rebound likely midweek
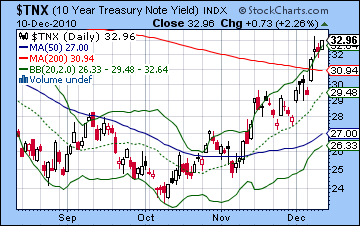
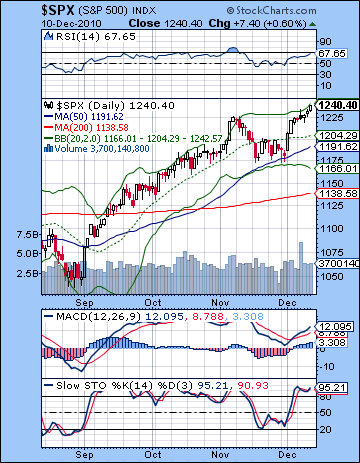 Stocks in New York drifted higher last week as improving domestic economic data overshadowed inflation concerns abroad. The S&P500 gained more than 1% to close at 1240, its highest level since 2008, while the Dow edged slightly higher at 11,410. This mildly bullish result was not unexpected given the array of influences in both directions last week. While I was wary of the potential of sudden down moves around the current quadruple conjunction, I was not convinced that we would see much downside given the Mercury-Venus aspect. The bulls generally carried the day here as the early week decline was quite muted, although the recovery was fairly tepid also, no doubt reflecting the significant amount of overhead technical resistance at current levels. The early week did have some of the bearish influence of the Sun-Saturn aspect, but prices generally turned higher after that as the Mercury got a boost from Venus. I had also been unsure about Friday given the mix of aspects, and we ended with a modest gain. While sentiment remains positive here, the market is still fairly tentative about breaking out to significantly higher levels. That may reflect the ongoing tug of war between the bearish Rahu-Pluto conjunction and the bullish Jupiter-Uranus conjunction. The market did undergo a small correction through much of November when the Rahu-Pluto pairing was in closer proximity, but the approach of Jupiter in the past two weeks has corresponded with modest moves to the up side. While I was bearish for the November period, my error here was in thinking that the correction would continue into mid-December. Certainly, I had noted the possible upside from the Jupiter-Uranus conjunction but I thought it would manifest in the second half of December and in early January. So its seems that the bulls are getting a bit of a head start here as prices stay fairly buoyant here in spite of some significant negative planetary alignments. In a sense, the bulls and bears are manifestations of these planets as the bulls argue that continued Fed liquidity will prop up stocks no matter what, while bears are more sensitive to the manipulated nature of the market (Rahu-Pluto) through Fed intervention and the impending blow up of the international bond market as a result of the Fed’s (and the ECB’s) intervention. Bond yields continue to climb here as treasuries had their worst week in a long time with the 10-year yield rising to 3.30%. Higher treasury yields won’t bring down the equity market by themselves, of course, but there is growing talk of Bernanke losing control of yields and with it, his ability to manage the growing US debt. At what point will he be forced to step in and drain some liquidity which would send stocks lower? No one knows for sure, although 4% on the 10-year would definitely send some danger signals. We may still be a few weeks away from that.
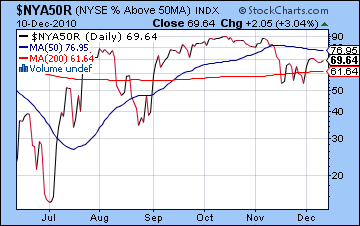
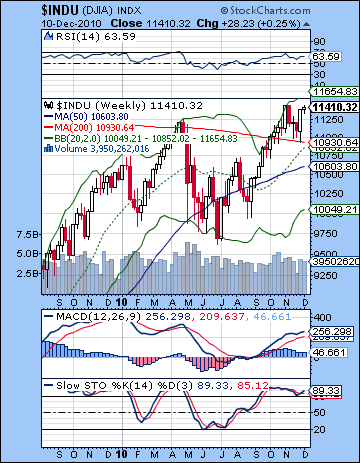 Bulls have pushed prices into the current rising wedge pattern off the July low. Last week’s action saw price drift towards the resistance line of the wedge around 1250-1260. If the S&P does get to that level, there will be good technical reasons for selling, at least until the bottom wedge support line around 1210. The ability of the S&P and the Dow to stay above their respective breakout levels is definitely a bullish indication, although all bets would be off if and when the upper wedge resistance line is reached. The S&P is pushing up against the upper Bollinger band here which is another sign that it may pullback in the near term. If its retracement to the 50 DMA at the end of November gave a plausible long signal, then its pressing against the top BB and the wedge resistance would be an equally plausible short signal. MACD is still in a bullish crossover although it is still in a negative divergence with respect to previous highs. What’s more interesting is that even if it moves a little higher to 1250, the MACD level will still be lower than in November and thus will form a more compelling negative divergence. RSI has run all the way to 67 which is getting into nose bleed territory. It could still press higher of course, but the upside looks limited. The weekly Dow chart looks somewhat bullish here, as it is managing to stay above support of the 200 WMA at 10,930. If (or rather) when the Dow closes below 10,930 over a few days, it will likely accelerate selling as weak bulls will be more likely to pull the plug. But the RSI shows a series of lower peaks since April so that will weigh on the minds of bulls in the event that it turns lower from 63 in the near term. Last week I noted how the number of stocks above their 200 DMA showed a negative divergence with respect to November (and April for that matter). This week we can see that the same applies to the number of stocks above their 50 DMA. While it is off its recent lows, it has not climbed back to its November high. This is a negative divergence that suggests that despite the new highs, the rally may be narrowing in breadth. This is often a sign of a rally on its last legs. As noted above, the yield on the 10-year treasury climbed to its highest level since June — 3.3%. This is bad news for the Fed, which is feverishly buying up treasuries in order to free up investment cash elsewhere and keep rates low. At the moment, it’s not working. Let’s see if the yield can stay above the 200 DMA even in the event of a pullback. That would be a very bearish sign for treasuries as it would suggest that yields are going much higher down the road. In terms of S&P support levels, the area around 1190-1210 is crucial. 1210 marks the bottom of the wedge so that a breakdown there would see prices fall quickly to 1191 and the 50 DMA and probably a little below. An arguably more important support level is the previous November low around 1175-1180. Once that is breached to the downside, we could have a waterfall effect and we would get to 1130 quite soon thereafter. I don’t expect 1200 to be broken until after Christmas at the earliest, and likely 1180 will hold until January in any event. 1130 (or lower) will probably be tested by February at the latest.
 This week sees the conclusion of the quadruple conjunction of Mercury, Mars, Rahu and Pluto. Admittedly, it has been a complete bust thus far on the downside as the Jupiter-Uranus conjunction has filled in the gaps and boosted sentiment. That said, there is still some potentially important down days likely this week as Mercury conjoins Mars-Pluto on Monday/Tuesday and then Rahu on Thursday. Both of these influences should be seen as bearish. Tuesday is perhaps more bearish than Monday, and I would not rule out even an up day on Monday. Some midweek strength is likely on the Sun-Jupiter aspect so we should expect at least a day of gains on Wednesday or perhaps early Thursday. Friday could go either way, although I would lean bullish here due to the Sun-Uranus aspect. While some big down days (>1%) are possible here, we may not finish lower overall. While we could push higher temporarily (Monday?), we will likely remain in the rising wedge this week. A more bullish outcome would see a gain Monday to 1250 (top of wedge resistance) and then a drop Tuesday to 1230-1240, followed by another rise Wednesday to 1250, followed by a some choppy markets until the end of the week which leaves us around 1240-1250. A more bearish scenario would see a drop on Monday and into Tuesday as a signal of the strong Mercury-Mars influence. This could take the S&P down to 1210 (bottom of wedge support) and then up Wednesday to 1225 or so and then down Thursday and Friday to 1210-1220. While I wouldn’t be shocked to see us around 1210 by Friday, I do think the bullish scenario may be more likely here so there’s a better chance we’ll end up near current levels or a little above. That said, we may well put in an medium term top here after which the market may start to decline.
 Next week (Dec 20-24) will be holiday-shortened with a Friday closing for Christmas. While this is usually a fairly quiet time with a bullish bias, there will be a lunar eclipse on Tuesday the 21st that could liven things up. The early week looks somewhat bullish on the Mercury-Uranus-Neptune pattern but things could shift abruptly on Tuesday or Wednesday as Venus forms an aspect with Saturn. The following week (Dec 27-31) looks much more bearish as Mars squares Saturn. I would expect a significant down move here that tests at least one or more of the key support levels. After a couple of nice up days on the Venus-Jupiter aspect, January may begin to tilt towards the bears. Look for the late December down move to likely continue into the second week of January. Some mid-January lift is likely, however, but time is on the side of the bears as Saturn prepares for its retrograde station on Jan 26. This is a particularly difficult station this time around because it will be in bad aspect with Mercury. It will likely correspond with a major move lower that lasts in February. There is an open question of just when we make the medium term high — in December or January before heading lower to test 1130? I would lean towards a December high — perhaps this week — although I recognize it could also be January. There does seem to be a lift in mid-January that could boost stocks by 5% in any event but whether it’s enough to make new highs is more uncertain. I would be fairly skeptical about reaching 1300 by January, however. But the move lower in January-February looks sizable and should retrace 15% at least. This would make a retest of 1130 more likely. That said, I do think that 1130 is a bare minimum here, and a retest of 1040 may be just as likely. So Q1 2011 looks quite bearish, with recovery likely in Q2 that lasts in July. This should be a significant rally that may well challenge the highs we put in over the coming weeks. As always, the sword of Damocles hangs over the market in Q3 as Saturn is in aspect with Ketu while Uranus is in aspect with Pluto. Both are bearish influences.
5-day outlook — neutral SPX 1230-1250
30-day outlook — bearish-neutral SPX 1180-1220
90-day outlook — bearish SPX 1100-1200
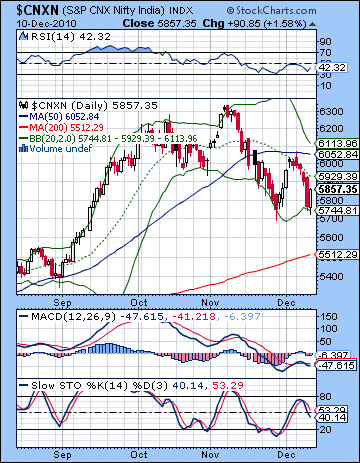 Stocks in Mumbai tumbled last week as the 2G phone scam and more inflation worries ushered investors to the exits. Despite Friday’s strong showing, the Sensex fell more than 2% to close at 19,508 while the Nifty finished at 5857. While I had leaned toward a more bullish outcome here, I had been quite tentative in my forecast due to the oncoming quadruple conjunction between Mercury, Mars, Rahu and Pluto. I thought we might see some upside Monday in the aftermath of Jupiter’s entry into Pisces and prices edged higher. That set the stage for the bearish Sun-Saturn aspect which took prices lower on Tuesday, Wednesday and especially Thursday. I underestimated the extent of the Sun-Saturn affliction as I expected it would not last so far into the week. I had also thought we would see more upside on the Mercury-Venus aspect but most of that upside was saved for Friday’s session. While I missed the short term moves here, it was more heartening to see the continued bearish effects of this quadruple conjunction. This four-planet alignment makes its closest pass this week so it opens the door to further downside moves. At the core of this alignment is the Rahu-Pluto conjunction that has been in effect since early November and has corresponded fairly closely with the market correction. Rahu (greed, distortion) and Pluto (power, large organizations) have had their fingerprints over many sources of uncertainty in the past weeks as we have seen a number of Indians scandals (2G, housing loans) as well as international ones (WikiLeaks). Being faster moving planets, Mercury and Mars have ratcheted up some of these issues as they approach their conjunctions with Rahu and Pluto in the coming days. If this was the only dominant aspect in play, the market would likely have fallen much further than it has. This bearish combination represents all those anxieties about the current financial environment: QE2-incited inflation in India and China and the Eurozone debt crisis. However, much of these same problems can be seen from a more bullish light. The flood of liquidity from the US Federal Reserve has pumped up asset prices all over the world and with Ben Bernanke promising to continue this practice, it seems that there is nowhere else for global stocks to go but up. This kind of blind optimism is a reflection of Jupiter (0 Pisces) and its approach to Uranus (2 Pisces) for its final conjunction in this series on 3 January 2011. As this conjunction gathers steam, its relentless optimism may well serve as a floor under the market so that support levels remain intact. So it essentially a tug of war where bulls and bears are each motivated by different planetary energies. While the market has moved down recently, there is a greater likelihood of a range bound trading in the near term as these opposing forces work themselves out.
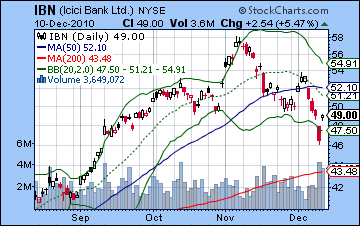
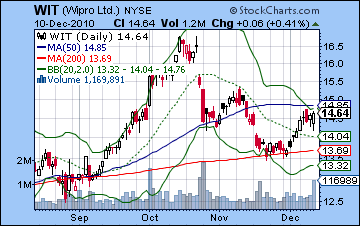
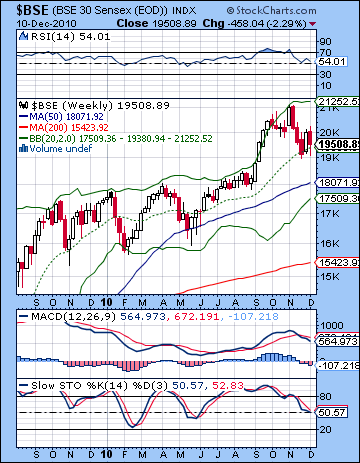 The bulls stumbled last week as the 50 DMA at 6052 proved to be solid resistance above which the Nifty could not move. Bulls may attempt another run at this important resistance level in the days to come but it may well become an important line in the sand going forward. Another advance to that level may well bring out the sellers. In addition, the 50 DMA itself is now falling (along with the 20 DMA) and that is an additional bearish burden on the market. But the bulls can point to the fact that the Nifty did appear to bounce of plausible support near the bottom Bollinger band on Friday morning. It is an even more convincing support level since it was actually a little above the previous low thus suggesting a reservoir of buying interest to come. Also, we can see how the previous resistance from the rising channel dating back to 2009 may well be acting as support here in the 5700-5750 range. So these different features build a case for a range bound Nifty perhaps as long as support can be found near 5700 and resistance stands at 6050. In the event of a new rally attempt, the falling channel from the November peak may also act as resistance at the 6000 level. A break above that would likely prompt a quick test of 6050. The technical indicators actually lend support to the notion of another rally attempt as the RSI (42) forms a positive divergence with respect to the previous November low. The same divergence can be seen in the MACD. While this corrective phase has been protracted over five weeks, it has still been fairly shallow thus far. The weekly Sensex chart shows that the pullback has only made it as far as the middle Bollinger band line, the 20 WMA. Since I am expecting a deeper correction in the coming weeks, it seems likely that the lower support levels will be tested here, either the bottom Bollinger band at 17,500 or perhaps the 50 WMA at 18,000. And despite the pullback, we can see how the Stochastics for the weekly BSE chart has only travelled to the 50 level. While this not preclude another swing higher, it does suggest that over the medium term, it will eventually get down to the oversold 20 level. The precarious nature of the Indian market is reflected in individual stocks charts such as ICICI Bank (IBN). In its New York chart, its decline last week filled a big gap around $46 after which it bounced strongly. However, the price action last week took it below its 50 DMA and therefore any rally will have to contend with this resistance level down the road. Even worse, we can spot a bearish head and shoulders pattern confirmed with Thursday’s break below the neckline at $50. Friday’s rally may only return to kiss the neckline goodbye before it heads lower still. If this pattern plays out, it projects a price of $42 which would be below the 200 DMA. As exporters staged a comeback last week, Wipro (WIT) has bounced off support at the 200 DMA and is now headed to test resistance at the 50 DMA around $15. If it can close above the 50 DMA, then it offers some prospects for further upside.
 This week will see both bullish and bearish influences in play in this holiday shortened week. The quadruple conjunction will largely complete this week so there will likely be at least two down days. Monday and Tuesday will feature Mercury’s conjunction with Mars and Pluto. Actually, the exact conjunctions here occur on Tuesday so that opens up the possibility — but not the probability — of a gain on Monday with a greater likelihood of a larger decline on Tuesday. The two-day period over Monday and Tuesday should be net negative, however. The midweek period looks more bullish, however, as the Sun is in aspect with Jupiter. This should revive confidence and encourage more buying, probably on Wednesday. Thursday looks more bearish again as Mercury will conjoin Rahu. While the Sun-Jupiter pairing will still be close by, the odds are greater for a decline on Thursday. Overall, there is a good chance we will finish at or below current levels, although Monday’s session may tilt the balance. If Monday is lower, then it will boost the chances for a lower week. If we were to see weakness early on, there is still a good chance that previous support levels would hold around 5750 before turning higher by midweek. With Thursday likely lower in this bearish scenario, we might finish around 5800. But a more bullish scenario would have the Nifty rising on Monday with a pullback to current levels by Tuesday. Wednesday’s probable rise would then take it back towards 6000. I would not rule out a retest of 6050 here although that seems somewhat unlikely.
 Next week (Dec 20-24) could begin bullish on the Mercury-Uranus aspect on Monday and perhaps Tuesday. But Tuesday’s lunar eclipse may shake things up a bit and increase volatility once again. I am not expecting any major moves down here, but it is less conducive for further gains during the rest of this week. So there is a good chance the Nifty will continue to trade in the 5700-6050 range at this time. The following week (Dec 27-31) looks more bearish, however, with larger moves lower possible on Monday and Wednesday/Thursday. Mars is squaring Saturn here and that often creates tension and nervousness that translates into selling. There is a real chance we could test support at 5700 around this time. The first half of January looks fairly choppy but we may see some kind of small rally in the middle of the month. The second half of January looks more bearish, however, as Saturn turns retrograde. I am expecting lower lows in February, probably testing support at the 200 DMA at 5500. In general, Q1 2011 should be bearish with a recovery likely in Q2. Another significant top will likely form in June or July which will be followed by another move lower going into September. At this point, the mid-year intermediate top does not look higher than current levels. September’s aspects are quite bearish so there is a good chance for a lower low at that time. We may even have a replay of sorts of 2008 as Saturn, Ketu and Uranus are all involved in close aspects in that period.
5-day outlook — bearish-neutral NIFTY 5800-5900
30-day outlook — bearish NIFTY 5600-5900
90-day outlook — bearish NIFTY 5200-5600
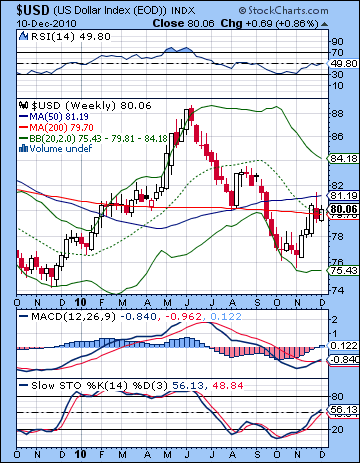 The Dollar gained ground last week on improved US economic prospects as it closed above 80. The Eurodollar fell back to 1.323 while the Rupee edged lower to 45.12. I had expected a fairly flat outcome with a possible early bullish bias and that is more or less what we got, although the greenback did manage to hold onto gains quite well. It seems that the Euro is having problem finding its footing here, even as the Ireland bailout fades into memory. The Dollar bounced off the 20 DMA and continued to ride it higher, although it has yet to make a concerted run at its 200 DMA at 81.7. This roughly corresponds to 1.37. So the Dollar is trapped in a purgatory of sorts here between the 50 DMA (78) and the 200 DMA (81) and until one of them breaks, investors will remain quite cautious as it seeks direction. While the daily chart looks ambiguous, the weekly chart offers more upside potential as MACD is in a bullish crossover below the zero line which is often correlated with further upside. Stochastics (56) have climbed all the way off the bottom and may well have further to go. The Dollar has traded around its 200 WMA over the past few weeks here so it seems poised to either rise further to test resistance at the falling trendline around 88 or sink back to support around 76. This chart could go either way, but the indicators offer some evidence for further upside.
This week looks like a mixture of influences as the midweek Sun-Jupiter promises to take the Dollar lower. Around that influence, however, there is a reasonable chance for gains as Mercury’s rough ride with Mars and then Rahu could make investors more risk averse. So we could see an early week dip for the Eurodollar towards 1.31 but the Sun-Jupiter will be hitting some good points in the Euro’s natal chart so there really is a good case for some further upside in the Euro here. The late week period should be fairly bearish for the Euro. Next week does not stand out clearly one way or the other, although after Tuesday’s eclipse, the Dollar may pick up some momentum. With a correction in equities likely after Christmas, there is a good chance for more upside going into January. Whether we get all the way to 88 is unclear, but it is definitely a possible outcome. If we were to get to that level, it would be important that we break above some key resistance levels in the next two weeks. So if the Dollar can move above 82 by the last week of December, then that increases the likelihood of a run to 88. This would be equivalent to about 1.20 on the EURUSD.
Dollar
5-day outlook — neutral-bullish
30-day outlook — bullish
90-day outlook — bearish-neutral
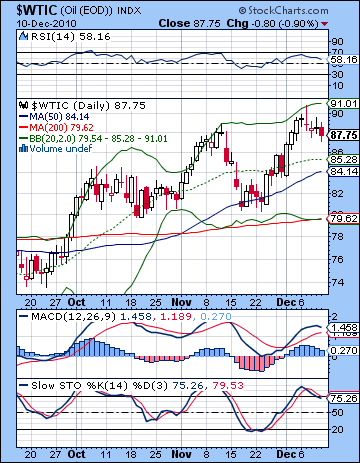 Crude pulled back last week on growing likelihood of an interest rate hike in China. After briefly trading above $90 Tuesday, crude finished below $88. This outcome was largely in keeping with expectations as I thought the early week Sun-Saturn aspect would see sellers prevail. While Monday was higher, Tuesday saw the trend reverse, albeit only modestly. The midweek recovered somewhat on the Mercury-Venus aspect while Friday’s Mars-Rahu conjunction took prices lower. The decline last week was largely technical in nature as Tuesday’s intraday high neatly bounced off the top Bollinger band. A further pullback towards the middle line at $85 would not come as a shocking surprise to anyone. But the chart still looks bullish as all moving averages are still rising. However, we could be seeing the first signs of trouble here as MACD may be rolling over. It is already in a negative divergence so the prospect of a rollover here could mean lower prices in the near term. RSI (58) is falling and is showing a series of lower highs. While price has climbed throughout that period, it is likely not going to continue indefinitely. Eventually, price will have to catch up to relative strength. Stochastics (75) have slipped below the 80 line now and may also be signaling a deeper move lower. Of course, this may simply be a fake out, but given that price is still above the 20 DMA, a move lower seems somewhat more likely than another move higher. Support is likely around the 50 DMA ($84) as well as the rising trendline off the summer lows. Currently this trendline lies at $82. Resistance is from the rising trendline now at $92.
This week looks somewhat bearish for crude. The early week period tilts negative as Mercury (speculation) encounters both Mars and Pluto on Monday and into Tuesday. The midweek Sun-Jupiter aspect should produce at least one up day, and possibly two. Wednesday seems to be the safest bet for an up day, although I would not rule out a second one, perhaps on Tuesday. While Tuesday is damaged by the Mercury-Mars aspect, the Moon is in Pisces with Jupiter and Uranus so this could boost sentiment for crude. Perhaps this will reduce the downside. The end of the week looks more negative gain as Mercury conjoins Rahu. Thursday is perhaps worse than Friday although we could see declines on both days. I would not be surprised to see $85 in the early week followed by another run to $88 and then down again. Next week starts bearishly I think as there are two separate afflictions in the Futures natal chart. Some upside is possible midweek before the Christmas break. The week after Christmas looks more bearish still, so we may break through that trendline support ($82) at that time. Some rally is likely in early January but it is unlikely to continue through the month. I am skeptical if it will break above $90. Another significant correction looks likely after Saturn turns retrograde on January 26.
5-day outlook — bearish-neutral
30-day outlook — bearish-neutral
90-day outlook — bearish
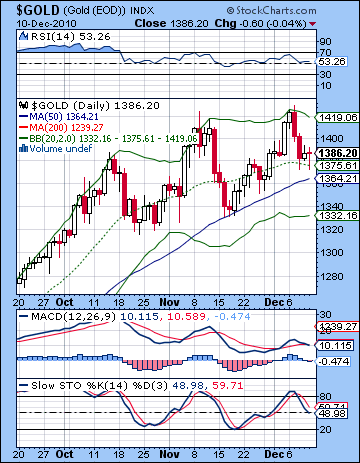 Gold declined last week as currency uncertainty receded in the wake of the Irish bailout. After trading as high as $1430 intraday on Tuesday, it closed 2% lower at $1386. This outcome was largely in keeping with expectations as I thought the early week Sun-Saturn aspect would correspond with losses. The timing was a little off, however, as gold moved lower on Tuesday but then continued to fall through Wednesday also. I had thought we would get more of a midweek bounce on the Mercury-Venus aspect and that only manifested with Thursday’s tiny gain. As expected, things got more tentative late in the week as Friday saw another decline. The planets were more equivocal than the early week period so the loss was perhaps correspondingly smaller. Friday’s session saw gold touch the 20 DMA and then bounce back higher. So we are seeing some support here at fairly high levels. The 50 DMA ($1364) should also be seen as an important support level as a breach there would likely signal a deeper move lower. As if the punctuate the importance of this support level, the 50 DMA also roughly corresponds with the rising trendline off the recent low. Even if $1364 is broken, there will be buyers are previous lows around $1320 although they will be hard pressed to keep prices rising if the 50 DMA has been violated. Resistance is likely at the previous high of $1430. After that, the next level of resistance follows the rising trendline to about $1450.
This week looks mixed as the early part of the week may see fallout from the Mercury-Mars conjunction. I would therefore expect more downside there before it turned higher on the bullish Sun-Jupiter aspect for Wednesday. It is important to note that the Sun-Jupiter aspect is a more reliable mover of gold than the Mercury-Mars. In that sense, the upside seems a more likely outcome than the earlier downside. The late week Mercury-Rahu is also bearish for gold, although it may not be enough to offset the midweek gains. I would be cautiously bullish here although a bearish result would not surprise me either. Early next week looks bullish as the Sun approaches Rahu but the late week Venus-Saturn aspect could erode most if not all of those gains. Declines look more likely after Christmas and in early January. We could see the 50 DMA tested as soon as the week of Dec 27, although it could wait until Jan 10. At that time, I would expect the previous lows of $1320 to be in play, if we haven’t already blown past them by then. The correction could well extend into February and could be fairly deep.
5-day outlook — neutral-bullish
30-day outlook — bearish
90-day outlook — bearish

