- Stocks to rise on Mercury-Jupiter early in the week; destabilizing eclipse period begins
- Dollar choppy with continued bullish bias into January
- Crude mixed with early losses offset by midweek gains
- Gold may rebound into midweek then major declines more likely after Christmas
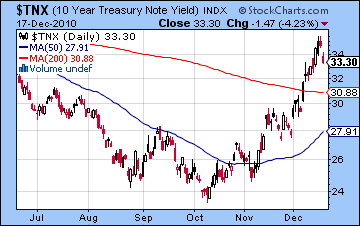
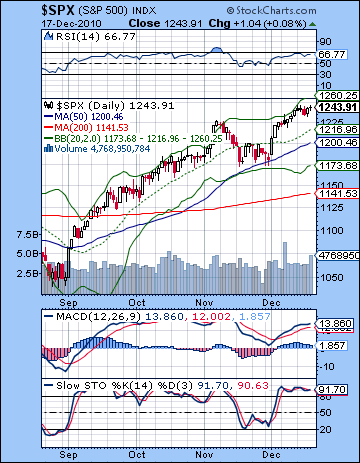 Stocks finished slightly higher last week higher as the Fed reiterated its pledge once again to backstop the lethargic economy, regardless of the consequences. The Dow closed at new highs for the year at 11,491 while the S&P500 finished at 1243. This neutral outcome was largely in keeping with expectations, although I thought we would have more price movement given the tightness of the different aspects in play. The much-ballyhooed quadruple conjunction early in the week ended with barely a whimper as stocks were mostly flat and then saw a very modest decline on Wednesday. At least we can now put it behind us and look forward to the approaching Jupiter-Uranus conjunction and the coming eclipse period. Another source of disappointment was the relatively constrained upside on Thursday. I had expected more gains midweek (Wed and Thurs) but only Thursday saw the bulls rush in. As expected, Friday was less positive than Thursday and we finished mostly flat. All in all, another week of Chinese water torture as the wall of worry has morphed into a room of padded walls with a ready supply of tranquilizers. Complacency is all the rage here as the $VIX approached its lowest levels since April (!) but we should not be overly shocked given the ongoing Jupiter-Uranus conjunction. These two planets are proving to be the bulls’ best friends as they embody the view that the market cannot move significantly lower as long as Bernanke has an endless amount of cash to buyback treasuries. This frees up available capital for riskier investments like stocks because it depresses debt yields. Oh wait a minute — that’s not happening. The Fed’s QE2 plan to keep bond yields and mortgage rates low has been given the thumbs down by the market as the 10-year rose to 3.5% this week. If and when yields rise above 4%, they will be a very tempting alternative to equities and could spark a flight from stocks. Of course, optimistic Jupiter doesn’t make its exact conjunction with risk-loving Uranus until January 4, 2011 so it is conceivable there could be more bullish fuel in the tank. In fact, I would lean towards such a bullish view were it not for the fact that we enter an eclipse period this week starting with Tuesday’s lunar eclipse. Eclipses are famously destabilizing phenomena and are synonymous with changes in prevailing trends and interruptions of the status quo. They tend to be bearish in any event, but given the fact that the market is at its medium term highs, there is an additional risk factor of a significant correction over the next three weeks. Eclipses usually arrives in twos, so we will get a lunar eclipse this week on Tuesday and then a solar eclipse on Jan 4 — the very same day of the Jupiter-Uranus conjunction. That’s quite a coincidence indeed and increases the likelihood of a larger than expected correction and a major reversal in sentiment . And it doesn’t hurt that we got a confirmed Hindenburg Omen last week either. As I see it, there is now only a small chance that the market will continue to rise into early January. I believe the Jupiter-Uranus conjunction will "peak" a little prematurely. It seems more likely that the cracks will start to show right around Christmas, probably immediately afterward.
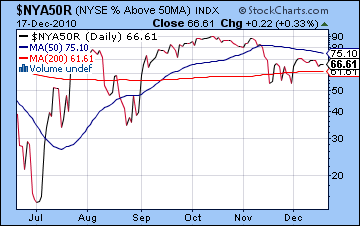
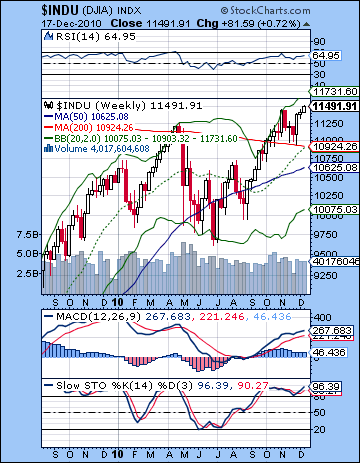 The big technical news last week was the confirmed Hindenburg omen on Tuesday and Wednesday. According to the track record of this technical indicator, the market now has a 77% likelihood of at least a 5% decline within the next 30 days. Larger declines have a lower probability, although they are still quite significant. So that is a very bearish signal that dovetails nicely with our expectations of a significant decline in the week after Christmas and the Mars-Saturn aspect. As expected, the S&P remained firmly within the rising wedge although it has not quite touched resistance at 1255-1260. It is still possible we could see further upward drift to that level before a reversal lower. Support from this wedge is now around 1215-1220 so a break below might hasten a larger pullback. After that, the next support level may well be the 50 DMA at 1200 as the November correction only retraced as low as the 50 DMA before reversing higher. If the correction goes lower than that as I expect it might, then we could see the rising trendline off the March 2009 low tested at 1160. Below that, there is an intriguing confluence of the 200 DMA at 1140 and the 1130 IHS neckline from earlier in the year. This is perhaps a more plausible downside target in the event that the correction picks up steam into early January. RSI (66) is pretty close to being overbought although it may still have a little bit to go. MACD is looking pretty flat here and may be in the early phases of rolling over. The weekly Dow chart still does not inspire much medium term confidence as negative divergences are evident in the RSI and MACD. However, as long as the Dow stays above 10,900 (200 WMA), long term bulls will remain fairly comfortable in their positions. A 5% pullback would test this support level and is roughly equivalent to 1180 on the S&P. The astrology suggests that should be doable by the last week of December or the first week of January. As noted above, the $VIX (16) is testing April lows (15) here suggesting that complacency may becoming a problem. When a long trade becomes this crowded, there may be no one left to sell to when people decide to head for exits. The risks of another flash crash therefore increases. Bond yields may have temporarily topped here as late week trading saw a significant rebound and we got a bearish hammer candle on the weekly chart. Perhaps they will decline back to the 200 DMA and the breakout level of 3% before the final blow up comes in January and February. And we see a further narrowing of the rally as evidenced by the number of stocks above their 50 DMA. I had previously noted a divergence here, but the new highs this week occurred with even less participation. This is another bearish signal that when coupled with the Hindenburg Omen paints a bearish technical picture of the immediate future.
 This week’s highlight is the lunar eclipse on Tuesday, and yet I do not expect much negative fallout from it just yet. Eclipse effects often do not manifest immediately but rather unfold over a period of time — usually 1 to 3 weeks. We recall that while the January 2010 correction occurred during an eclipse period, the first eclipse occurred on Dec 29, 2009 but the market kept rising into mid-January. That was the same time the second eclipse occurred (Jan 15) and the market topped four days later. So this week we could well see more upside because there are a couple of mostly bullish aspects in play. There is a Sun-Mercury conjunction before Monday’s session that could lift sentiment, and then Mercury will be in aspect with Uranus and then Jupiter through Tuesday and possibly into Wednesday. I think Tuesday has better bullish credentials than Monday, although we should be net positive over both days. Things could take a turn for the worse by Wednesday, however, as Venus moves into aspect with Saturn for the end of the week. Admittedly, with Friday closed, Thursday’s session could be fairly quiet but I do think there is a good chance for some downward movement. A more bullish unfolding would see gains on both Monday and Tuesday towards the wedge resistance level of 1260 and then down towards 1240-1250 by Thursday — pretty much where we are now in other words. If things turn unexpectedly bearish, then the early week upside is likely to disappoint somehow (Monday down?) with Tuesday’s more probable gain back up to 1240 and then the end of the week coming in near the bottom support of the wedge at 1220. I would favor the bullish outcome here though.
 Next week (Dec 27-31) is the best chance for a significant decline as Mars is in aspect with Saturn. The exact square occurs at the open on Wednesday the 29th so that is perhaps a more likely focus of energy. The early week looks bad in itself as the Moon will be in Virgo with Saturn and the Sun conjoins Pluto. I would not rule out a flat or up day on Monday or Tuesday due to the Mercury-Venus aspect, but the bullish energy there does not look very strong. I would expect the bottom of the wedge at 1220 to be tested and very likely broken here and there is a real chance we could go lower to test the rising trendline at 1160. This has some impressive planetary energies at work here so losses could be both sudden and large. Some recovery is possible at the end of the week. The first week of January looks volatile with large moves in both directions likely. Jupiter conjoins Uranus on Tuesday the 4th while in aspect with Venus during a solar eclipse! It could be a three-ring circus. There is a good chance that Monday, the first day of 2011 is positive, however. And I would not rule out a positive Tuesday either, although the chances seems somewhat less. Another significant decline is likely on either Tuesday or Wednesday with Wednesday looking more negative. The end of the week also tilts bearish on the Sun-Saturn square. We could well see some kind of intermediate bottom formed at that time. After that, a bounce is more likely going into the middle of January but this may only lift prices about 5%. In other words, it does not seem enough to regain current levels. So a lower high in mid-January could set the stage for another larger move lower starting around Jan 18th, with deeper declines likely around the 26th on the Saturn retrograde station. I expect this downward move to be quite large, perhaps up to 20% and extend well into February. It is also possible that it is protracted into March and thereby less violent. The lows in February or March may well retest the July low of 1040.
5-day outlook — neutral-bullish SPX 1240-1250
30-day outlook — bearish SPX 1180-1220
90-day outlook — bearish SPX 1040-1130
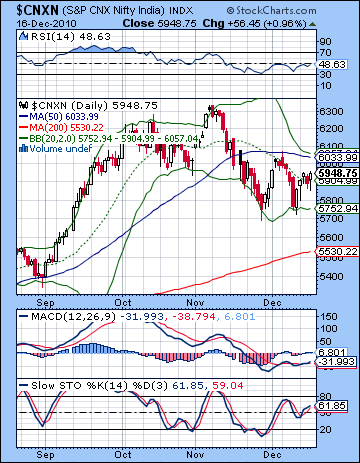 Stocks in Mumbai moved higher last week as investors cheered the RBI’s decision to hold interest rates steady. The Sensex rose by almost 2% to close at 19,864 while the Nifty finished the week at 5948. This bullish result was unexpected, however, as I thought we would see more downside on the early week Mercury-Mars conjunction with Pluto. I had been unsure about Monday and allowed for the possibility of an up day and that is what we got. More surprisingly, the bulls extended the buying into Tuesday. This effectively put off the selloff until Wednesday. While I had noted some definite upside potential on the Sun-Jupiter aspect, I thought this would be confined to the midweek period. As it happened, Wednesday was lower from the possible residual Mercury-Mars influence while the Sun-Jupiter aspect produced the biggest gain of the week on Thursday. Although disappointing, this result was not wildly divergent from my general expectation that we would see the Nifty trade in a range between significant support and resistance, at least until the last week of December or the first week of January. As I’ve noted previously, the market appears to be caught between the offsetting influences of the bullish Jupiter-Uranus conjunction and the bearish Rahu-Pluto conjunction. These two patterns encapsulate the two opposing views of the market. The bulls assume that the Fed’s liquidity and the resulting hot money will be enough to drive prices higher in keeping with Jupiter’s optimism and Uranus’ desire for risk. This view assumes that the various stimulus measures will work as designed and the global economy can recover. In keeping with Rahu’s penchant for creating uncertainty, the bears are becoming wary of inflationary pressures as central banks consider higher rates. Higher rates are bad news in a high debt environment as many countries simply will not be able to afford to service their debts. Higher interest rates will also choke off growth and make stocks less attractive, thus pushing prices lower. But now that we have passed the quadruple conjunction of Mercury, Mars, Rahu, and Pluto, does that mean that markets can rise until the exact Jupiter-Uranus conjunction on 4 January? While this is a bullish pairing, it is possible that we may not see as much upside as we saw in the previous conjunction in September. That’s because this will be the final conjunction in the series with the next one scheduled for 2024. In addition, we are about to enter an eclipse period. This week will feature a lunar eclipse on Tuesday 21 Dec with a solar eclipse due on 4 Jan — the very same day as the Jupiter-Uranus conjunction! Eclipses are often — but not always — correlated with periods of market instability and declines. With the upcoming eclipse period coinciding with the tail end of the Jupiter-Uranus conjunction, there is a greater chance of some significant shift in sentiment, not just in India but around the world.
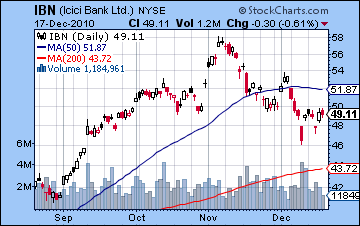
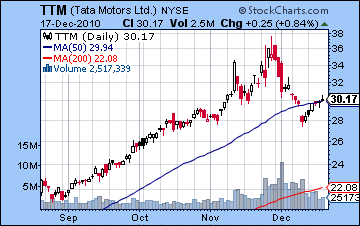
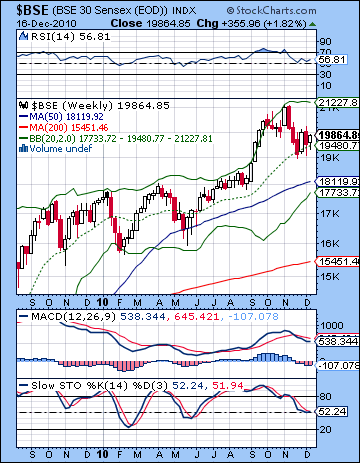 Despite last week’s gains, stocks still look quite shaky here as no major resistance levels have been breached to the upside. While the Nifty did close above the 20 DMA, Thursday’s rally more or less ended exactly on the falling trend line from the 8 November and 6 December tops. This should be considered a sort of bare minimum level of resistance above which bulls have to attempt to reach before trying for the arguably more significant level of the 50 DMA at 6033. This latter level is also roughly equivalent to the upper Bollinger band line so it assumes a greater importance in terms of highlighting a more promising bull trend. The technical indicators offer a somewhat more positive picture of the market, if only because they have been depressed for some time. Daily MACD has begun a bullish crossover and since it is below the zero line, it does look somewhat bullish. The fact that it recently displayed a positive divergence is further reason to expect that more upside is possible in the near term. RSI (48) also appears to be recovering here although it has yet to break above its previous peak from 6 Dec. If and when it does, it will present more bullish indications for the market’s short term prospects. So if resistance lies around 6030-6050, then support is likely around 5700-5750 near the bottom Bollinger band. This also coincides with the previous lows so there should be some effort to buy at those levels in the event of a decline. If the Nifty should fall below that level, it would be very bearish indeed and would set up a retest of the 200 DMA at 5530. The weekly Sensex chart is still mildly bearish here as price has bounced off support at the 20 WMA, but MACD remains in a bearish crossover. A weekly close above 20K would be more bullish as it would eclipse the early December high. In the medium term, a more critical level of support may well be around the 50 WMA and lower Bollinger band at 18,000. A weekly close below 18K would seriously jeopardize the current rally and would likely force a retest of previous lows at 16,000. As noted last week, ICICI Bank (IBN) is in a bearish head and shoulders pattern that points to lower prices in the medium term. I had wondered if price would rise to kiss the neckline and then decline more sharply towards the downside target of $42. Last week saw IBN struggle back to $50 but it did not manage to close above it. This would seem to add to the probability of the H&S playing out as expected in the coming weeks. If, however, it closes above $50-51, then the prospects for a H&S will be greatly diminished. Tata Motors (TTM) has risen into the 50 DMA but has so far not been able to surpass it. While there is a possible gap fill higher at $31, it is unclear if it can close above the 20 DMA which is now falling and is in danger of a bearish crossover with the 50 DMA.
 This week looks fairly bullish, at least to start. Monday’s Sun-Mercury conjunction could correspond with renewed enthusiasm that it often found in rising markets. Then Mercury continues its backward journey to aspect Uranus and Jupiter for Tuesday and Wednesday. There is also a bullish bias with these combinations. I would say that Tuesday is perhaps the best day of the three, with Monday somewhat less reliably bullish (but still bullish), and then Wednesday. Wednesday could conceivably begin positively but then have the gains dissolve by the close as the Moon is aspected by Saturn in the afternoon. The end of the week looks less positive, however, as Venus will be in aspect with Saturn on Thursday and Friday. Friday has the added burden of a Sun-Rahu conjunction so that would seem to tip the scales towards the bears for the last two days of the week. That said, I don’t expect any major declines here, despite Tuesday’s lunar eclipse. Certainly, the eclipse this week is a destabilizing influence that increases the chances for a major change in the sentiment. My guess is it won’t get going until next week and the Mars-Saturn square. So a bullish scenario would see a rise into Wednesday to 6050 or higher on the Nifty, followed by some gentle profit taking at the end of the week to 5950-6000. A more bearish scenario might see a lower Monday (yes, it’s possible but not likely) followed by a rise Tuesday to 6000-6050 and then mostly lower to Friday and 5850-5900. I would lean towards the bullish scenario here since I think the upside is more reliable here. Nonetheless, the time seems to be running out on this bullish Jupiter-Uranus conjunction.
 Next week (Dec 27-31) looks much more bearish as Mars is in square aspect with Saturn on Wednesday the 29th. I would expect the week to begin bearishly however, so Monday may well see prices move lower on the Sun-Pluto conjunction. A rise Tuesday is possible on the Mercury-Venus aspect but the tone should be quite bearish for the balance of the week. We have had a bearish Hindenburg Omen in US markets and investors may have itchy fingers on the sell buttons. A decline of 5% is very possible here and I would not rule out something approaching 10% through the week. So it is possible we could get a retest of support at Nifty 5700 here. The following week (Jan 3-7) is also likely bearish as the Jupiter-Uranus conjunction culminates simultaneously as the solar eclipse on 4 January. While a gain is possible on Monday and even Tuesday, the rest of the week looks more bearish. After that January looks quite mixed with rally attempts possible into the middle the month. While I don’t expect these rallies to climb too high, they may nonetheless support the market until the Saturn retrograde station on 26 January. At this point, it looks like we will get another move towards the downside at that time that continues into February and possibly March. This is the likely time where we will get a retest of the 200 DMA at 5530 and possibly lower. After a bottom is put in, Q2 should be more bullish with another move lower due in August and September.
5-day outlook — neutral bullish NIFTY 5950-6050
30-day outlook — bearish NIFTY 5700-5900
90-day outlook — bearish NIFTY 5400-5700
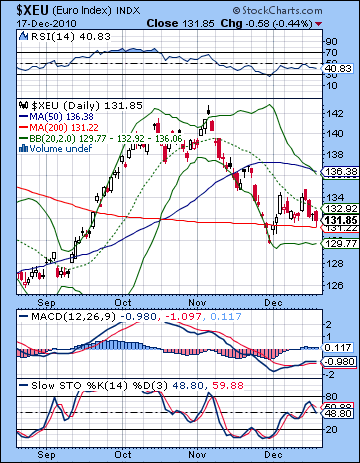 The Dollar gained ground this week as investors were less than impressed with plans for the beefed up European bailout fund. The Eurodollar finished at 1.318 while the USDX climbed to 80.3 and the Rupee slipped to 45.42. I had expected some late week declines for the Euro in the aftermath of the Sun-Jupiter aspect and those arrived, although the selling began somewhat earlier than expected. The early week gains on Tuesday and then sentiment reversed ahead of the Jupiter influence. So the Dollar still appears to be fairly strong here, despite being unable to climb to its 200 DMA at 81.7. It remains ensconced between the 50 and 200 DMA while both the 20 and 50 DMA are still rising. The weekly chart is arguably more bullish as this week’s candle was an inverted hammer that tested the 200 WMA but closed above it. It is still close to resistance from the 50 WMA, however, so it will have to close above it at 81.2 and then leapfrog over its 200 DMA at 81.7 before it can make a concerted run higher. Weekly MACD is still showing a nascent bullish crossover below the zero line. This is a nice setup that inclines towards more upside. Price has bounced off the bottom Bollinger band and has made it all the way to the 20 WMA. Can it cover the second half of the journey to the top Bollinger band at 84? Quite possible but clearly it is at a strong resistance level now. Stochastics (59) are climbing and still have more upside before it can be considered overbought.
This week could see more gentle upward movement for the Dollar but a significant breakout seems unlikely just yet. The early week looks mixed but with a bearish tilt. The Mercury-Jupiter aspect on Tuesday looks like it will push up the Euro. Monday could be more positive for the Dollar, although that is less certain. We might see more consistent strength towards the end of the week. Overall, we may not end far from current levels. Next week looks decidedly better for the Dollar as there are some important afflictions in the Euro natal chart. This is the time when we might see those resistance levels challenged at 81 and above. The Dollar rally is likely to continue until perhaps Jan 6 or 7 as Mercury aspects Mars. 81.7 would be a reasonable minimal target although it could climb higher. January is harder to call as it may be quite mixed. I don’t expect a lot more upside although I certainly would not rule it out. The astrological indicators, however, do not look particularly favorable. The Dollar chart looks increasingly vulnerable with time as another major decline is likely in February. Just where the top may occur is harder to discern, although it seems mostly likely to occur in January. I am fairly bearish on the Dollar for 2011.
Dollar
5-day outlook — neutral-bullish
30-day outlook — bullish
90-day outlook — neutral
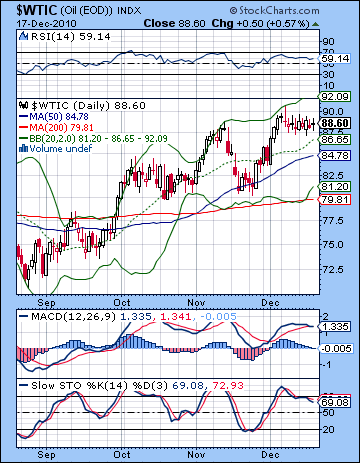 Crude oil edged higher last week as demand prospects continued to improve. After a week trading in a fairly tight range, it closed above $88. I had thought the down side would be enough to overwhelm the positive energy of Wednesday’s Sun-Jupiter aspect. As predicted, Wednesday was the most positive day of the week but the end of the week was not as bearish as expected. We’ve seen crude rally substantially over the past few weeks and this has been in keeping with the positive Jupiter influence in the Crude Futures chart. But this is now likely past its peak of bullish influence so there is less energy available for further significant upside. The technical picture seems more ambivalent also as price has bounced off the upper Bollinger band but has yet to meet up with the 20 DMA. One would think there is a fairly high likelihood of a retracement at least back to the 20 DMA if not the 50 DMA at $85. Moreover, MACD is in the process of rolling over so that further increases the likelihood of lower prices in the near term. RSI (59) is drifting lower and its negative divergences with respect to previous highs are still in effect. Stochastics (69) have fallen out of the overbought area and may be headed lower. Resistance is likely around the top upper channel at $92 while support from that channel is around $84, just below the 50 DMA. While a correction back to that level should be considered probable over the next two weeks, a breakdown of that rising channel would open the possibility for a deeper correction to the $80 level and the 200 DMA.
This week seems mixed at best with some difficult indications on the Futures chart, especially on Monday. Since these bearish indications are not confirmed by the transits, we should be cautious about anticipating much downside. Tuesday and Wednesday would appear to be more positive on the Mercury-Jupiter transit. From Wednesday into Thursday there would appear to be a more negative tone to the market on the Venus-Saturn aspect. If Monday does turn out to be a down day, then the week could well finish lower. If Monday turns positive, then we are more likely to have a flat or slightly positive week. However, next week’s market does look more negative, so perhaps it makes sense to have a default bearish stance here. I would not be surprised to see a quick 5% decline during this last week of 2010 so that could well test support at $80-82. Crude will likely stay weak until the first week of January at least. We could see a small rally attempt through mid-January, but then sentiment may turn negative again by the end of the month.
5-day outlook — neutral
30-day outlook — bearish
90-day outlook — bearish-neutral
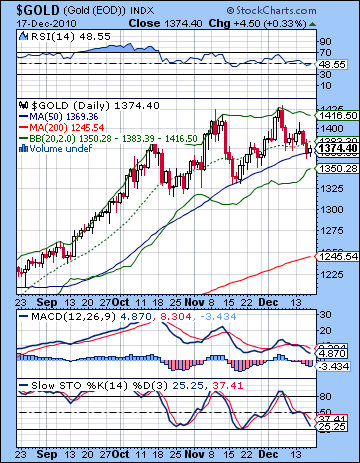 Gold slipped lower last week as the Dollar regained its footing amidst ongoing Euro debt troubles. After climbing to $1410 early in the week, gold futures ended Friday at $1374 on the continuous contract. I had been tentatively bullish on gold last week so its decline was a little surprising, but not much. The Sun-Jupiter aspect arrived ahead of schedule unfortunately as we got the significant rise on Monday and Tuesday instead of Wednesday. The selling later in the week was the result of the approaching Mercury-Rahu aspect. It seems that gold has fallen on some hard times, relatively speaking, as it has fallen to its 50 DMA. This is an important support level since it roughly corresponds to the rising trendline of the summer lows. Daily MACD looks quite sickly here with the bearish crossover and negative divergence in evidence from the previous low. RSI (48) looks somewhat healthier, however, as we do not have a negative divergence (yet) with respect to the previous low. Stochastics (25) have come down a long way but could conceivably be on the verge of reversing higher as it has done on previous corrections. The potential simultaneity of the Stochastics hitting the 20 line and price hitting support from the 50 DMA makes a reasonable case for a rebound in the near term. From a medium and long term perspective, however, the outlook for gold is more mixed. While it has benefited from Europe’s ongoing woes, the failure of the Fed’s QE2 to keep down interest rates has increased the likelihood of higher bond yields in 2011. Higher yields makes for a more competitive asset environment for gold. If yields continue to climb, more investors may be tempted to take profits and shift their money out of gold and into treasuries and bonds.
This week may see gold attempt another rally, most likely in the early part of the week. Tuesday’s Mercury-Jupiter aspect would appear to be a bullish influence around which the rally attempt will form. I would expect a net positive outcome over Monday and Tuesday with two up days not out of the question either. $1400 is quite possible. But the late week Venus-Saturn aspect and the Sun-Rahu conjunction look more hostile for further rises so gold will likely weaken then. We could finish a little higher than current levels but not by much. And another losing week is also possible. Next week looks much more troublesome for gold as Mars forms a square aspect with Saturn. This is likely to accelerate the down move and take out support at the 50 DMA if it hasn’t been taken out already. Look for a bottom in gold around Jan 7th or 10th. A test of the previous low of $1320 is quite possible and I would not be surprised to see it fall further than that. January looks quite mixed here, and further downside is still possible, especially later in the month after Saturn turns retrograde. We may well have seen the top in gold for a while.
5-day outlook — neutral
30-day outlook — bearish
90-day outlook — bearish

