

Summary for week of December 5 – 9
Summary for week of December 5 – 9
- Stocks prone to pullback early but gains likely later
- Euro weakness possible in first half of the week; EU summit occurs day before destabilizing lunar eclipse
- Crude could pullback early but strength could return later as Jupiter-Uranus aspect could lift commodities
- Gold may weaken early but gains probable by Friday
Stocks surged last week as central banks flooded the Eurozone with cheap US dollars in an effort to revive lending in the banking sector. The jaw-dropping rally saw the Dow rise more than 7% closing at 12,019 while the S&P 500 finished at 1244. While I acknowledged the real possibility of some upside in the first half of the week, I underestimated the extent of the move. Worse still, I can now see where I went wrong. I’ve been talking about the growing influence of bearish Saturn on Jupiter but I did not pay enough attention to bullish Uranus. I had noted that the presence of Uranus in the larger alignment and how this was a complicating factor in reading market direction for the next two months. Rallies were therefore a possibility here since the Jupiter-Uranus aspect is bullish and the aspect is very close now. I was uncertain when some of these transitory bullish effects would manifest. Last week we got a taste of this bullish pairing and it greatly moderated the bearish effects of the late week Mars-Sun aspect as we finished mostly flat.
While last week was a disappointment, it was not a deal breaker in terms of changing my medium term outlook for the market. I remain in a cautiously bearish stance here although I recognize that the bearish patterns are nowhere near as clear as I would like. Saturn’s influence is likely to take a significant toll on stocks sometime between now and February but just when is less clear. That broadly bearish view hasn’t changed. But last week’s massive rally was evidence of Jupiter’s (6 Aries) resurgence as it formed a tight 30 degree angle with Uranus (6 Pisces). Saturn is still more than four degrees away from its aspect (2 Libra), so it perhaps more logical that we should see more upside. This Jupiter-Uranus aspect is clearly a force to be reckoned with in the short term as it will remain in tight aspect until January. What this means is that the market may be more prone to large swings in both directions for the duration of this aspect. And I would also not rule out further gains, nor even the dreaded Santa Claus rally. At bottom, the alignment of Jupiter-Saturn-Uranus looks unstable, especially as we are on the verge of a lunar eclipse on December 10 — just one day after the critical EU summit. This alignment therefore increases the likelihood of large moves. Saturn’s influence is likely to grow as we move closer to January and increases the probability of a significant down move which may test the previous low at 1074. I don’t think a huge rally to 1400 by year end is probable, but it also wouldn’t shock me either. That is because Jupiter and Uranus may be able to forestall the Saturn influence long enough to allow the rally to push higher. I can’t quite see this happening, but it is a tricky alignment to interpret because all three planets are moving so slowly. It is also worth noting that a similar alignment of Jupiter, Saturn and Uranus in mid-2010 coincided with a major 20% correction. History may not repeat itself exactly this time around, but it may well rhyme.
 While the rally was by all accounts impressive, it is has stopped at some important resistance — right at the falling trend line from the July and October high. We may also note that Friday’s intraday high came to within just four points of the 200 DMA at 1264. Clearly, this level of 1250-1270 is important resistance which is be difficult to break for the bulls. If we do close above the 200 DMA, the next level of resistance would be 1300-1310 which would be the falling trend line from the May high. With Jupiter so close to Uranus, we cannot rule out a short thrust higher, especially with the world’s central bankers working overtime to engineer some solution to the European crisis. While it is possible we could see some meteoric rise on the latest Euro-solution, it seems unlikely that it could add such gains so soon after last week’s shock rally. Bulls can point to the bullish MACD crossover and the rising RSI at 55. Price may have rejected the 200 DMA but we did close above the 50 DMA. Bears appear to have a somewhat more compelling case in the short term, however, as the SPX is up against resistance and thus it may be more ripe for consolidation or a pullback. Stochastic is now overbought at the 80 line and may also be somewhat more prone to selling. Friday’s gravestone doji candlestick also somewhat increases the likelihood of a reversal lower, although that remains to be confirmed. In the event we do see a pullback, we could fill the gap at 1220 (not visible on SPX, but it appears in ETF charts). This also coincides with the 50 DMA. A break below the 50 DMA could invite a retest of the previous low at 1158. A move below 1158 would be quite bearish because it would open up the possibility of lower lows. After the lower highs (1260<1291), lower lows would persuade many weak bulls into selling.
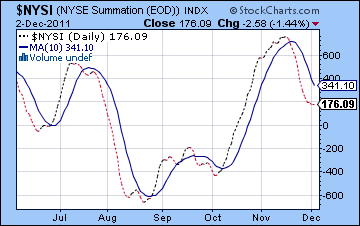
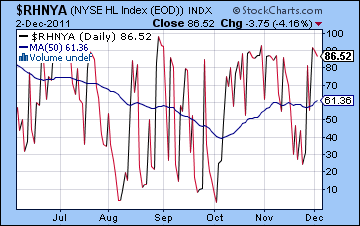
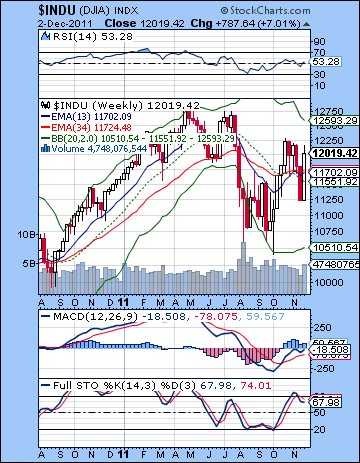 Breadth indicators suggest we may be overbought in the short term so a pullback of some kind is more likely. The High-Low index ($RHNYA) is pushing 90 and is usually a sign that a correction is imminent. The 60-minute chart (not shown) is also looking quite toppy as MACD is on the verge of a bearish crossover. Despite the huge rally, the NYSE Summation Index is still showing a sell signal as it remains below its 10 EMA. While this is a somewhat lagging indicator, it nonetheless is a useful tool to indicate broad market direction. The Dow weekly chart is still showing a sell signal on the bearish crossover of the 13 and 34 EMA. The gap is very narrow here so a breakout to the upside above resistance would likely generate a buy signal on this indicator. Last week printed a bullish engulfing candle which also improves the medium term technical picture somewhat. But I would still defer to the trend line resistance here so until we break above the October high, we should be skeptical about the staying power of any rallies. RSI shows a series of declining peaks dating back to early 2011 and may suggest an uphill climb. A move back up to the 60 level would negate this bearish pattern and might give more credence to a bullish breakout. MACD is still in a bullish crossover, however, although it has yet to cross above the zero line. Even more bearishly, stochastics is still showing a sell signal after being recently overbought above the 80 level. This is a result of the comparatively smaller rebound rally after November’s larger decline. A bullish crossover in stochastics would be an indication that the market may really be turning bullish in the medium term.
All eyes are on Europe this week as the EU Summit concludes on Friday. A significant solution would be quite positive although one wonders how much the market might have already discounted it. German PM Angela Merkel has already categorically ruled out the possibility of ECB-backed Eurobonds that the market is hoping for. While some lesser agreement could conceivably calm the waters, it is unclear how effective it could be. German government bonds actually rose in value last week alongside of equities, suggesting that bonds are now a risky asset. This means that the Fed’s efforts to jump start Eurozone lending has not changed the fundamental problem in Europe. For their part, the planets do not paint a clear picture here. Saturday’s lunar eclipse would tend to put a huge asterisk beside any EU agreement as eclipses are often unsettling influences. Amazingly, Uranus stations and returns to direct motion on the same day. This is likely to further undermine the status quo. Even if an agreement is made, it would be less durable. Jupiter and Uranus will still be in very close aspect so that will remain reservoir of potential bullish energy. But the short term aspects are more mixed. The possibility of an early week pullback is more likely given Monday’s Venus-Mars aspect and Tuesday’s Sun-Rahu conjunction. I would think 1220 is quite possible here, although the Jupiter-Uranus influence here could end up mitigating the downside again as it did last week. That will be an important "tell" about Jupiter’s influence. The late week looks somewhat more bullish, however. I would therefore expect a rebound after an early pullback. I an uncertain how strong a rebound might be. If the S&P cannot make a higher high, then it would be quite bearish and prompt more selling next week. Since I am expecting more selling next week, a lower high would be a plausible technical impetus for such a down move.
 Next week (Dec 12 – 16) is likely to be more bearish. Yes, bullish Jupiter-Uranus will still be in tight aspect but the Mars-Rahu aspect in the immediate aftermath of the eclipse looks more dangerous. The eclipse may also be strong enough to shift that underlying Jupiter-Uranus energy into something less bullish. Gains are perhaps more likely late in the week, especially on Friday as both the Sun and Venus enter new signs. The planets therefore argue for another significant decline here, especially if we have made a lower high in the preceding week. It’s difficult to estimate the size of this move given that Jupiter may be trying to lift prices higher at the same time. It seems likely we will test 1200 at least, and we could end up retesting 1158. The following week (Dec 19 -23) is hard to call. The week before Christmas has a bullish bias historically. Both Sun and Venus will form an alignment with the Jupiter-Saturn-Uranus pattern into a huge super-alignment of 5 planets. This could either push stocks down sharply or prompt a huge rally. It is a wild card. Perhaps there is a somewhat greater chance for a declines on Monday and Tuesday when Saturn is more influential. This would mean gains would come in the second half of the week. But that is very much a guess. This may be one of those times when the market is volatile and moving sharply in both directions, especially if it has come after a major downdraft. Jupiter’s direct station occurs on December 26 and is a bullish influence. This is the time when Jupiter ends its retrograde cycle and returns to forward motion. The market could rally into early January but I am skeptical about how far it can rise. If I am correct (a big if!) and we get another corrective move before Christmas, it seems unlikely that the rebound will take out resistance at 1292 or even 1260 for that matter. January looks more bearish as Saturn (5 Libra) moves closest to its aspect to Jupiter (7 Aries) and Uranus (7 Pisces). It is also within range of Neptune (5 Aquarius). Rahu will also lend a hand to the bears in mid-January so that could weigh heavily on stocks. And if that weren’t enough, Mars turns retrograde on January 23. So there is ample fuel for both bulls and bears here. I cannot rule out a rally move in December, but Saturn’s presence in this alignment suggests it won’t be solid and won’t last long. More likely is the bearish scenario that sees a retest of the October low. February and March look more reliably bullish to my eye as Jupiter prepares to make another aspect with Pluto. The last Jupiter-Pluto aspect coincided closely with the October high and this one will occur March 13. I am unsure if it will be a higher high. That will depend on what kind of correction that preceding Jupiter-Saturn alignment produces.
5-day outlook — bearish SPX 1220-1240
30-day outlook — bearish SPX 1150-1200
90-day outlook — neutral SPX 1150-1250
 Stocks surged last week as the crippled European banking sector was given a boost from a coordinated central bank intervention. The Sensex rose 7% closing at 16,846 while the Nifty finished at 5050. This result was very unexpected although in hindsight I can see where I made my mistake. While I noted the probability of some early week upside on the Mercury-Jupiter-Uranus alignment, I thought we would get more late week downside on the Mars-Sun aspect. This pullback never arrived however, as the bullish Jupiter-Uranus pairing overwhelmed all short term aspects and boosted sentiment. I have previously noted that the Jupiter-Uranus component of the current planetary picture had bullish potential and made specific forecasting for this December-January period more complex. My mistake was that I did not expect it could manifest so soon or so strongly. This bullish pairing is moving very slowly here (very powerful) and will remain in close aspect until January. This does not necessarily mean that we will rally into January, however. Eventually, I expect more bearishness to manifest as Saturn moves closer to its opposition with Jupiter. This aspect is closest and hence offers more bearish potential in early January.
Since Jupiter will likely be strongest near its direct station on 26 December, I thought it more likely that rallies would occur closer to that date. As it turns out, risk-taking Uranus may have brought the bullishness forward since it is due to reverse its direction and return to forward motion very soon — on December 10. Since bullish Uranus is closer to its aspect to Jupiter than bearish Saturn, stocks rallied on a significant injection of fresh liquidity from the Fed and other central banks. This sets the stage for the critical EU summit due this Friday 9 December where markets hope for a lasting solution to the ongoing Eurozone crisis. On one hand, the Jupiter-Uranus aspect is quite positive and may support further inflationary bailout schemes that would be bullish for equities. I therefore cannot categorically rule out more upside in the near term here. But the close proximity of Saturn to both of these bullish planets is the main reason for my larger bearish bias. Yes, the aspect between Jupiter (6 Aries) and Uranus (6 Pisces) is very tight and powerful. We could therefore see another bailout cobbled together. But German PM Angela Merkel has definitively said that there will be not ECB-backed Eurobonds that so many market participants are hoping for. She is holding the line on the German position to enforce fiscal discipline on the Eurozone members. In that sense, she is speaking through the influence of Saturn which demands solutions through control and austerity. Saturn (2 Aries) is gradually moving closer to its aspect with Jupiter and Uranus here so I would expect this debate between austerity (Saturn) and printing (Jupiter) to continue. Saturn’s presence here is therefore good reason to be cautious about stocks at least until January. When left alone, Jupiter-Uranus aspects encourage rallies as the 2009-2010 rebound rally coincided with an unusually lengthy aspect between these bullish planets. But it is worth remembering that the mid-2010 correction occurred when Saturn moved into alignment with Jupiter and Uranus. Saturn, therefore, may have enough bearish influence to reverse the equation here once again. History may not exactly repeat itself, but it may well rhyme.
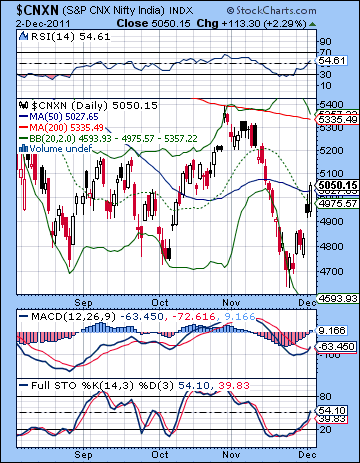
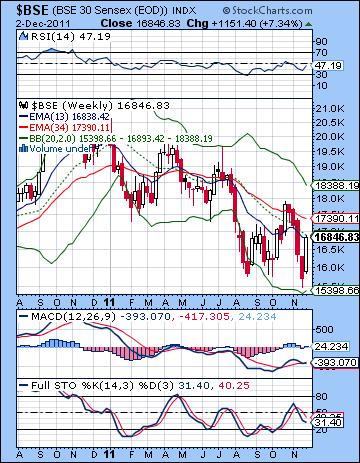 The technical picture improved last week as the Nifty closed above its 20 and 50 DMA. Even more importantly, MACD saw a bullish crossover. This is a useful swing trade indicator that while not infallible does provide some evidence for further gains. RSI (54) crossed the 50 line and may be taking another run at the 70 level after its recent oversold status. As a shorter term indicator, stochastics still has further to rise before becoming overbought. Bulls will try to keep the Nifty above the 20 and 50 DMA or else run the risk of price consolidation back towards support at 4700 once again. The 20 DMA is a convenient halfway point in the Bollinger band that divides weak rallies from strong ones that go all the way to the upper Bollinger band, now at 5357. Interestingly, the upper Bollinger band coincides with the 200 DMA here and would make a very formidable resistance level in the event the rally were to thrust higher.
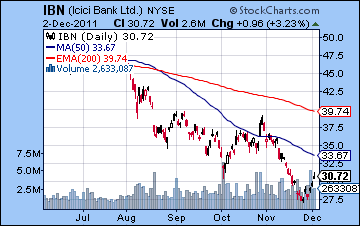
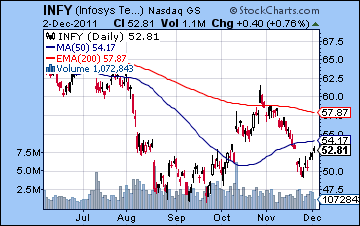
I wouldn’t rule out such a run higher given the Jupiter-Uranus aspect, but it is seems less likely at this point. We can also note that the close at 5050 was very near a 50% retracement level from the previous top. There is quite a bit of overhead supply in the 5100 area so it will be difficult for the Nifty to move higher at this point. If the bears successfully defend this level, then there could be a quick retest of support at 4700. While this support has held well in recent weeks, there are no guarantees that it will hold again. A breakdown is somewhat more likely if the Nifty reverses early next week from the 50 DMA. That’s because it will have reversed at a lower level following a test than it has previously. If 4700 cannot hold, then 4500 would arrive soon. Below that, of course, is the crucial 4000 support level. We still have a shot at that by the end of the year, although I have to admit it is not looking likely. More realistically, it will require more time. January-February is possible or perhaps later in 2012. The weekly BSE chart improved somewhat but despite the big rally really doesn’t suggest a bullish turn here. The bulls can rightly claim the bullish crossover on the MACD, which is reinforced by the fact that MACD is rising and forms a positive divergence with previous lows. But our other two indicators are less bullish. RSI is climbing after being oversold but we can still see a series of falling peaks. It would suggest a more bullish interpretation if it climbed above the previous peak of 52-54. Stochastics are a more responsive indicator and the weekly chart is still caught in a bearish crossover and falling. If the rally is going to go anywhere, stochastics needs a bullish crossover. The 13 week EMA is still well below the 34 week EMA, another sign that stocks are locked in a bear market. The perilousness of the overall market is reflected in the chart of ICICI Bank (IBN). The financial sector lagged last week as gains were quite modest. Friday’s high merely reached the early October low and may provide the impetus for more selling as trapped bulls head for the exits. Infosys (INFY) has filled the gap at $52, but it may be prone to selling as it approaches its 50 DMA.
 This week looks more mixed as the short term aspects suggest some downside is more likely in the first half of the week. Monday’s Venus-Mars aspect and Tuesday’s Sun-Rahu conjunction are both negative influences that contain some bearish potential. Tuesday’s holiday closing may mitigate or shift some of that bearish energy. That said, the underlying bullish influence from the slow moving Jupiter-Uranus aspect could moderate any declines here as it did last week. For this reason, I would keep an open mind about the size of any downside this week. And it is always possible that the approaching direct station of Uranus on Saturday could lift stocks once again. In this sense, the early week aspect will be an important test for the strength of Jupiter and Uranus going forward. If we get a net positive result across both those days, then it would suggest that we are going higher in the short term. I still don’t think this is likely, however. There is a somewhat greater chance of gains in the second half of the week as the Sun approaches its aspect to Venus. Gains would be that much more likely if we have see some profit taking earlier in the week. It is hard to say if we will see higher highs by Friday. I somehow doubt it, but I know I am biased towards the bear side here. If the early week pullback is modest, then higher highs to 5100 are more likely. I would not be surprised by this outcome. After all, Uranus is stationing on Saturday so that opens up the possibility for a lot of risk taking and buying of risky assets. But perhaps the most important day this week is after markets have closed. Saturday’s lunar eclipse coincides with the Uranus station almost exactly. This is a very unstable combination that increases the likelihood of sudden developments and changes in direction. This would tend to undermine the outcome of the EU summit on the day before.
 Next week (Dec 12 – 16) could be more bearish. This is partially due to the post-eclipse instability as well as some short-term aspects. The main culprit is the Mars-Rahu aspect in the early week. This is quite a nasty aspect that could well coincide with a sharp decline. This decline could easily span over two or perhaps even three days. There is a chance that the Nifty could retest support at 4700 at this time. The late week may be somewhat better, with perhaps Friday standing out as more bullish as both Venus and the Sun enter new signs. The following week (Dec 19-23) may also start negatively although this is somewhat less certain. Tuesday in particular could be bearish as the Moon conjoins Saturn and highlights the approaching opposition. But the late week alignment with the Sun and Venus is harder to call. It suggests a big move higher, although the presence of Saturn in the mix makes that a little less reliable. The last week of December should be more bullish as Jupiter ends its retrograde cycle and returns to forward motion. January does not look positive as Saturn makes its closest approach to Jupiter. We could easily see lower lows made here and I would not rule out 4000 on the Nifty. Mars begins its retrograde cycle on 23 January so that may be an additional burden on sentiment at that time. A substantial rally is likely to begin after this sell-off, probably sometime in February. This will likely extend into March at least. Jupiter forms another aspect with Pluto on March 13 so the previous several weeks will likely coincide with rising stocks. Previous Jupiter-Pluto aspects were also bullish, most recently in October. The first half of 2012 tilts bullish while the second half should be quite bearish. Lower lows are quite possible by December 2012.
5-day outlook — bearish-neutral NIFTY 4900-5100
30-day outlook — bearish NIFTY 4500-4900
90-day outlook — bearish-neutral NIFTY 4500-5000
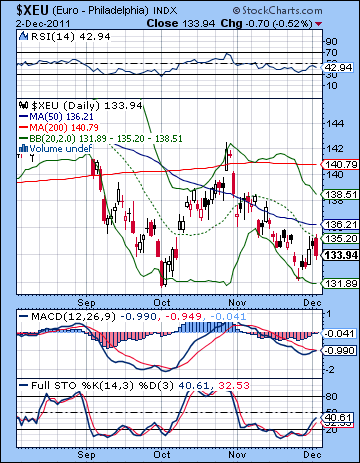 The Fed unleashed a veritable tsunami of cheap US dollars last week in an effort to unlock the increasingly fragile European credit markets. While the Euro bounced a little to 1.34, it still looks vulnerable here. The USDX slipped below 79 while the Rupee strengthened towards the 51 level. This rise was largely expected as I thought the midweek Mercury-Jupiter would lift the Euro. The late week decline also conformed to expectations as the Euro weakened on Friday’s Sun-Mars aspect. The Euro looks fairly mixed technically. On the bullish side, the approximate double bottom suggests more upside ahead. Last week’s MACD near-bullish crossover was also indicative of higher prices going forward. Stochastics has also turned higher and has lots of room to go higher before becoming overbought. But Friday’s reversal lower was quite negative, especially since it occurred right on the 20 DMA — the classic early warning signal where rallies go to die. Unless bulls can push it above this line, there could be a quick retest of the low at 1.32. We can see how the main moving averages now form a standard bearish arrangement with the 50 below the 200 and the 20 below the 50. All three are declining. It is possible we could see a further push to the 50 DMA and perhaps to the 50% retracement level of 1.37. But sellers may arrive fairly soon thereafter. Friday’s EU summit could create a new dynamic for the Euro. Expectations are not overly high, so some kind of compromise solution — however inadequate — would likely create a short term rise in the Euro. Failure to arrive at a new arrangement could be disastrous, however.
This week looks more bearish for the Euro. Monday’s Venus-Mars aspect and Tuesday’s Sun-Rahu conjunction could send the Euro lower. To be sure, the underlying bullishness of the Jupiter-Uranus aspect might prevent a serious decline here and is a bit of a wild card. But there is nonetheless a stronger astrological case for further declines. Since the Euro is already quite close to support at 1.32, it is quite possible this support will be tested. I think it is quite unlikely that the support will be broken, however. The late week has a better chance of recovery, however, as both the Sun and Venus form a close aspect. A higher high seems unlikely this week. Next week could be more bearish as the Mars-Rahu aspect is likely to increase anxiety and send investors to the safety of the Dollar. A new low is possible at this time. We could see a significant rebound in the Euro in the 2-3 days before the Christmas break, as well as the last week of December. January is shaping up to be middling at best, with the real possibility of more downside. Calling a date for a bottom is difficult here although it seems likely it will happen in January. February and March look more reliably bullish as Jupiter approaches its aspect with Pluto.
Euro
5-day outlook — bearish
30-day outlook — bearish
90-day outlook — bearish
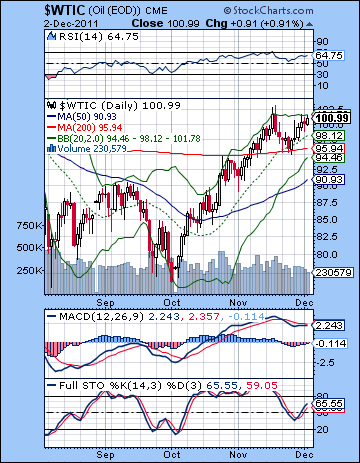 Crude rallied last week as the central bank action freed up liquidity for struggling Eurozone banks. Crude finished above $100, up 3% for the week. I thought there is a decent chance that crude could push back to $100 so that was not a surprise. The absence of any significant pullback late in the week was, however. Thursday’s decline coincided with the Sun-Mars aspect but Friday’s gain was more puzzling. No doubt aspect leakage from the background Jupiter-Uranus aspect. Crude may be forming a bearish double top as it has been unable to break above the previous highs at $103. It is running up against resistance at the upper Bollinger band so it may have to pullback again before moving higher. Stochastics on the daily chart is still in a bullish crossover and has more room to run before becoming overbought. This could embolden some bulls to hang on a little longer before selling. However, MACD more or less undercuts that piece of evidence as it remains in a bearish crossover. RSI (64) has come off its overbought level, and may return for a second test of the 70 line. In other words, the picture is equivocal. Support is still around the $95 level and the 200 DMA. There will likely be many buyers on any dip at $95. Failure to hold onto this level would be quite bearish though, and crude would become vulnerable to deeper declines.
This week crude looks somewhat more bearish although prices may be stay fairly lofty. The early week is the more likely time when we could see a pullback as the Venus-Mars aspect and Sun-Rahu conjunction are likely to make Monday and Tuesday less likely to produce gains. Given the strength of Jupiter’s current bullishness, it is unclear to me just how deep any pullback will be. It is possible it may be more modest. If the declines are larger (>2%) then that is a clue that a larger correction is imminent. The late week Sun-Venus aspect will increase the chances of a rebound higher so I would not expect too much change in crude this week. Perhaps it finishes between $95-100. Next week looks like more bearish, as the Mars-Rahu aspect in the early week could make prices volatile. Even here I would not rule out the possibility of further strength due to the complex nature of the planetary aspects. While I think there is a very good chance for a correction in the December-January period, I am uncertain when it will occur. It could easily begin this week and extend into Dec 12-16. And yet the planets are somewhat equivocal on that score. It is even possible that we could see a sharp rise in price in December. For this reason, I would not rule out further gains and an elevated price until after Christmas. January looks more reliably bearish as Saturn opposes Jupiter more closely and Mars turns retrograde. The bear move in crude may well continue into February.
5-day outlook — bearish-neutral
30-day outlook — bearish-neutral
90-day outlook — bearish
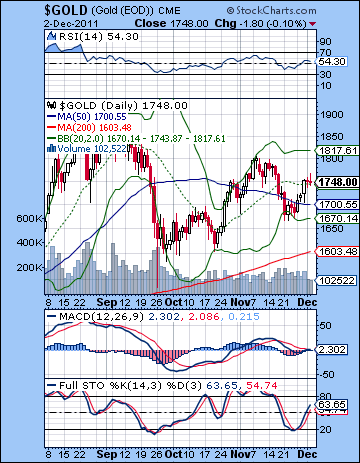 As the Fed did its best to expand the money supply and bail out European banks, gold rallied higher closing near $1750. While I thought we would see some early week upside, the extent of the move was surprising. Gold pulled back later in the week as expected, but the losses were minor. I clearly underestimated the effect of the Jupiter-Uranus aspect and its tendency to expand inflationary risk-taking activities that would support gold. While the rally was significant, gold has yet to match its previous top at $1800. As a result, we can see gold is in an enormous triangle pattern of falling highs and rising lows. This is neither a bullish nor a bearish pattern although breakouts can be swift. Gold is still above the 50 DMA at $1700 where it finds significant support. Gold stopped its advance very close to the 20 DMA here suggesting it may encounter more resistance if it tries to push higher. Support may be near $1670 and the lower Bollinger band, although if it fell that far, it would invalidate the triangle pattern and might generate more selling. $1700 therefore may be more important support in the short term. A break below $1700 could mean a deeper decline to a retest of the 200 DMA at $1600. Conversely, a new high above $1800 would be bullish and would spark a run towards the old high of $1900.
This week may be less positive for gold given the affliction to the Sun by Rahu on Monday and Tuesday. Of course, we saw an affliction to the Sun late last week that did not have much effect due to Jupiter’s resurgence. This will be an important test of the competing energies. I tend to think that gold may suffer more downside than it did last week, perhaps with 1% declines on either day. We should see an improvement in sentiment by Wednesday or Thursday, however. This may even produce modest gains on the week overall, although I would not call that a probable outcome. Next week could begin on a positive note, but the Mars-Rahu aspect has a greater potential for damage. I would therefore expect there is greater downside risk up to the Sun-Saturn aspect on Dec 19-20. I would not be surprised to see gold fall back to $1600 by that time. January offers some ambiguous signals, some bullish and some bearish that makes it difficult to call. While there is a good case to me made for a strengthening Dollar into late January, the astro indicators for gold’s corresponding weakness are less clear than I would like. I would therefore be only mildly bearish here. Overall, my expectation for gold in 2012 is quite mixed, with greater downside risks in the second half of the year. I believe that gold is vulnerable to significant corrections until early 2013.
5-day outlook — bearish-neutral
30-day outlook — bearish-neutral
90-day outlook — bearish