

- Early week declines in stocks likely followed by gains later in the week
- Dollar mixed with gains more likely early
- Crude prone to declines early; bearish bias
- Gold vulnerable to declines early; some recovery later
- Early week declines in stocks likely followed by gains later in the week
- Dollar mixed with gains more likely early
- Crude prone to declines early; bearish bias
- Gold vulnerable to declines early; some recovery later
Stocks bounced back with the vengeance last week as the European bond yields responded favorably to the latest EU bailout plans. After some tough sledding in the early part of the week, the Dow rose more than 3% to close at 11,382 while the S&P500 ended at 5992. While I had noted some positive influences last week, I underestimated their power to overshadow everything else and we ended up much higher than expected. Monday’s Mars-Jupiter square could have gone either way as it has been a fairly positive in the recent past although I thought it might not be quite as bullish this time around. The fallout from this extended into Tuesday before the Mercury-Venus aspect finally got some traction on Wednesday. And did it ever — prices jumped all the way into Friday. I had held out the possibility that Thursday could be higher but Friday’s gain was very surprising. The Mars-Uranus square had all the makings of a decline, especially with the approach of the Mercury-Rahu conjunction. While the rally lost momentum at the end of the week, the absence of a negative close was certainly puzzling. One possible explanation is that we are getting some early bullishness from the approach of the Jupiter-Uranus conjunction. This comes exact on January 3, 2011 and these two favorable planets are just a little over two degrees away from each other. I had expected most of the upside of this pairing to manifest a little later in the month but we may have got an early start as Jupiter is about to enter bullish Pisces. It actually makes this sign change over this weekend. So the anxiety that accompanied the Rahu-Pluto conjunction is being somewhat offset by the emergence of this bullish Jupiter-Uranus combination. In a sense, this reflects the two sides of the current financial situation. The Rahu-Pluto worries are a reflection of the market distortion from the actions of large organizations such as the Fed and the QE2 policy and possibly the latest debt scare and bailout in Europe. Where will all this easy money lead to? The bearish fear is that sovereign debt risk increases along with outstanding debt levels and rising yields will tend to reflect this risk. Inflation may also be fueled by these various bailout measures and that is another reason why yields are rising on bonds across the board. But many equity investors are feeling that it is folly to ‘fight the Fed’ and that Bernanke’s QE2 will support stock prices no matter what. That notion of increased risk appetite corresponds with the Jupiter-Uranus conjunction. Jupiter’s optimism and tendency toward expansion meshes nicely with the risk-loving quality of Uranus. September’s rally coincided with a previous iteration of this Jupiter-Uranus conjunction and we may well have more upside on this occasion. But we know that Bernanke and the Fed cannot tolerate endlessly rising yields on US treasuries. They have to stay low in order for the US government to continue to service its ever increasing debt. Last week the 10-year topped 3% for the first time since July. And this was against a backdrop where the Fed was heavily intervening in the market and buying billions in order to keep yields low! This is not a sustainable condition in the long term, and perhaps also in the medium term. If yields continue to rise, the Fed will have to step in and remove some liquidity from the system and this will scare equity investors back into treasuries, at least for a while. In the long run, even the Fed will no longer be able to control yields as the market will simply overwhelm its ability to shape market conditions. My assessment of the treasuries chart suggests we could see some more evidence of this as early as January.
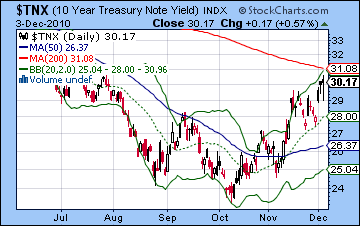
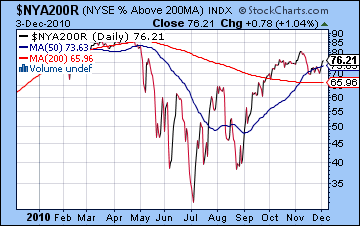
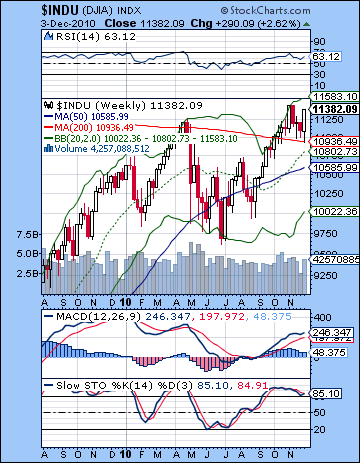 The bulls took over last week as support from the 50 DMA held firm on the early week retracement. Monday and Tuesday both saw some intraday trades just below this level (now at 1183) but closed above it on both days. The fact that prices rallied off that level is an indication that the rally has momentum to go higher. At the same time, Friday’s close was still just below the recent November high so that is an important level of resistance for the S&P to surmount. The major averages like the S&P appear to be in a rising wedge pattern off the summer lows with the upper end resolution occurring near 1300 in early 2011. That is not to say that price should reach that level at that time, but it is where the lines seem to culminate. Wedge resistance and support will be tested first and then ultimately break down lower. In December, the resistance level from this wedge is around 1250-1260, while support is between 1190 and 1200. Tuesday’s session touched this lower trendline support so we will have watch carefully for any retest in the days ahead. A violation on the downside could spell trouble for the rally, especially since the 50 DMA will be in close proximity. In the short term, the market looks overbought here suggesting a pullback to test that trendline may come before we test the upper trendline resistance at 1250. Stochastics (91) are back over the 80 line and while this does not mean that prices can’t rise further, it does make long positions more unappealing. RSI (62) has climbed back into bullish territory but we can see a very clear bearish divergence with respect to the previous high in early November. This suggests that current prices are not sustainable in the medium term and that price should come down. MACD has entered a bullish crossover but is locked in a gaping negative divergence. Friday’s close pushed the S&P close to the upper Bollinger band which suggested that further upside would be less likely than some kind of consolidation in the short term. The weekly Dow chart still shows price above the 200 WMA and this is good evidence for the bullish case since this had previously acted as resistance in prior corrections. What is less bullish is that prices are again approaching the top Bollinger band and are moving above the 20 WMA. This does not represent good value from a buyer’s perspective. Stochastics (85) are still in the overbought zone while RSI and MACD are similarly bullish but show signs of weakening. The chart of the 10-year treasury yield shows that yield has broken above the critical 3% level which was acting as resistance. Yields are now just a hair beneath their 200 DMA. It is possible that this is a false breakout and that the 200 DMA will offer some resistance as yields again move lower in the short term. A completion of the inverted head and shoulders pattern would suggest that yields may rise a bit further to 3.1-3.2 before possibly retracing lower. Higher yields will ultimately be bad for stocks as they will force Bernanke’s hand and squeeze liquidity out of the system. The number of the stocks above their 200-day moving average rose last week to 76. While this is quite bullish in an obvious sort of way, it is interesting that it is quite a bit lower than the 85% levels seen in April. This suggests a narrowing of market breadth and should be seen a potential negative divergence. The divergence is repeated with respect to the highs registered in early November.
 This week may see some pullback, especially at the beginning and end of the week. However, there are a plethora of factors in play here on both sides of the ledger. As noted above, Jupiter enters Pisces on Sunday and this normally bullish sign change effect could spill over into Monday’s session, although that is a somewhat less reliable bullish influence. Uranus, the planet of risk and change, ends its 5-month long retrograde cycle on Monday and resumes its normal forward motion. It turned retrograde just 3 days after the July 2 so its direction reversals are sometimes correlated with significant market reversals. Given its proximity to Jupiter here, a medium term rise into January is certainly possible as a result of this change in direction. However, the short term effects may be damaged somewhat by the close Mars aspect. Also, the Sun comes under the influence of Saturn on Monday and into Tuesday so that increases the likelihood that confidence may be in short supply. If Monday happens to be higher, then Tuesday will likely be lower. Nonetheless, I would expect Monday and Tuesday to be net negative. Wednesday and Thursday look somewhat more positive, however, as Venus aspects Pluto and approaches another aspect with Mercury. Mercury is actually slowing down here ahead of its retrograde station on Friday. Friday is harder to call. I had been fairly bearish about it in last week’s newsletter, but now I’m not so sure. Mars is dangerously close to Rahu that day which increases the chances of a decline, but Mercury is moving back towards a positive aspect with Venus. These two opposing energies may end up canceling each other out but it seems unlikely that the market could fall very far. And yet there is clearly some very unusual and powerful patterns in the sky here that have the potential to do some damage, albeit alongside some quite bullish influences. A bullish scenario would see a rise on Monday followed by a decline on Tuesday to about 1220 and then higher into Thursday and Friday to about 1240, which would be above to the previous November high. A more bearish scenario would see a deeper decline below 1200 into Tuesday (but still above the 50 DMA) and then back to 1200-1220 by Thursday and then lower again on Friday, perhaps to 1200. While I think there are some downside surprises in store for the market through this quadruple conjunction which lasts into next week, it’s unclear if they can occur this week. I would tend to think we will finish somewhere near current levels. It does seem that the chances for a larger correction to 1130 or below in December are fast disappearing. Even another retest of the 50 DMA at 1180 may only be a 50-50 proposition in the short term. So it is possible we could see the rising wedge staying intact for another few weeks here before the waterfall lower begins.
 Next week (Dec 13-17) begins with a bearish looking conjunction of retrograde Mercury, Mars and Pluto. This is likely to take prices lower, perhaps by a lot over Monday and into Tuesday. A reversal higher is possible by Tuesday’s close or Wednesday. The midweek period looks quite bullish on the Sun-Jupiter aspect. Thursday and Friday tilt bearish, however, as Mercury conjoins Rahu again. Overall, this week could well be lower which would be surprising to many observers who are expecting a Santa Claus rally. The following week (Dec 20-24) could begin favorably on the Mercury-Uranus-Jupiter aspect but sentiment could fade by the end of the week and the Venus-Saturn aspect. A dip after Christmas may be followed by another rally attempt in early January. January looks quite mixed but once Saturn turns retrograde on Jan 26, it will increase the likelihood of a more significant decline. The bulk of the decline will likely occur in February. Even if prices stayed within the rising wedge all the way to 1300, the decline in Q1 is likely to test support at 1130 at the very least. If we only manage to climb to 1230-1250, then the pullback will likely take us to commensurately lower levels. Q2 looks quite bullish with solid gains likely in May and June, and perhaps into July. This translates into a bottoming process in March and April. Another wave down is likely starting in the summer, probably in August and the Saturn-Ketu aspect. This is likely to be quite substantial and has the potential to erase the gains made in the preceding rally. It is difficult to say if it will be a lower low, but I would lean towards that outlook. It does suggest, however, that long positions may still be thought of as trading positions rather than buy-and-hold.
5-day outlook — neutral SPX 1210-1230
30-day outlook — neutral-bullish SPX 1200-1250
90-day outlook — bearish SPX 1050-1150
 Stocks rebounded strongly last week as recent scandals receded into the background and investors focused on solid fundamentals. The Sensex gained 4% to close at 19,966 while the Nifty finished the week at 5992. While I noted some positive influences last week and the probability of a technical bounce, I greatly underestimated the extent of the bullishness. Monday’s Mars-Jupiter aspect was an unknown quantity as I thought it could go either way. While it had been bullish on previous occasions, I was uncertain if it could deliver a gain in the current climate. As expected, the Mercury-Venus aspect on Tuesday and Wednesday did coincide quite well with significant gains as Wednesday’s session saw the Nifty gain almost 100 points. But the bulls retained control into Thursday and pushed prices even higher. I thought we would see some selling late in the week as Friday’s Mars-Uranus aspect was not a positive influence. This was a correct assumption, but the the decline was more modest than I had anticipated. As a result, the market moved significantly higher through the week. I was perhaps guilty of defaulting towards my medium term bearish bias here as I still think we haven’t seen the last of the Rahu-Pluto conjunction. This conjunction was correlated fairly closely with the correction that began in November (the top was made just two days before the exact conjunction), and I believe it will be activated again when Mercury and Mars join this malefic pairing in mid-December. What we may have seen last week was the first bullish evidence of the approaching Jupiter-Uranus conjunction. This conjunction is exact in 3 January 2011 and certainly promises to offer some support to prices over the coming weeks. Readers will recall that the September rally was given a kick start by this very same Jupiter-Uranus conjunction. This is not to say that history will repeat itself over the next four weeks and we will again rocket higher. But it does mean that there will be some bullish energy released over the coming weeks that could dent some of the negativity from the Rahu-Pluto conjunction. In this sense, the market is caught in between two largely opposing forces of pessimism and optimism. The bearish Rahu-Pluto conjunction reflects the anxiety from the fallout of the European debt crisis and the inflationary effects of the Fed’s QE2 program. The bullish Jupiter-Uranus conjunction, by contrast, represents greater risk appetite that derives in part from the QE2 stimulus program and the sense that risk has been effectively removed by the guarantee of the Fed’s cheap money. Both of these energies will therefore take their respective turns driving the market in different directions in the coming weeks as they are triggered by aspects from faster moving planets.
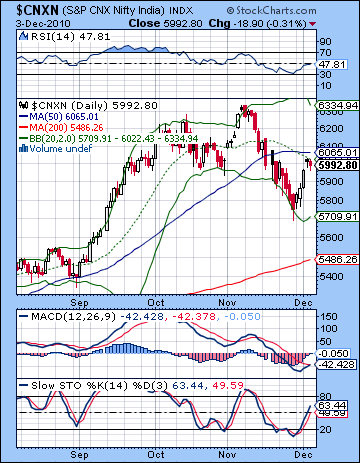
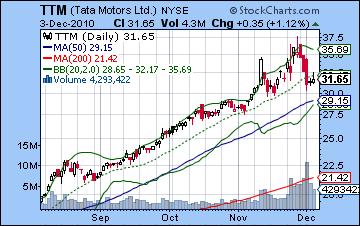
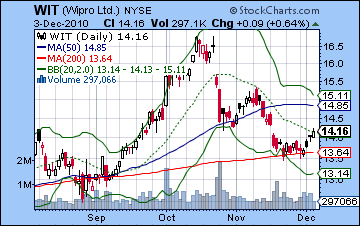
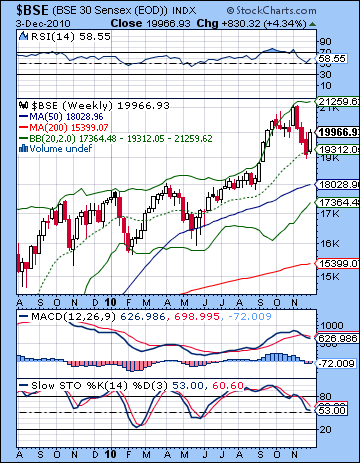 Bulls regained their footing last week although they have yet to break above significant resistance. The Nifty is still trading below its 50 DMA (6065) and this would seem to be formidable resistance. Friday’s close was also below the 20 DMA suggesting this is still in the category of a mere technical bounce. Moreover, the Nifty now stands very close to a 50% retracement from the November top to the November bottom. We can also note that we got a bearish crossover of the 20 and 50 DMA last week, despite the positive result on the week. MACD is turning higher and is on the verge of a bullish crossover. It is also below the zero line so that provides additional evidence that the next move may well be higher. RSI (47) has climbed back smartly to the break even line after its recent oversold level near the 30 line. Stochastics (63) have rebounded but may have some further way to go before reaching an oversold level. One would think that any close above the 50 DMA (6065) would increase the odds of a move to 6200 and a gap fill from 12 November. The weekly BSE chart also provides some technical evidence for bulls in the short term since last week’s move occurred after price touched the 20 WMA (middle Bollinger band). This is not to say that price won’t drop below that level, but it opens up the possibility that the market could move higher once again. Tata Motors (TTM) had a rough week as volume spiked on the early week down move. This is not a chart that looks very bullish here, even if the late week bounce continues for a short time. Wipro (WIT) fared somewhat better on improving fundamentals for outsourcers and is in the process of filling a gap just below 14.50. However, Friday’s close was just at the 20 DMA and it is still a ways to go before it tests resistance at the 50 DMA. So that is another bearish looking chart for the medium term. Overall, the technical picture looks cloudy here with further upside possible but not exactly probable. Nonetheless, if the Nifty can get back above 6065, then the bulls will have more credibility to their argument and it might encourage more buyers to jump in. From a technical perspective, we cannot rule out a higher high over the coming weeks. It will be interesting to see how high the Stochastics goes and whether it matches the level achieved in early November. If its lower, then a negative divergence will be formed and it increases the likelihood of a medium term move lower. The same is true for the RSI which needs to form a higher high above 68 in order to prevent a negative divergence from forming. That said, the Nifty now stands very close to resistance levels so there is an argument to be made for it to go lower from here and continue falling until it finds support. A close below the low of 26 November near 5700 would be very bearish indeed and would likely hasten a move to the 200 DMA at 5486.
 This week features a number of influence in both directions. Jupiter enters Pisces on Sunday so this could possibly extend its bullish influence into Monday’s session, although that seems less reliable. There are two other influences on Monday that warrants close watching. First, Uranus will end its 5-month retrograde cycle and resume normal forward motion. This is potentially important because Uranus ratchets up energy and often corresponds to sudden changes. Many global markets bottomed in early July when Uranus started its retrograde cycle so it definitely has the potential for significant shifts in the terrain. Also, the Sun will come under the cautious influence of Saturn on Monday and into Tuesday so that should tilt the tables in the favour of the bears. While I think a negative outcome is likely here in the early week, the Uranus factor opens the door for all eventualities and prices moves could be fairly large. Sentiment may improve by Wednesday, however, as Venus aspects Pluto and will slowly approach its aspect with benefic Mercury by Friday. I would not be surprised to see gains on both Wednesday and Thursday for this reason. Friday is harder to call because there are both bullish and bearish aspects in play. Mercury is in aspect with Venus but Mars will be fast approaching its conjunction with Rahu. Overall, we could end up higher or lower on the week. A bullish scenario would see only modest declines early in the week to perhaps 5900 and then a rise that tests or even exceeds 6050 and the 50 DMA by Friday. A more bearish unfolding would suggest a deeper decline to 5800 and a rebound to 5950 by Thursday with another down day on Friday. I would lean towards the bullish scenario here, although I admit I am quite uncertain about the eventual outcome. While I think we are likely to see some sizable down days from the upcoming quadruple Rahu-Pluto conjunction, the Jupiter-Uranus energy may be filling in the spaces in between here, so to speak, and the default setting may be shifting a bit to the bulls.
 Next week (Dec 13-17) is likely to begin lower on the Mercury-Mars-Pluto conjunction. Some bounce is very likely midweek on the Sun-Jupiter aspect but the end of the week could be bearish again although with Friday’s closed markets much of the negativity may be avoided. Overall, this week may end a little higher. The following week will likely begin positively on the Mercury-Jupiter-Uranus aspect but prices may drift lower by Friday. The week before New Year’s looks quite bearish, although we should see some rally attempt in early January and the exact Jupiter-Uranus conjunction. January as a whole looks choppy at best, however, and prices may move sharply in both directions. The late January period seems more reliably bearish as Saturn turns retrograde on 26 January. This may well usher in a new corrective phase that lasts well into February. In fact, there are indications that suggest significant down moves are likely in March. While I doubt a correction will last this long, it does suggest that Q1 2011 will be quite bearish on the whole. It is likely that the Q1 low will test support at the 200 DMA (currently at 5486) and it could well be lower than that. We should see some bottoming process take place in March and April with a substantial rally likely in May and June and perhaps into July. Generally, August and September should see another major move lower on the double whammy of the Saturn-Ketu and the Uranus-Pluto aspects. There is a good chance that we will see a lower low in Q4 than we see in Q1 or Q2.
5-day outlook — neutral-bullish NIFTY 5950-6050
30-day outlook — neutral-bullish NIFTY 5800-6200
90-day outlook — bearish NIFTY 5000-5500
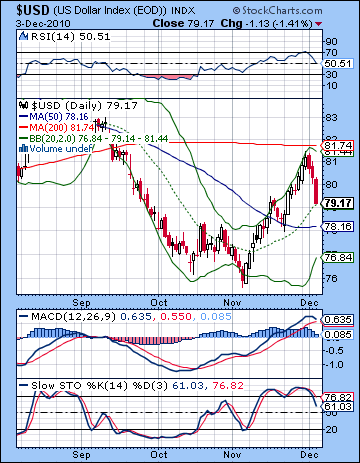 As some measure of stability returned to the Eurozone after the Fed’s pledge to backstop any fund with additional monies, the Euro recovered to 1.34 last week. The US Dollar Index slipped to 79.17 while the Rupee finished Friday at 44.93. While I was correct in thinking the Dollar would rise further early in the week, the extent of the decline thereafter was bigger than expected. Certainly, some renewed risk appetite was likely on the midweek Mercury-Venus aspect. What I completely missed was Friday’s Dollar decline on the Mars-Uranus aspect. This is usually a bearish combination that heightens sensitivity to risk, so it was surprising to see the Dollar fall for the third day in a row. For all the weakness here, the Dollar has merely retraced to the 20 DMA. In a bullish turn, the 20 DMA has now crossed over the 50 DMA as even the 50 DMA shows the first signs of rising. The Dollar found some resistance at the 200 DMA at 81.74 and appears to be undergoing a retracement before staging another rally attempt. However, MACD is turning lower and may be in danger of a bearish crossover here. Stochastics (61) are plunging and may be headed for a rendezvous with the 20 line in the not too distant future. If and when they do, it will be important to gauge the relative price levels and see if any positive divergence is in evidence. Given the fact that the last two Stochastics lows were higher than the previous one, we may well have the makings of a series of three progressively higher lows. This would suggest that further upside is more likely. RSI (50) has come down a bit, but the positive divergence is still very much in evidence with respect to the August high. Some technical analysts are suggesting that the Dollar is likely to turn higher very soon since this retracement has merely dropped back to the level of previous resistance. Put in terms of the Euro chart, the current bounce is just price coming back up to the previous support line to kiss it goodbye. This seems quite plausible although one wonders if the Dollar might retrace somewhat lower, say, to the 50 DMA at 78.16.
This week looks mixed as the early week offers the possibility for gains on the Sun-Saturn aspect which is likely to scare investors back into safer instruments. At the same time, the USDX natal chart has a heavy Saturn influence itself, so that undermines my confidence a little in early week gains. The midweek period looks worse as Venus aspects both Pluto and Mercury. There is some chance for further gains on Friday although that is even less certain than the early week opportunity. Overall, I would not be surprised to see a mostly flat outcome here. Next week may see more choppiness but there should be a bullish bias in the Dollar as we move into the second half of December and early January. We seem likely to break above the 200 DMA and we could even see a run all the way to 85-88. Things could get very interesting in January, however, as the aftermath of the Jupiter-Uranus conjunction could see the Dollar fall again. What’s significant here is that it may mark a sea change in the relationship between the Dollar and equities. Since I am expecting stocks to fall in Q1, a declining Dollar would mark a new chapter as all asset classes (including bonds) would fall in unison. Another phase of deflationary deleveraging may be in the offing.
Dollar
5-day outlook — neutral
30-day outlook — bullish
90-day outlook — bearish-neutral
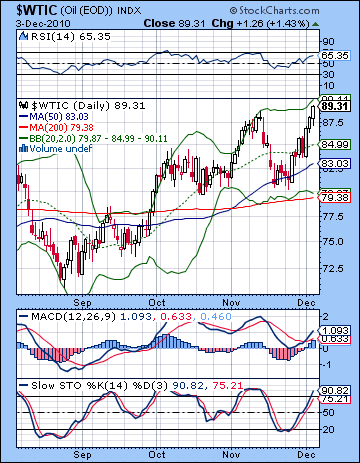 As inflation fears were stoked by rising debt concerns, crude soared more than 6% as investors sought hedges against currency devaluation. While I was correct on some of the week’s forecast, it was Friday’s gain that was the most surprising. Monday was lower on the Mars-Jupiter aspect as I suspected it might be, while we got a rebound on the midweek Mercury-Venus aspect. I thought we had a good chance of going lower on the tense Mars-Uranus aspect but it seems to have been overruled by a favorable pattern in the Crude Futures chart. Crude was so bullish last week that it closed at its highest level since October 2008, exceeding November’s high. Obviously, there’s no longer any need to talk about the head and shoulders pattern. Now we have a possible double top formation. Price closed right up against the upper Bollinger band indicating that further upside may be harder to come by. Stochastics (90) have moved into the overbought area while MACD is on the rise and in a bullish crossover. What is important to note here is that there is a possible negative divergence forming as MACD is at much lower levels than was the case at the previous peak. RSI (65) tells much the same story and we can see the same potential negative divergence with a series of lower highs since October. But with a series of higher price peaks, there is a good case to be made for more upside here. Resistance from this rising channel is at $92. The first level of support is around $85 and the 20 DMA with the bottom Bollinger band likely acting as a second level of support around $80.
This week looks quite mixed with weakness more likely in the early week and the Sun-Saturn aspect. Monday is perhaps somewhat more likely to have a gain than Tuesday, but I would not be surprised to see declines on both days. Gains are more likely on Wednesday and Thursday’s Venus-Pluto aspect. Friday could go either way but I would lean towards a bearish outcome on the approach of Mars to Rahu. Overall, the week may have a bearish bias. Next week also tilts bearish although there will likely be some significant upside around the midweek Sun-Jupiter aspect. Some upside is likely before Christmas but that is unlikely to hold into the last week of December. January looks mixed with moves in both directions likely.
5-day outlook — bearish-neutral
30-day outlook — bearish
90-day outlook — neutral
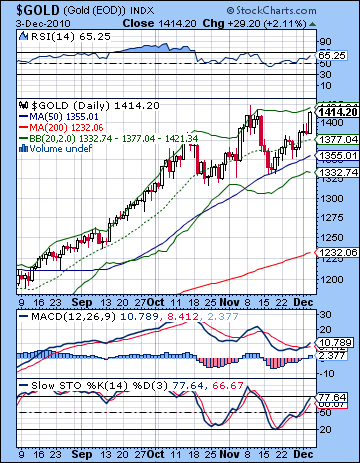 Gold reaped the rewards of all the debt and inflation talk last week and closed at an all-time high at $1414 on the continuous contract. While I wasn’t too surprised by the up move here, I thought we might see more selling later in the week. I thought Monday’s aspect of Mars and Jupiter could create some buying pressure and we saw a modest gain. The midweek Mercury-Venus aspect was even more bullish as Tuesday’s gain was extended into Wednesday. But Friday’s pole vault into the stratosphere occurred on a fairly daunting looking Mars-Uranus square. Oh well, so much for the head and shoulders. Price is again up against the upper Bollinger band suggesting that further upside could be a more difficult proposition. Despite the bullish crossover in MACD, momentum appears to be slowing as the negative divergence is stark. We can see the same negative divergence in the RSI (65) although much of it would be erased were it to climb to the 70 line. Stochastics (77) is well on its way to being overbought although it has yet to get there. It also has a negative divergence. But gold keeps rolling along and taking advantage of the latest crisis. It benefits from any fiat currency worries whether it be the US and its burgeoning debt or the Euro and its own string of endless bailouts. Both of these kinds of government actions are attempts to shore up insolvency by printing more money and of course that is manna from heaven for gold as it is becoming the anti-currency currency. Support may be found at the 20 DMA at $1377 and then at the 50 DMA at $1355. The 50 DMA provided sufficient support in the recent pullback as investors piled back in and took it to new highs.
This week is likely to begin negatively for gold as the Sun comes under the aspect of Saturn on Monday and Tuesday. Some bounce is possible Wednesday and perhaps Thursday, although the risk of decline may increase somewhat as we approach Friday. That said, Friday may still be higher as the Venus-Mercury-Pluto aspect could have enough force to nullify and bearishness from the Mars-Rahu conjunction. Overall, we could move lower on the week. Next week might begin with declines on the Mercury-Mars conjunction but some recovery is likely on the midweek Sun-Jupiter aspect. There is a decent chance for more strength in gold until Christmas although the picture gets murkier after that. Therefore I would not rule out further upside here but January looks like a mixed bag. The second half of January and February in particular looks more decidedly bearish and may represent a deeper correction than anything we have seen in the past several months.
5-day outlook — bearish-neutral
30-day outlook — neutral-bullish
90-day outlook — bearish