- Stocks mixed with losses more likely early and recovery later
- Dollar likely to test resistance at 81 before settling back to 80
- Gold lower early but rebound probable
- Crude prone to declines to $70-72 with gains more likely on Thursday and Friday
- Stocks mixed with losses more likely early and recovery later
- Dollar likely to test resistance at 81 before settling back to 80
- Gold lower early but rebound probable
- Crude prone to declines to $70-72 with gains more likely on Thursday and Friday
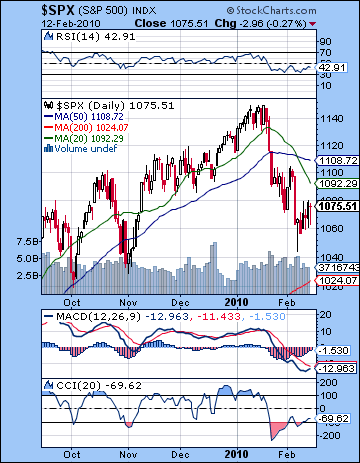 As the promise of an EU bailout of Greece served to calm investor fears, stocks in New York ended slightly higher on the week. The Dow closed Friday 1% to the good at 10,099 while the S&P finished at 1075. I had been more bearish on the assumption that the late week Mercury-Mars aspect would take prices lower. As it happened, only Friday was negative and only modestly at that. The early week saw the expected bounce occur on the Venus-Neptune aspect although this only manifested on Tuesday after Monday’s test of the lows of the previous Friday. The Moon-Rahu conjunction made Wednesday a mildly down day but Thursday’s gain again put bulls in control on news of the EU bailout. I had expected Friday to be worse than Thursday and that certainly was the case, although the decline was much less than expected. So while I had warned of the possibility of a couple days worth of gains, I nonetheless underestimated the upside of having Venus, Jupiter and Neptune grouped together in the same sign of Aquarius. As a result of last week’s successful testing of 1044, the correction may still be underway but has now entered a more confusing phase. After four straight weeks of declines, the bulls gamely attempted to halt the selling trend and push the market higher. That this push higher coincided with a high number of Mars and Saturn aspects was somewhat surprising, given that both are malefic planets that tend to encourage selling. The offsetting influence of benefic planets in Aquarius offered one area of support to the market and likely prevented a deeper retracement towards SPX 1000. Certainly, I had not expected a huge decline in February as I thought there was only a possibility of testing the November lows of 1030-1040. The more likely time for the correction to enter its second phase will likely come in March after the Sun-Jupiter conjunction. The second half of February is therefore shaping up as likely short term consolidation of the lows and subsequent rally higher which will test resistance. In other words, the correction is still the dominant feature in this market, but the initial wave of fear is subsiding, perhaps after one or two more down days to come this week from which to solidify the bottom.
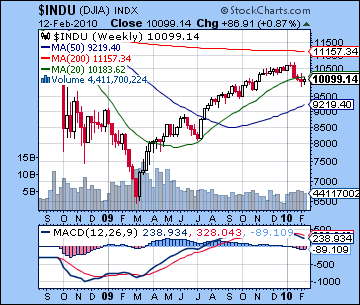
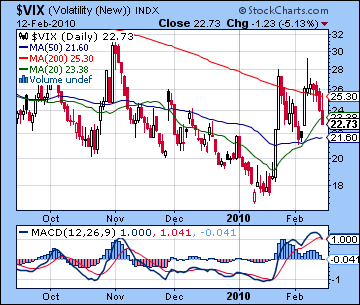
The technical picture of the market improved somewhat last week. Volume is still an issue, however, as the up days did not feature high volume and thus we should be careful in attributing too much conviction to the bulls at this point. Weekly volume on the Dow was actually lower than in the previous down weeks, another sign of the tentativeness of any rebound rally attempt. $VIX is falling but still holding above its 50 DMA, a possible sign of gradually increasing volatility in the weeks to come. The SPX daily chart has an RSI at 42, still bearish but note the rising series of lows suggesting growing momentum on the upside. On the other hand, unless the RSI can reach 50 and all those November and December lows, it will be vulnerable to further pullbacks into the bearish zone. Daily MACD is now deep in the negative and still in a negative crossover but we could see a bullish crossover as soon as next week in the event of a bounce. I do believe that we will see some kind of bullish crossover before the end of February before it again tracks down into March. Even with the slight rebound last week, the SPX is still well below both 20 and 50 DMA. They should be seen as potential resistance levels now as the rally is unlikely to go all the way back the January highs. CCI at -69 is also moving higher and offers further hope to bulls that some kind of technical rebound is in the works here. It’s possible that it might fail to cross the -50 line and fall back before finally going into positive territory at the end of February. Despite the rise last week, MACD on the weekly Dow chart was still solidly negative for the fourth week in a row. This is more of a longer term trend indicator which adds evidence that we are in a lasting corrective phase that could now extend beyond the scope of the July 2008 pullback. Price support at 1030-1040 is likely fairly solid here so even if we happen to have two down days in quick succession this week, the market is unlikely to break below it. That will give bulls more confidence to take the market higher as we head into March. 1080 is the next resistance level and there is a good chance we could test it again this week, presumably towards the end of the week. Unless there is a major decline that takes the market down to 1030, I think it is likely that the market will eventually test 1104 by the first week of March. Whether or not it goes above that level is perhaps a harder question to answer. If it does, then we cannot rule out another run to 1140-1150. This doesn’t seem likely since Mars will be retrograde through March 10 so that should act as a drag on any rallies. The rest of March is likely to take out 1040 quite quickly and indeed 1000 may fall by the wayside. It is difficult to know just how we could go by the end of March, but anything from SPX 900 to 1000 is possible.
 As the EU is likely to offer its specific proposals to backstop Greece this week, the financial markets are still giving signals of weakness. Friday’s treasury auction was deemed a failure by some commentators owing to weak bid-to-cover ratio and the fact that the largest buyers were unknown, and therefore likely government stepping in to prop up the whole exercise. Yields are creeping higher on all parts of the curve. The 30-year treasury rose again last week and hit 4.7%, very close to the crucial 5% level which many observers feel would force Bernanke to act and radically squeeze cash out of the system. Yield on the 3-month T-bill has more than doubled since January and now stands at 0.1%. While this is still well within the 0-0.25% range set by the Fed, if it continues to move up it will again make things very uncomfortable for Mr Bernanke. Of course, the reason why yields are moving higher is that risk appetite is diminishing as the spectre of sovereign defaults is not far from anyone’s mind. Even the prospect of EU loan guarantees to Greece (and therefore to Portugal and Spain) may not be enough to sate bond investors from demanding a higher return for their capital. With the world awash in cheap money, there are now more efforts being made to tighten the flow. Last week China increased banking reserve ratios in an attempt to keep a damper on its inflationary bubble in the making. For his part, Bernanke also announced last week that he will begin to raise the discount rate perhaps before the next Fed meeting on March 16. (N.B. We should note that the discount rate is not the same more widely watched Fed funds or overnight rate. The discount rate is usually about one percent above the funds rate, although it is currently at 0.50% in order to supply liquidity to the financial system. The discount rate is used primarily for short term emergency loans to financial institutions from Fed member banks.) With March looking quite negative astrologically, it seems the market will not take kindly to the next Fed meeting. There may be more open discussion of raising the overnight rate with a possible timetable offered. In any event, we should watch the 3-month T-bill yield closely here as it will likely tip Bernanke’s hand. If it starts to rise towards 0.25% — the upper level of the current discount rate — then stocks will begin to sell-off in anticipation of the inevitable announcement by the Fed that rates will be rising sooner rather than later.
 With the markets closed for the Presidents’ Day holiday on Monday, this week again offers the prospect of a high number of simultaneous aspects. This is likely to increase volatility and also the chances of some larger moves in either direction. Generally, the early week (Tue-Wed) appears more vulnerable to declines although I would not be surprised if declines were modest. Monday sees a Sun-Neptune conjunction which could represent the faith and hope (Neptune) in the government (Sun) bailout by the EU to solve the Greek situation. A positive outcome would be predicted if this were the only aspect in play however Mars will also be in close aspect with Saturn here so that could mean that details of the bailout may not be well received. With both Mars and Saturn moving very slowly here in their respective retrograde cycles, this aspect will essentially be in effect until Wednesday so we cannot rule out the possibility of a sizable decline in any one or possibly two of those days. Meanwhile Venus will conjoin Jupiter on Wednesday so that injects a certain amount of optimism into the equation that will likely manifest as an up day somewhere along the way, most probably on Tuesday. If we happen to see a big sell-off Tuesday (below SPX 1060), then Wednesday stands a better chance of a rebound. If the tug of war between bulls and bears has continued through Tuesday with little change or a gain, then Wednesday could well be a significant down day. Thursday looks quite positive, as does Friday as the Sun moves between Jupiter and Neptune in Aquarius. Where we end up this week is harder to say, however, given the possibility for a larger move down in the early going. There is a good chance that we will finish somewhere between 1060 and 1090, although I would still lean towards a negative outcome here.
Next week (Feb 22-26) will likely see the bulls dominate the market as Friday’s Sun-Jupiter conjunction will likely put an optimistic shine on the proceedings. The week could well start negatively, however, on a minor Mercury-Saturn aspect. Sentiment should improve through the week as the Sun-Jupiter approaches completion and Mercury gives an added boost by coming within one degree of Neptune on Friday. The end of the week looks strongest. The following week (Mar 1-5) begins positively enough on the Venus-Uranus conjunction. Depending on what happens between now and then, it’s possible that this week could mark the mini-rally high. This would therefore might be a good time to exit long positions. The week overall looks bullish but the following Monday, March 8 may be quite negative as Venus opposes Saturn. This could be the start of the next leg down which lasts into late March, perhaps until the 22nd. As noted above, I would not surprised to see the market test SPX 1000 here, and perhaps much lower. April generally looks more favourable so another run up is likely for the next 4-8 weeks after the lows have been made. A 50% retracement from the March lows to the January highs (1150) is a minimum target, although it could go proportionally higher than that. If we get down to 1000, then that would make the April-May high around 1075. If we end up falling all the way down to 900, then that would translate into 1025. This is all fairly speculative at this point, so let’s first see what kind of rally the bulls can conjure up for late February-early March once we put in the lows. As mentioned previously, the market looks increasingly dangerous as we move into May and June. The summer may see a major decline that tests the lows of March 2009.
5-day outlook — bearish-neutral SPX 1060-1090
30-day outlook — bearish-neutral SPX 1060-1080
90-day outlook — bearish-neutral SPX 1040-1100
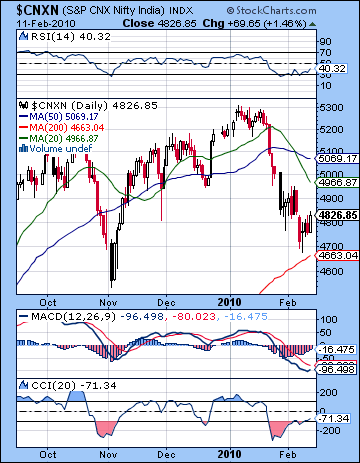 Stocks in Mumbai moved higher for the first time in four weeks on the prospect of an EU bailout of Greece might alleviate fears of sovereign debt defaults in the future. In a holiday-shortened week, the Nifty closed almost 3% higher at 4826 while the Sensex finished at 16,152. I had expected more gains here mostly on the fallout from the late week Mercury-Mars aspect. As it happened, this bearishness did not materialize by Thursday so market finished higher. I did expect some early week gains on the Venus-Neptune aspect and these were largely borne out as Monday saw a reversal and Tuesday added a modest gain. Wednesday was tougher to call and indeed the market took a small step back. I was mistaken in attributing too much weight to the Mercury-Mars aspect, although I did note the likelihood that Indian markets would escape the worst of it due to the holiday closing on Friday. Indeed global markets did fall Friday although more modestly than I had anticipated. Thursday’s solid rise appears to have resulted from the three-way alignment of Mars, Jupiter and Saturn with Jupiter adding the necessary injection of optimism into the mix. Overall, the rebound offers some hope to bulls although the correction is still very much in place. So far, our assessment of January’s solar eclipse as a possible turning point is still valid as the slow releasing of negative energy from the twin retrogrades of Saturn and Mars have served to drag down prices. With Jupiter now separating from Neptune — now fully 10 degrees away — the main support for the rally of 2009 has been removed. The correction is likely to continue well into March, even after Mars finally ends its backward journey on 10 March. The ongoing retrograde motion of Mars is likely to reduce the strength and duration of any rally attempts we may see here in the next several weeks.
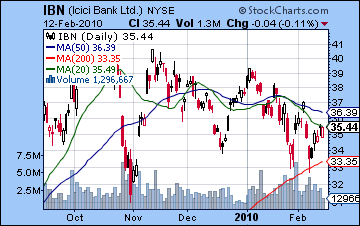
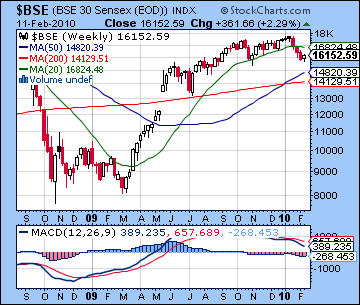
The technical situation of the market remains vulnerable here. Both 20 and 50 DMA are still in a death cross and both are falling. Daily MACD on the Nifty also remains in a bearish crossover and is deeply in negative territory at -96. It is made even more bearish perhaps because MACD is lower than its November lows when prices were not quite as low — a negative divergence. At the same time, some kind of rally seems possible since histograms are shrinking so that a bullish crossover may be in the offing in the near term. RSI at 41 is rising now although it is still in bearish territory. It suggests more upside also since current levels are equal to those made last week when the market was a little higher, hence a tiny bullish divergence. CCI at -71 has finally broken above the critical -100 level suggesting the possibility that the bear trend may be subject to change. The weekly BSE chart still shows a MACD negative crossover, now going into its 15th week. This is an increasingly bearish burden for this market and unless it can break above its trigger line, the technical case for adding to medium or long term long positions in the market is not compelling. Recent concerns over growing debt levels have not been kind to the financial sector, as the ICICI chart reveals. Despite last week’s gains, it has only retraced back up to its 20 DMA. In terms of the Nifty chart, last week the market successfully tested the 200 DMA (4660) as we saw a strong reversal on Monday just below 4700. So the 4600-4700 should be seen as significant support in case we see any declines this week. Given the malefic quality of the Mars-Saturn aspect, I would not rule out another test of this level here. Below that, 4000 is the next major support level although I suspect we may have to wait until perhaps late March for that to come into play at all. Although the 20 DMA (4966) is falling, it may well end up acting as resistance in the likely event of a rally attempt this week and next. After that, the 50 DMA (5069) may also bring more sellers into the market. We should also note that the bottom end of the rising wedge roughly corresponds to the 50 DMA at 5000-5100 so that would be a possible upper target to any rebound rally during the course of this correction. Following the classic technical rule, what was support at the bottom of a pattern now becomes resistance after prices have fallen. It is possible this resistance level could be tested at the end of February or more likely in the first week of March.
 This week sees a number of close aspects occurring early in the week. This could increase volatility and open up the possibility of sizable moves in either direction, although the possibility of down moves is probably greater in the beginning of the week. A Sun-Neptune conjunction occurs on Monday and this may reflect faith (Neptune) on a government (Sun) bailout as the EU lays out specifics to deal with Greece. While this action may offer support to the market, a selling on the news is also a possibility here since Mars will be in close aspect to Saturn at the same time. With both Mars and Saturn moving quite slowly here, the effects of their aspect may carry over into Tuesday and possibly even Wednesday, so it is hard to pin down which day is most vulnerable to declines. Another possibility is that declines will occur intraday only to be reversed as bulls buy the dips as volatility increases. Tuesday sees Venus approach Jupiter, signifying a greater willingness for risk and perhaps a better chance at an up day. Wednesday will see this pairing come exact and that would again accompany some profit taking, especially with the Moon opposing Saturn. Thursday could lean towards the bulls as the Mars-Saturn begins to separate, and with Friday perhaps also inclining towards a gain, somewhat more so that Thursday. Overall, the week could end quite mixed even after we have significant up and down days. One scenario is that the recent lows are tested on Monday or Tuesday, with some recovery afterwards. I’m less confident about this outcome, however, but it is as plausible as any other. The process of consolidation will likely translate into repeated tests of the bottom before any significant move higher can take place. Last week had one such test, and this week will likely have another one. In all likelihood it will be a successful test and the market will recover from any trades near 4700.
 Next week (Feb 22-26) generally looks more bullish so we are likely to see a move off any bottom we form this week. Monday may begin with weakness on the minor Mercury-Saturn aspect. More gains are likely as the week progresses, however, with Friday perhaps looking most bullish with the approach of the Sun-Jupiter conjunction. The following week (Mar 1-5) also looks mostly positive as Venus conjoins Uranus on Wednesday. With the Mars Direct station due to occur on 10 March, the first week of March may well be a good time to exit any long positions assuming the market has formed a short term high. In addition to the increased strength of Mars, Venus will oppose Saturn on 9 March and so will begin a series of Saturn aspects through March that will likely push prices significantly lower. There is a real chance that this will be another down leg to the correction that will ultimately break below recent support of 4700. Stocks may begin to stabilize in late March with the last of the Saturn aspects as the market builds into a rally into April. The rally is likely to last at least four weeks after any bottom is put in, and perhaps longer. As a minimum, we should expect a 50% retracement rally from any bottom we see in March and the January highs of 5300. Depending on how low we go here, this could mean an interim high of anywhere between 4700 and 5000 in April or May. To reiterate from previous weeks newsletters, the period after May looks increasingly vulnerable to declines and we may see the rally fail to match previous highs. When this reality sinks in, it may spark further selling and the beginning of a major leg down in late July or early August. I would not be surprised to see the March lows of 2500 tested by late summer or the fall.
5-day outlook — neutral NIFTY 4700-4900
30-day outlook — neutral-bullish NIFTY 4800-5000
90-day outlook — neutral NIFTY 4600-5000
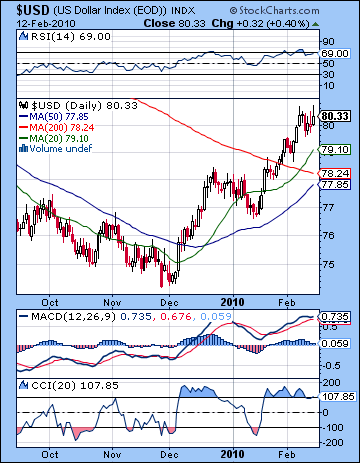 The US Dollar was mostly unchanged last week as the Greek default threat was matched by the prospects for some kind of loan guarantee by the EU. Despite some early weakness, the USDX closed above 80, marking its second weekly close above that level. This outcome was not widely unexpected, although I thought we might see a little more strength towards the end of the week. However, the intraweek trend forecast was largely correct as the largest decline occurred Tuesday, just as the transiting Mercury came under the aspect of natal Saturn. The forecast call for late week strength was also borne out with Friday’s major gain as the transiting Mercury made good on its aspect to the natal ascendant. While the technical picture on the Dollar still looks bullish, it is important to note that it did not post a gain for the first time in four weeks. This is a sign of significant overhead resistance at the 81 level that I noted in previous newsletters. Momentum continues to be strong as 20 and 50 DMA are rising and daily MACD is still in a bullish crossover, although histograms are shrinking, a possible indicator of more significant pullback in the days to come. MACD has also formed a higher high here (0.735) than its December peak, a sign of resilient strength going forward. RSI at 69 shows signs of slipping out of the overbought zone while CCI (107) remains bullish. As positive as the technical outlook is, some kind of retracement is likely this week or next. This could take the Dollar down to 78 which would coincide with the 50 and 200 DMA. Another push higher is likely after that, probably in March, and we will likely see the USDX break above 81 at that time.
This week looks mixed again with some possibility for gains between Tuesday and Wednesday. There is a somewhat more reliable indicator for a gain on Wednesday as the natal Jupiter is aspected by both Mercury and the Moon, with the effect most positive towards the close. While Wednesday suggests buying, we could still see a gain on Tuesday although the aspecting is somewhat more implicit on those days as the Venus-Jupiter conjunction forms a minor aspect to the Midheaven. The late week period looks more bearish, however, as the transiting Sun forms an aspect with the natal Saturn. This is somewhat more likely to manifest on Thursday as Friday may see a return to buying as the day progresses, although perhaps not quite strong enough to get back into the green. Next week looks more bearish as transiting Jupiter comes under the influence of Ketu, the planet of renunciation. This looks like a significant move down, perhaps back to 78 with the largest declines occurring on Thurs-Fri. The first week of March looks more mixed, however, and that could mark the end of the retracement. Jupiter will then conjoin the natal Moon (18 Aquarius) in the second week of March and that will likely coincide with a big move higher. March looks quite strong here as Jupiter will rule the roost near the 4th house cusp (=contentment and happiness). I am expecting the Dollar to rise above resistance at 81 and make a move towards 83-85.
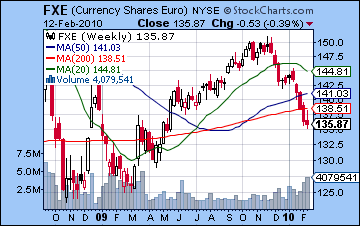 The Euro stayed front and center last week as the EU promised support to its most beleaguered member, Greece. And yet not even this assurance was not enough to stop the losing streak as the Euro chalked up its fifth loss in as many weeks, closing just above 1.36. Our bearish forecast was more or less correct as the Euro suffered only a mild pullback. We were also largely correct in predicting gains for midweek as Tuesday’s gain briefly stemmed the outflow from the Euro as rumors of the bailout began to circulate. The late week period saw weakness return as forecast with the transiting Sun losing energy through its conjunction with natal Ketu. The technical picture is as grim as ever on the Euro as MACD, RSI and CCI all show substantial bearish signals. There is really very little indication of any rebound here, although one might be forgiven for thinking that 1.35 could offer some resistance in the short term. This week may see 1.35 tested,. although there is a relative absence of any obvious afflictions in the natal chart that would support such a view. The transiting Sun does move into a difficult position on Tuesday or more likely Wednesday so if there is going to be a down day, that is perhaps somewhat more likely than any other. It seems quite possible that 1.35 will hold here and the Euro will attempt to rally going into March. 1.40-1.41 is a possible upside target for the first week of March. After that, look for the Euro to weaken substantially as Saturn will cross the ascendant and the faster moving planets will activate it by opposition. We could see 1.30 by the end of the March. Meanwhile, the Rupee climbed last week finishing at 46.5 as investors again took positions in emerging markets after the EU announcement. This week looks mixed so I do not expect a significant result in either direction. The bias should be towards gains now, however, as the period heading into early March seems more favourable. 46 is possible.
Dollar
5-day outlook — neutral-bullish
30-day outlook — neutral-bullish
90-day outlook — bullish
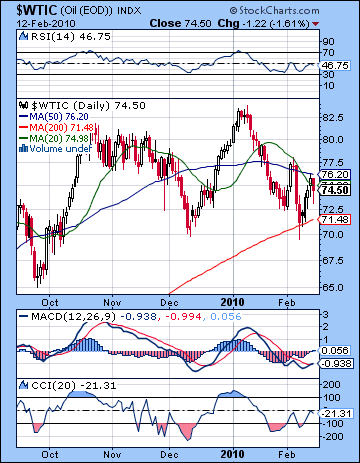 As the EU intervention in Greece offered some relief to recent fears, crude oil racked up significant gains last week as it closed above $74 on the continuous contract. While I had been more bearish in my forecast, I can take some solace in the fact that the intraweek trends were not as far off the mark. I had isolated the late week period as the most negative and indeed the only down day occurred Friday as crude sank 2%. Gains were more plentiful ahead of the Mercury-Mars opposition in the midweek period as the Venus-Neptune conjunction helped to buoy sentiment. Despite the recent correction, crude has showed some technical signs of strength here. Friday saw the beginnings of a bullish MACD crossover in the daily chart and RSI (46) has bounced off the oversold zone. It still has to break above 50 to give an added boost to any rally prospects, however. CCI (-21) is also showing signs of moving into positive territory. While prices rose on four out of five days last week, it is still important to note that resistance was encountered at the 50 DMA around 76. Moreover, the inability of bulls to exceed the previous high of 78 is not a source of strength going forward. We still have the bearish pattern of lower highs and lower lows intact unless or until the previous lows of 71 hold in any downside test. Resistance lies at 76 and then 78 and after that, in the 80-82 area.
This week crude looks poised to go lower in the early part of the week as transiting Mars squares the Moon-Saturn conjunction in the Futures chart. Due to the slow motion of Mars, it is difficult to pin down what day this is more likely to occur. Tuesday and Wednesday have the added disadvantage of Sun forming an aspect with natal Rahu, and of those two, Wednesday may be somewhat more bearish. Some recovery is likely Thursday and Friday, with Thursday looking somewhat more bullish than Friday. Overall, crude may end up trading between $72-76 although with the high number of aspects at play here, I would not rule out a sudden large move to the downside. This is unlikely to last, but if Monday is fairly neutral, then a plunge on Tuesday and Wednesday could well retest $71. A rebound back towards current levels of $74 would likely follow by Friday. As Venus and the Sun join Jupiter in Aquarius for the rest of February, we should see crude take on a bullish bias. A big gain is likely Feb 27-28 in particular as Venus sits at the top of the natal chart while the Sun conjoins Jupiter and thereby activates the natal Sun-Uranus aspect. I would not be surprised to see a 5% boost in crude then. March may be more bearish, however, as we could see a top put in in the first week, possibly near $80. Prices are likely to break through the $70 level by the end of March with $60 as a potential target on the downside.
5-day outlook — neutral
30-day outlook — neutral-bullish
90-day outlook — neutral-bullish
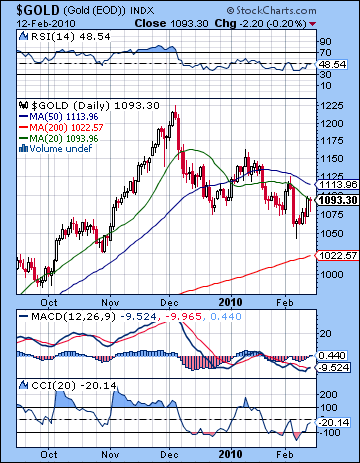 Gold broke its downward trend last week as it posted a healthy 3% gain before closing at $1093 on the continuous contract. I was more bearish in last week’s newsletter, although I did hold out the possibility that we could see $1100 at some point and finish positively. The Venus-Neptune conjunction did produce a gain on Tuesday so we were net positive for the early part of the week as forecast. I had thought that Wednesday may also be an up day on the Jupiter-Mars-Saturn aspect but it turned out the big gain of the week came Thursday instead after some retrenchment Wednesday. Friday was negative as expected on the Mercury-Mars opposition but the intraday lows were fleeting as buyers moved in the afternoon and cut much of the losses. Last week’s rally notwithstanding, gold is still in a corrective phase. The 20 and 50 DMA are both falling. Daily MACD is near a bullish crossover, however, so that augurs more positively in the short term perhaps. RSI (48) is rising but until it crosses the 50 line, the rally will be fledging and may not stick. CCI (-20) is also on the verge of crossing into more positive territory although until it does, a long position may not be rewarded. If the daily indicators are somewhat equivocal, weekly indicators are less positive as MACD is still very much in a bearish crossover. Friday’s close of $1093 was exactly on the 20 DMA and may be a short term level of resistance. More likely, the 50 DMA at $1113 would serve as resistance in the event of any spikes higher. Since a rally is likely in late February and early March, we will have to keep an eye on the previous highs of $1125 and $1160. Failure to push past both of these will be bearish indications that would signal the bull rally is over and that gold’s next major move is lower.
This week looks volatile for gold as the early week has the potential for a significant down day. The Sun-Neptune conjunction early in the week could see a fleeting rise in prices but generally the effects of Neptune are negative. As the secondary significator for gold, Venus receives a boost from Jupiter on Tuesday and perhaps into Wednesday also so some kind of rebound is likely on one of those days. Tuesday may perhaps be the better candidate for a rise as Wednesday may be less positive and even negative. Thursday may be bullish as the transiting Sun forms a sextile with the ascendant in the ETF chart with Friday going either way. Overall, gold may end up close to its current levels, although if the early decline is big enough, it may end up outweighing any subsequent gain. I would expect the resistance level of $1113 to hold in any event. Gold will be on more solid footing next week as the Sun approaches Jupiter so we may see more resistance levels tested ($1113, $1160) as we move into March. The picture darkens fairly soon after however, as the Venus-Saturn opposition on March 8 is likely to take prices down, perhaps sharply. I expect to see another leg down in March that takes out any lows made in February. $1000 may well be tested by the end of March.
5-day outlook — bearish-neutral
30-day outlook — neutral
90-day outlook — bearish-neutral

