Summary for week of February 7 – 11
Summary for week of February 7 – 11
- Stocks vulnerable to declines Monday but likely to rise afterwards; Friday more mixed
- Dollar likely to continue to strengthen although midweek declines are likely
- Crude likely to rise this week although Monday may be bearish
- Gold may decline Monday but further gains are likely this week and next
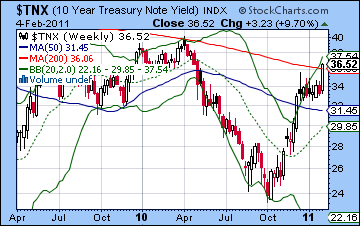
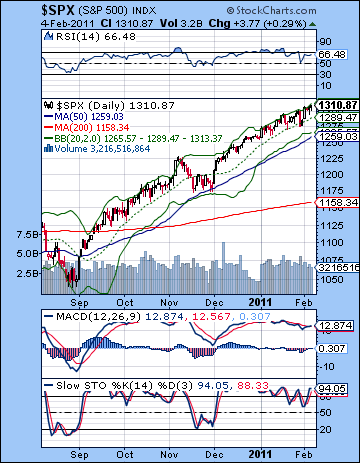 Stocks resumed their winning ways last week on strong corporate earnings and a bad weather explanation for the lackluster jobs report. With the bulk of the gains coming on Tuesday, the Dow climbed 2% to close at 12,092 while the S&P500 finished the week at a hefty 1310. While I fully expected some midweek rise, the absence of any significant selling on the Sun-Mars conjunction at the end of the week was a little disappointing. Even there, however, I had noted that the fallout from the Sun-Mars conjunction may have to wait until Monday the 7th. We will have to see if that comes to pass. If equity markets are not taking sovereign debt and inflation fears seriously, at least the bond market is. Treasury yields rose again this week and suggests the bond market is becoming increasing uncomfortable with the amount of US government spending and the risks of inflation that such spending engenders. This is perhaps a reflection of the growing influence of Saturn in the sky as Jupiter recedes somewhat into the nether regions of Pisces. Jupiter tends to be more tolerant of excess and spending while Saturn takes are more cautious view. Thus far, we have evidence of this Saturn effect in the selloff in the gold and bond markets as downstream implications of risk and growth are viewed with a more jaundiced eye. As Saturn’s sobering influence is likely to increase in the coming weeks, we will likely see a lower value placed on risky assets. The opposition aspect between Jupiter and Saturn peaks on March 29 so that may well be a time when the market is making adjustments for the downside of all this QE2-driven growth. Since much of the market is determined by sentiment and perception, the eventual stock correction may not require a hugely negative catalyst. It may simply be a "half-empty" sort of realization by market participants that there is a risk to Bernanke’s various stimulative measures that have not yet been priced into the market.
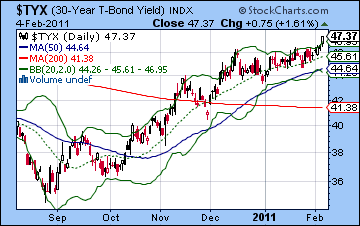
The bond market may have the final say in the matter as yields on the 30-year will likely move towards 5% in short order. We’re almost there now as the 30-year yield rose to over 4.7% last week. This will be bad news for equities for two reasons. First, Bernanke does not want bond yields going significantly higher or it will jeopardize the recovery in the still flagging housing sector. Second, higher bond yields will prove to be increasingly attractive to investors compared with stocks. This will tend to take money out of risky stocks and move them into safer treasuries. If this realization dawns quickly, there could be a mass exodus out of stocks. Certainly, the presence of the Rahu-Uranus square aspect in early March would support some sudden or unpredictable moves of this nature. Both of these planets are somewhat eccentric and correspond with sudden or even shocking events that seek to disrupt the status quo. In that respect, we have to be open to the possibility that the upcoming correction could be fairly large and much deeper than most commentators are expecting. I still would not say that such a large down move of greater than 20% is probable, but the chances are definitely real.
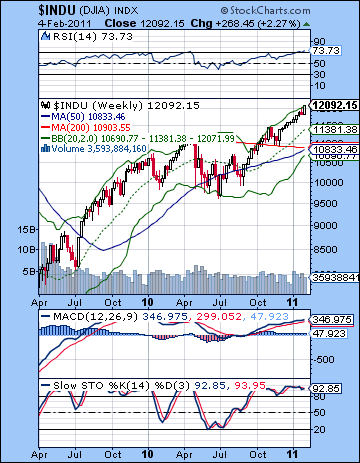 The market has been overstretched here for a while, but one wonders just how long it can continue. The rising channel off the November low shows resistance around the 1325 level next week so that may be the next target for the bulls. Price is bumping up against the upper Bollinger band line here so it is a war of attrition as bulls are relying on the slow and steady melt-up. So far, it’s been hard to argue with them. The previous week’s pullback only made it as far as the 20 DMA and the bottom of the rising channel and then it reversed higher on Monday. This was further evidence that all dips are being bought. If last week’s bullish outcome was not hugely shocking, the fact that the S&P is well past 1300 is food for some thought as it removes the head and shoulders reversal pattern as a possible trigger for a market reversal. As it stands now, the bearish case mostly relies somewhat unconvincingly on the sense of the inevitable: prices cannot climb forever as momentum indicators are clearly overbought. The daily RSI is back up to 66 and may have a little more room to go before heading lower. MACD ended its bearish crossover although it remains in a negative divergence with respect to previous highs. The weekly Dow chart shows an even more unsustainable pattern as RSI has climbed to 73. The RSI is now higher than it was in April 2010 before the correction. With both daily and weekly charts so close to overbought territory, it’s clear that the bullish case is running out of gas. However, we can see that the weekly MACD for the Dow is still in a bullish crossover, even if a negative divergence is still very much in evidence. So if 1325 is the next level of strong resistance, we can see that the key support from the rising channel sits around 1285. A break below this level would spoil the channel and would likely usher in lower prices, perhaps down to the 50 DMA at 1259. This also marks the bottom Bollinger band so we could see more buyers move in there. Below that, the 200 DMA at 1158 would provide some support, especially since it roughly coincides with the 200 WMA on the weekly Dow chart at 10,800 (=SPX 1170). Such a move lower would represent a fairly modest 10% correction. It could well go lower than that, although it is unclear just where the next level of support would be. Perhaps the lows from 2010 at 1040 would be brought into play in the event of a worse case scenario.
As noted above, treasuries weakened last week as yields on the 30-year closed at 4.73%. Yields look to be poised to move higher as they have broken above their December highs. Some commentators have noted that 30-year treasuries are on the verge of breaking above a 25-year resistance level as the bull market in bonds may finally be winding down. Since the 1980s, treasury yields have steadily moved lower in a declining channel with the all-time low set amid the chaos of late 2008 at 2.5%. But yields have moved back to a key resistance level around 4.8% and a move higher would break above this declining channel. It is unclear how much upside momentum such a move would generate, but it could be substantial. It is also possible there could be a very brief fake-out to the upside that prompts the Fed to step in and remove some POMO liquidity in order to move investors out of stocks and into bonds.
 This week begins with the tail end of the Sun-Mars-Saturn alignment. This seems likely to produce at least one down day early in the week, probably on Monday. It could be a sizable move down. The midweek period appears to be dominated by the Venus-Pluto conjunction so that inclines towards more buying. Wednesday is perhaps the most likely day for a gain. The late week looks more mixed with more negativity creeping back in by Friday. Just where we finish on the week may well depend on how sharp any early week selloff is. If it is more than 1% as I expect it will be, then there is a greater chance for a down week. So a bullish scenario would be a modest decline Monday back to1300 on the S&P followed by two up days into Wednesday’s Venus-Pluto conjunction perhaps to 1320 and then falling back to 1310 or so by Friday. A more bearish scenario would see that Sun-Mars conjunction finally bite and produce a close below 1300, perhaps as low as 1290 and the support level of the rising channel. The midweek period would see a bounce off support back to 1300 and then down again by Friday back to 1290-1300. I would favour the bearish scenario here although not by much. Treasuries may be quite weak here especially at the end of the week and I can’t quite figure out how that squares with possible declines on the market. Usually treasury yields move inversely with stocks, so that is one possible area of uncertainty. The market seems unlikely to break any significant support levels just yet, although we may get another important test of support which might embolden bears down the road.
 Next week (Feb 14-18) looks bearish to neutral as Mars joins the Sun in Aquarius. The week may begin unevenly as Mars enters Aquarius on Tuesday so we should count on at least one down day in the early going. The Sun will form a positive aspect with Uranus and Neptune midweek so that may provide a lift for sentiment. Friday looks more bearish again as Mercury enters Aquarius and therefore finds the unfortunate company of trouble-making Mars. I would not be surprised to see a down week here, although it is unclear if we can break below support of the rising channel. The following week (Feb 21-25) looks very bearish as Mercury and Mars will come under the pernicious aspect of Ketu early in the week. This could be a very negative influence and prices may test the 50 DMA or lower. While we could see a rally attempt in the first week of March, stocks could turn bearish with a vengeance for the rest of March under the combined effects of the Rahu-Uranus square and the Jupiter-Saturn opposition. I expect a pattern of consolidation to take place through March and early April after which prices will rise again into early summer. This will likely be a significant rally of at least 15%. How high could it go? Since I am pretty bearish for the second half of 2011, I think we could have some kind of bearish chart pattern put in place with the summer high. Perhaps it will be a double top of 1300, or perhaps it will be the right shoulder of 1220 to create a head and shoulders pattern going back to April 2010. It may well be something else. The market is likely to resume its down move in Q3 and Q4 and we could see some surprisingly large declines.
5-day outlook — bearish-neutral SPX 1300-1310
30-day outlook — bearish SPX 1250-1280
90-day outlook — bearish SPX 1200-1250
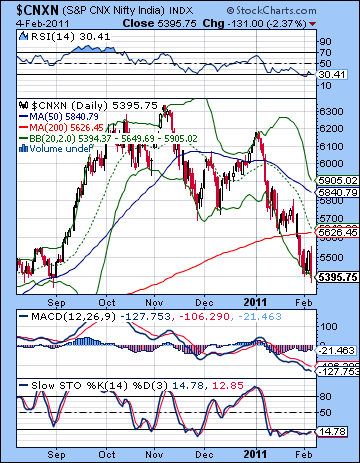 The bears continued to have their way on Dalal Street last week as concern over inflation and rising interest rates shook investor confidence. Despite a two-day midweek rally attempt, the Sensex closed down more than 2% to 18,008 while the Nifty finished at 5395. While the outcome was somewhat more bearish than forecast, I was not overly surprised by the inability of the market to stage a decent rally. As expected, Friday’s Sun-Mars conjunction did correspond quite closely with the biggest down day of the week as the major indices lost more than 2%. I had expected some significant midweek strength on the Mercury-Venus aspect and we got it — although I was late by a day as prices rose Wednesday and Thursday. The early week period was somewhat more bearish than expected, as Indian equities are looking very shaky here. I was open to the possibility of more upside last week in the wake of Saturn’s retrograde station but it was not to be. I was quite uncertain about this possibility given how the array of planets appear to be lining up against the market in the coming weeks. It is dawning on more and more investors just how troublesome the inflation problem is, as a series of rate hikes may be necessary over the coming months to tame the dragon of ever-rising prices. As rates move up, it will eventually impact the corporate bottom line as credit will be squeezed and expansionary plans will be put on hold.
This is in keeping with the fading of Jupiter’s ebullient influence and the return of the sobriety of Saturn. The situation appears to be coming to a head very soon as these planetary embodiments of the two contradictory market forces will oppose each other in the sky on 29 March. The previous opposition aspect occurred in May 2010 in the middle of a major correction and this aspect also appears to favour the bears. Of course, it is conceivable that the bullishness of Jupiter can neutralize the bearishness of Saturn since sentiment is a two-way street. However, Saturn usually carries the day with such opposition aspects and we need to anticipate further downside here. In addition, Uranus and Rahu will form a square aspect in early March just shortly after the release of the Union Budget so that may further jeopardize the prospects for a stable and orderly marketplace. Uranus is the planet of sudden changes and eccentric behaviour while Rahu symbolizes greed and disruption. Their combined influence looks like it may reflect a situation of great uncertainty and change. With the Jupiter-Saturn aspect due just a few weeks later, we should recognize that the investment climate could be quite negative here over the coming weeks. It is possible that India’s stock market may ultimately end up suffering the same fate as China’s as growth prospects were scotched by inflation fears.
 Not surprisingly, the technical picture worsened as the Nifty was unable to recapture the 200 DMA last week. Friday’s decline to a new low below the 5400 level was very bearish, although we may be near support since 5400 was the high from April 2010. The indicators look fairly oversold here as daily MACD is in a bearish crossover but very far below the zero line. That is not favourable for taking of new short positions. RSI (30) is in oversold territory as it also does not offer bears much solace for further moves lower. Of course, markets can stay oversold for a while and do not have to reverse upon reaching the 30 level. Nonetheless, this is another piece of evidence that suggests that further downside could be fairly minimal. The Nifty has been skirting the bottom Bollinger band for the past two weeks and it is almost inevitable that a rally attempt will lift it from this level. In the event of a rally, resistance would initially be found around 5650 which happens to be the 20 DMA and the 200 DMA. The previous rally attempt made as far as the 20 DMA before the bulls gave up. Should any rebound rally rise above this level, the upper Bollinger band may be the next stop, at around 5900. This is the approximate level of the 50 DMA.
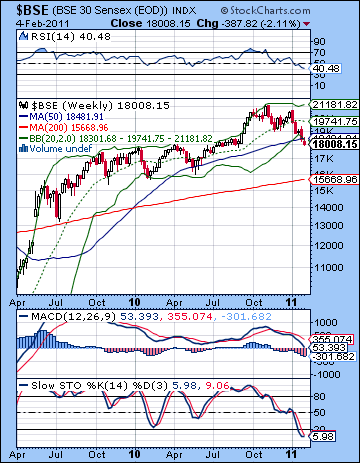
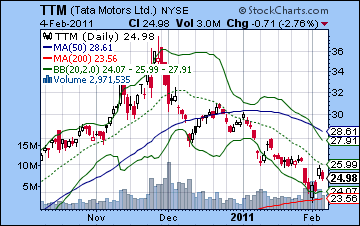
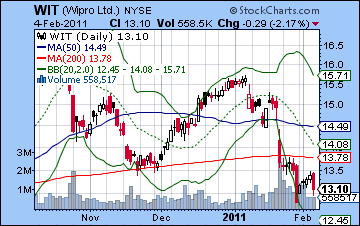
The weekly BSE chart shows just how precarious the market is here as Friday’s close below the 50 week moving average was the first since Q1 2009. Even the correction in May 2010 stopped at this level before reversing higher. The BSE has moved below the bottom Bollinger band for now. This is perhaps a signal that the current down move is almost over. Alternatively, the close below this line could be a sign that the market may trade at much lower prices in the future. While the indicators are predictably bearish, they still have more room available to them on the downside. Weekly MACD is in a bearish crossover but it is only now reaching the area of zero line. In the event of a larger corrective phase, we could see this indicator move well below the zero line. RSI (40) also has some further room to fall before it enters oversold territory. Tata Motors (TTM) rose on the NYSE last week giving some evidence of a bounce off its 200 DMA. It still has a long way to go before challenging its 50 DMA, however. Nonetheless, a number of individual shares showed signs of bottoming last week. Wipro (WIT) also gained last week although it has to climb back to its 200 DMA before mounting a more serious rally. But it did manage to stay above its August low so that opens the possibility that it could bring to rise in the weeks ahead. However, there may well be a move to sell once it recaptures its 200 DMA.
 This week may well end up bullish, although it will have to contend with some lingering bearishness from the Sun-Mars conjunction. Monday is the most likely day for more downside in this respect as the Sun-Mars will be in close aspect with Saturn. At the same time, Venus will be in aspect with Jupiter so that may offset some or possibly even all of the bearish influence. The midweek offers more hope of improvement in sentiment as Venus conjoins Pluto on Wednesday. We could see the market rise two days from this combination, with Tuesday and Wednesday being the most likely pairing, with Wed-Thurs being a second possibility. Thursday lacks any close aspects so it is harder to call. Friday similarly lacks much aspect activity, although it may lean bullish owing to the close proximity of the Sun to Aquarius. A bullish scenario would therefore see some intraday weakness Monday but finishing perhaps flat. This may be followed by a rise into midweek to 5500-5550 and then a further push to 5600 by Friday. A bearish version of these planetary energies might see Monday falling to 5300-5350 and then rising to 5500 by Wednesday. After a slight pullback Thursday, the market will likely advance again on Friday to perhaps 5550. I would lean towards the bullish scenario here, although either way, it seems that the market should be rising this week. It seems unlikely to reach the 20 DMA, although I would not rule it out. This rebound may be part of a larger rally attempt here in middle February that is likely to precede another move lower.
 Next week (Feb 14-18) may continue the rally although it may not be smooth sailing. The early week period looks mixed as Mars enters Aquarius on Tuesday. This may produce some selling Tuesday afternoon. The Sun-Neptune conjunction on Wednesday will likely see more upside but we should expect at least one down day on either Thursday or Friday on the Venus-Saturn aspect. If the market does rise for a second week, then it could meet up against resistance levels and then head lower. The following week (Feb 21-25) looks bearish again as Mars conjoins Neptune while in aspect with changeable Ketu. This is quite a potent trio of malefic energies so there is a potential for a sizable decline. As March begins, we will see Rahu in aspect with Uranus. This is a very dangerous combination that could introduce a shock to the market. Perhaps it will be related to the Union Budget announcement on 26 February. March as a whole looks bearish as Jupiter prepares to oppose Saturn on 29 March. It is difficult to know just how low the Nifty might fall here. I would not rule out some serious downside, and a major collapse is possible. That said, 4800-5000 may be a more probable target for the bottom. The market will likely begin to show some signs of life in April and we may expect some kind of rally to take place through to June or July. August and September will likely be very bearish months with another major leg down on the Saturn-Ketu aspect. This will likely be a lower low for 2011 and will confirm the re-emergence of a bear market.
5-day outlook — bullish NIFTY 5500-5600
30-day outlook — bearish NIFTY 5200-5400
90-day outlook — bearish NIFTY 4800-5300
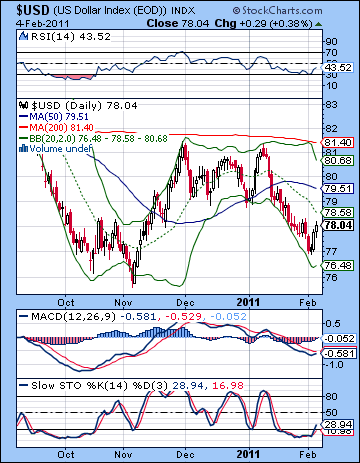 Despite an impressive three-day rally, the US Dollar edged lower last week as investors continued to be tempted into riskier assets. The USDX closed down 0.10 to 78.05 while the Euro slipped slightly to 1.359. The Indian Rupee reversed its previous losing week and climbed to 45.65. While I had been more bullish on the Dollar, the week unfolded mostly as expected with significant weakness early on the Mercury-Venus aspect giving way to a strong recovery on the Sun-Mars conjunction. The technical picture on the Dollar shows signs of improvement here as price is reaching for the 20 DMA after a presumptive bounce off the bottom Bollinger band. While both the 20 and 50 DMA are falling now, it is possible that the Dollar may be undertaking a rally to the upper Bollinger band near 81 as it did in early January. Certainly, the technical indicators would incline towards that interpretation. MACD is on the verge of a bullish crossover while in negative territory which is often a good setup for a significant rally. Stochastics (28) have broken out of the oversold area and may be trending higher. Perhaps the most compelling piece of evidence is the RSI (43) which is moving higher after forming a bullish double bottom on the 30 line. If the Dollar can continue to rally here and bounce off this recent low, it would add further confirmation of the long term rising channel consisting of a series of higher lows dating back to 2008. This would appear to be the most likely scenario, although just where the Dollar is headed is less clear. Can it rise all the way to the resistance level of 88 on the declining channel or will it have to be content with some lesser level? From a medium term perspective, I think there is some evidence that it could get close to 88.
This week looks mostly bullish as we will get more upside from the lingering effects of the Sun-Mars conjunction. Some midweek declines are likely on the Venus-Pluto conjunction but the end of the week may see some strength return. I expect we could see 79 this week, possibly higher, although the pullback may offset some of those gains. Next week looks more mixed as the Sun forms an alignment with Uranus and Neptune that is likely to give a boost to the Euro and other riskier currencies. If there is a pullback, it is unlikely to be too steep, perhaps back to 78 or 78.5. Then the Dollar looks poised to move higher again at the end of February. This should begin a more formidable ascent that runs into early April. This is confirmed by a couple of measurements on the USDX chart and the Euro chart. The disruptive Rahu-Uranus aspect in early March also falls across a sensitive point in the Euro chart so this increases the likelihood that the Dollar will rise further. A breakout above the key resistance level of the 200 DMA at 81 is very likely by April.
Dollar
5-day outlook — neutral-bullish
30-day outlook — bullish
90-day outlook — bullish
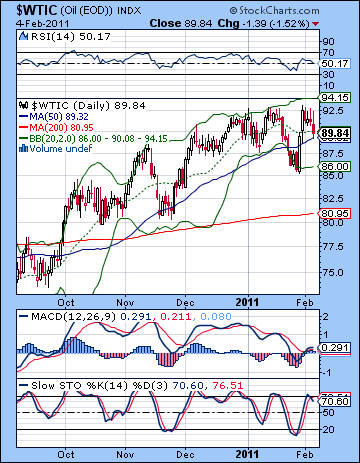 As the situation in Egypt appeared to avoid any worse case scenario, crude was mostly unchanged last week closing under $90 on the continuous contract. While I had been uncertain about the ultimate outcome, the week largely adhered to the script as the early week saw gains on the Mercury-Venus aspect while the declines prevailed near the Sun-Mars conjunction. Monday turned out to be the high water mark as prices peaked above $92 and then largely fell after that. The technicals appear to be weakening here as MACD has slipped all the way down to the zero line despite price staying fairly close to its recent highs. Stochastics (66) have fallen below the 80 line and may well be headed back down to the 20 line. This erosion of momentum is perhaps more clearly seen in the RSI (43) as we see a series of falling peaks. The weekly crude chart also portrays a situation of declining momentum as the key indicators are all falling. MACD, for example, is about to enter a bearish crossover. Resistance is likely close to $94 and the top of the rising channel. Support can be found near the bottom Bollinger band at $85 which would also match the late January low. More enduring support is likely around the 200 DMA at $80.
This week looks mixed with Monday looking more bearish on the tail end of the Sun-Mars conjunction. Some midweek strength is likely on the Venus-Pluto conjunction that should carry the day into Wednesday. It is likely that crude will move above $90 again here. The late week period looks less positive, however, with Friday looking like among the best chance for a decline this week. Overall, we may well close close to current levels, or perhaps a little above. Next week we may see the situation turn more clearly bearish as Mars enters Aquarius early in the week. Some midweek recovery is likely on the Sun-Neptune conjunction, but weakness should return by Friday. Crude will likely trend lower in late February and through most of March with late March likely seeing the sharpest declines. I would think $80 is a virtual certainty by April 1, but a lower level like $70 or even $60 is also very possible.
5-day outlook — neutral
30-day outlook — bearish
90-day outlook — bearish
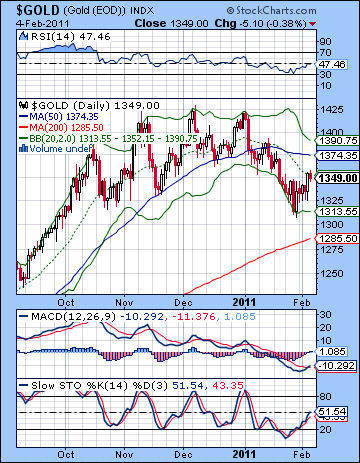 Gold moved modestly higher last week as the chaos in Egypt continued to put investors on edge. Gold closed just under $1350 on the continuous contract. This bullish result was in keeping with expectations although I thought we might have seen more early week upside on the Mercury-Venus aspect. Friday’s Sun-Mars conjunction also fizzled somewhat as the pullback was quite tiny. Nonetheless, gold appears to be trying to build a bottom here from which to rally. It has bounced off the lower Bollinger band and has found support at the 20 DMA. Daily MACD is rising now and has started a bullish crossover. Stochastics (51) are heading higher and still have some room to move further. RSI (47) may provide the most persuasive bullish case as a double-bottom around the 31-32 level has been followed up by a strong gain. Of course, this gain may reverse at any time, but it does incline towards more upside. The next resistance level will likely be near the 50 DMA at $1374. The upper Bollinger band at $1390 would be another source of resistance that might limit the upside to any rally. The next level of support is likely around the 200 DMA at $1285 which is just a little above the summer highs of $1250-1260. This would be the likely first stop in any serious move lower. Below that, one would consider $1000-1050 as providing fairly solid support where many buyers would be brought into the market.
This week could see more upside for gold although the early week period may be hampered by the Sun-Mars conjunction. For this reason, Monday has a reasonable chance for a decline. Gold’s fortunes may improve as the week goes on, however, as the Venus-Pluto conjunction on Wednesday is likely to make bullion more attractive. Next week also looks generally positive as Jupiter moves into a square aspect with Pluto and the Sun conjoins Neptune. We could see some impressive gains, especially in the early to midweek period. The late week period looks more mixed, however. After that, we could see the bears come out again as Mercury conjoins Mars and Neptune while in aspect with dangerous Ketu. This is quite a bearish setup for most risky assets, and I do not expect gold to escape the damage. The 21st and 22nd look the most bearish. So while gold may well return to $1380 or $1390 by the middle of February, most or all of those gains will disappear by early March. That will set the stage for a larger move lower in March as the Rahu-Uranus square will set up exactly on the ascendant of the GLD ETF horoscope. This is an unpredictable combination of energies that will increase volatility. It seems likely to send prices significantly lower by the end of March. $1250 seems fairly likely here, but I would definitely not rule out lower downside targets. Look for another rally to start by mid-April.
5-day outlook — bullish
30-day outlook — bearish
90-day outlook — bearish

