Summary for week of January 17 – 21
- Stocks more likely to rise early in the week with declines probable later
- Dollar likely to rebound after early week declines
- Crude may rise further early, but profit taking more likely towards end of week
- Gold likely to fall further after early week strength
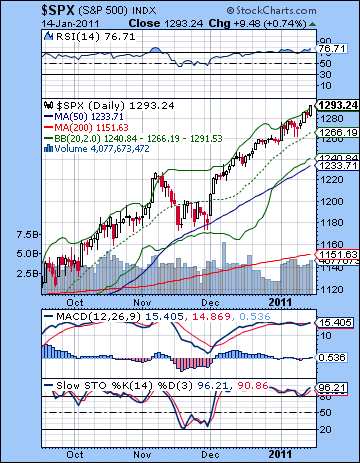 Will this rally ever die? Stocks climbed yet again last week on positive earnings news from JP Morgan and encouraging industrial production data. The Dow closed Friday at 11,787 up 1% for the week while the S&P500 finished the week at a lofty 1293. While I had expected more upside here on the early week Mercury-Jupiter aspect, the bulls never really tired as gains continued right into Friday’s Mars-Jupiter aspect. So we did test resistance at 1290 last week as I thought we might, although this came later than forecast. Overall, it was a slightly ugly week since the best gains came on days that I thought were decent candidates for declines — Wednesday and Friday. Nonetheless, the continued upward drift of the market was very much in keeping with expectations as US stocks have shrugged off the eclipse and the Jupiter-Uranus conjunction. While those two critical celestial measurements have had significant financial effects, equities have thus far held up quite well in spite of the apparent diminishing risk appetite. Most commodities like gold and copper peaked in the first week of January around the eclipse, as have many emerging markets like India and Thailand. This is a perhaps an early warning signal that some of the froth is coming out of the market although we still have a long way to go before sentiment is reversed. Many of the emerging markets are being forced to come to terms with their high levels of inflation as China has again tightened its banking reserve ratio and India’s central bank is about to hike rates once again. In a very real sense, emerging market inflation is the flip side of the QE2-driven US stock rally as hot money goes in search of higher returns. It seems unlikely that US markets can somehow insulate themselves from an emerging markets correction since much of the demand for US-produced goods comes from overseas. And we may have seen this all before since emerging markets peaked two weeks ahead of US markets in April 2010 and that set the stage for the flash crash and the large 20% correction that affected all global markets. Last week I wondered how much gas Jupiter had left in tank to keep prices up and maintain the upward momentum. On the basis of last week’s performance, it seems that aspects involving fast moving planets like Mercury and Mars can still move markets higher. Saturn’s bearishness has yet to make itself felt although that is soon to change as we approach its retrograde station on January 26. Increasingly, it looks like this could be the necessary jolt of energy that will interrupt this Jupiterian rally. Since most observers are expecting some kind of correction in Q1, the real question is: how big with the correction be? I still expect the correction will be larger than many bulls expect, probably closer to 20% than the 7-8% that bullish analysts have suggested. It seems most likely to get started very close to the Saturn retrograde station.
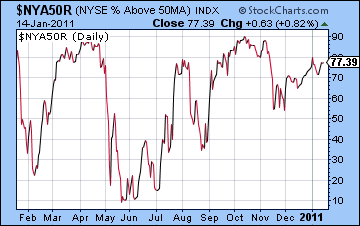
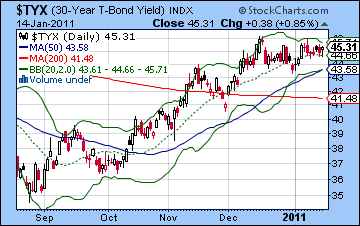
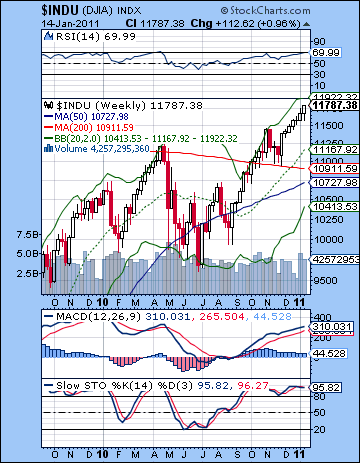 Not much has changed from a technical perspective. The SPX is bumping up against resistance in the rising wedge here and is quickly running out of upside room. Taking the August high as the start of the upper trendline, resistance is now around 1300 (we could well make it there next week). Support from the bottom trendline is now around SPX 1260, so the more bearish correction that I’m expecting would require a break below this level in order to develop some downside momentum. No doubt there will be some buying near this level in the first leg down. The absence of any downside last week just builds up the pressure for sell-offs down the road. But the bulls can still rightly point to all the momentum pointing their way as all three main moving averages are pointing up, although price is running right up to the upper Bollinger band. The 20 DMA at 1266 is fairly close to the bottom of the rising wedge so it’s possible that could bring in new buyers in the event of some down days. But dilemma for bulls will be what happens when the 50 DMA at 1233 gets tested. Normally, that is a better measure of value for those wishing to go long in a bull market. Since most bulls know believe this is a bull market, they will be tempted to buy any pullback to this line. This will be equivalent to the modest 7-8% correction that the more optimistic commentators are calling for. Bulls may like to subscribe to the recency effect as November’s correction pulled also back to the 50 DMA. The problem is that 1233 will be below the crucial support line of 1260 in the wedge. So once 1260 breaks, it is unclear if there will be enough bulls around to buy the 50 DMA. It will be an interesting study in mass psychology to be sure. The technicals look pretty much as overbought as they did last week with the RSI (76) again entering nose bleed territory. The weekly Dow chart reveals an interesting RSI reading of 69.99. Well, that’s about as close to overbought as you can get. On a weekly chart, it is a more bearish indication since markets are less likely to be overbought on a longer time frame. And yet, MACD remains in a nice bullish crossover and is rising. That 200 WMA (10,911) is still looking like an important support level here as it roughly matches the parameters for a shallow correction that the bulls are expecting. The first leg down will likely bounce off this level, at least temporarily. Meanwhile, the breadth of the rally continues to narrow suspiciously, as the number of stocks above their 50 DMA has not kept pace with the rise in price. Note how we have a series of declining peaks around previous tops in April and Oct-Nov and how this may be occurring again. Interestingly, this indicator actually declined 2% on Friday on a day when most of the indices climbed. Bond yields appear to be stabilizing here as the 30-year edged higher last week to 4.50%. The Fed insists that rising rates reflect growing optimism and a belief that the recovery is real, even though the stated intention of QE2 was to reduce rates in order to spur more business activity and to keep mortgage rates low. Well, let’s see if the Fed can continue to peddle that story if rates on the long bond keep rising towards 5%. Eventually, higher yields will draw money out of equities as the returns will be too good to pass up.
 This week will a short one due to the MLK holiday on Monday. The early week offers a kind of replay of last week as we have another plausibly bullish Jupiter aspect in the early and midweek period. Most global markets have an increased likelihood for gains on Monday on the Sun-Uranus-Neptune aspect. This could well spill over into Tuesday in the US as the Sun will then makes its approach to Jupiter. While this does seem positive, it is not quite as likely as last week’s gain due to the problematic position of the Moon in aspect with Saturn. Perhaps the probabilities could be expressed as 50% up, 30% neutral (+/- >0.3%) and 20% down. Wednesday will feature the exact Sun-Jupiter aspect as well as a troublesome Mars-Ketu aspect. So that’s more of a mixed picture which seems more likely to tilt negative. The Moon here is an additional factor as it opposes Sun and Mars. Thursday also seems fairly bearish as the Jupiter influence wanes and the Moon is still opposite Mars. So there would appear to be enough positive planetary fuel for a run to1300 but it may well be confined to Tuesday, or perhaps Wednesday. I would therefore expect an easing off in the late week. So a bullish scenario would be a rise to 1300 or a little above on Tuesday followed a more neutral day Wednesday and then modest selling on Thursday and Friday perhaps with a close around 1280-1290. A more bearish scenario would be a rise to 1300 on Tuesday but this gain may not hold into the close followed by mostly downward pressure for the rest of the week. A close on the SPX might be more like 1270-1280. I would lean towards the bullish scenario, if only out of respect for this unsinkable rally. Hopefully, it’s name is the Titanic.
 Next week (Jan 24-28) we get Saturn turning retrograde on Wednesday. Certainly, this is a key astrological factor in this expected correction. There is a good chance that this will mark the beginning of a longer corrective phase that will likely come in two waves. The first in late January and early February, and the next in late February and into March. Monday may be somewhat bearish on the Moon-Saturn conjunction. While a large drop is possible here, I would not count on it. Tuesday and Wednesday look more bearish as the Mercury-Saturn aspect is closest. The late week period could see some recovery although the week as whole looks quite negative. The following week (Jan 31-Feb 4) also tilts negative although there is a reasonable chance for gains in the early week period on the Venus-Uranus aspect. Declines are perhaps more likely around the Sun-Mars conjunction on Thursday and Friday and then on Monday the 7th. Some of these declines may be severe, perhaps more so on the 7th. Then we could see a rebound rally after the initial corrective phase. This rally could last a week or more although I would caution that February generally looks bearish and is likely to end on a negative note that carries into March. March looks more bullish, however, so that may presume a significant bottom in late February or early March. A 20% correction would suggest a low near that magical number of SPX 1040 — the old support level from last summer. I think that’s quite doable by early March. I would not be surprised if it was deeper than that, nor would I be surprised if we only got down to about 1130. That would amount to a 13% correction off a top of 1300. I’m leaning towards the more bearish scenario here. March and early April look like a quieter consolidation phase before another rally takes over perhaps starting in the second half of April and lasting into May and June. This rally could peak around mid-July, although I am unsure if it will be higher than current levels. It’s certainly possible although I would not say it is probable. Then the Aug-Oct period looks bearish again with another serious correction.
5-day outlook — bearish-neutral SPX 1280-1290
30-day outlook — bearish SPX 1150-1230
90-day outlook — bearish SPX 1100-1200
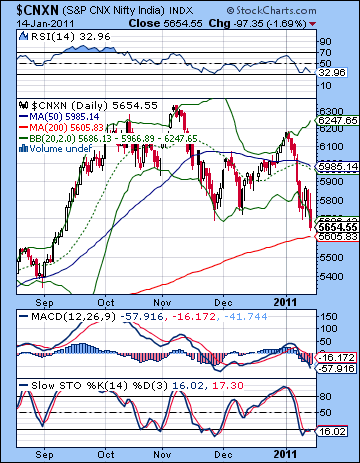 Stocks slumped another 4% last week as new inflation data increased the likelihood for an interest rate hike from the RBI. The Nifty broke through the 5700 support level to close at 5654 while the Sensex ended the week at 18,860. While I have assumed a largely bearish stance in the post-eclipse period in January, the extent of the decline was surprising. I had expected the early week Mercury-Jupiter aspect to provide more upside to the market but we only saw one positive close last week — on Wednesday as it turned out. The late week slide corresponded with the Mars-Jupiter aspect which I had noted was a more unpredictable influence and could see some downside. Overall, the market is weaker than I thought as it has tested critical support levels earlier than I anticipated. Last week’s inability to produce much upside confirmed the rapidly weakening influence of bullish Jupiter. I had expected that much of the late 2010 rally was tied to the Jupiter-Uranus conjunction which culminated on 4 January. I thought there was a good chance that bullishness would subside and the market could well peak on or near that date. Thus far, that assessment has proven to be correct as Jupiter’s positive influence has waned. In addition, the simultaneous solar eclipse has added to the probability that 4 January is an important turning point in the market as many commodity markets such as gold have been falling since that date. What was less clear, however, was the extent of the downward acceleration in prices. I had thought the absence of any clear Saturn influence would temper any losses, at least until we moved closer to the Saturn retrograde station on 26 January. That has largely been the case in most global markets as US and European continued to edge higher last week. India, however, appears to be ahead of the curve in this respect, perhaps replaying what happened in April when emerging markets such as India peaked two weeks ahead of most other global bourses. This set the stage for a deeper correction in May that was truly global in scope. I think there is still a good chance we are in the early stages of a similar global correction, and therefore we should expect more downside in the weeks to come on Indian markets. Our more immediate focus is still on the Saturn retrograde cycle which begins in the last week of January and lasts until June. First off, it is important to remember that this does not mean that stocks will be bearish for the duration of its cycle. The key is that the near stationary motion of Saturn will tend to increase bearish sentiment, especially when it is triggered by other planetary aspects. This is in fact what will happen with the Mercury-Saturn square aspect on 26 January. As it happens, markets will be closed that day for a holiday, but its negative effects will spill over into other days that week. This Saturn retrograde cycle is quite powerful and could push prices sharply lower. We are likely seeing its effects earlier in India because the markets were that much more overbought.
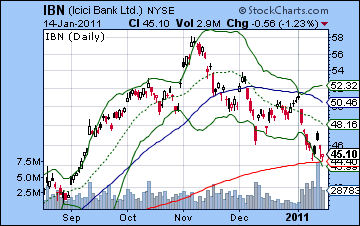
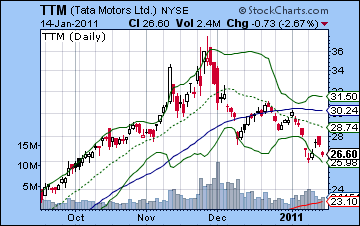
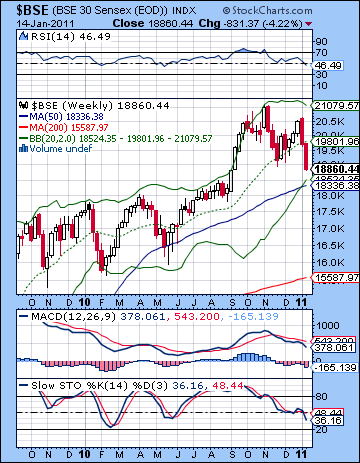 With Friday’s break below the 5700 support level, the technical picture became significantly more bearish. I had not expected this level to be tested until late January, so this definitely increases the odds of significantly lower levels in the near term. 5700 was the horizontal support line from the previous lows. It was also rising trendline that connected the previous highs in 2009 and 2010 before the September breakout. It was widely expected that the combined effects of these two support levels would hold, at least for the first test. I was also in this camp. However, Friday’s break has thrown the technical picture wide open. The next support level would appear to be the 200 DMA at 5605, as this has acted as support as recently as August. Of course, the Nifty is dangerously close to this level already, so the next support may be the 50-week moving average at 5500 that offered support in the May correction. Support becomes less certain below that, although the 5300 level might bring in new buyers. But while the 5700 level was broken, the bulls may point out that the selloff is overdone. Price is skidding along the bottom Bollinger band here and Stochastics (16) are well into the oversold area. Of course, neither measure necessarily means a reversal is at hand, although it would tend to reduce the appeal of any taking any new short positions. MACD is still in a bearish crossover and is now below zero. RSI (32) is falling and is soon approaching the oversold level at the 30 line. Both the November and the May corrections saw the RSI hit or come close to the 30 line so this is a potential sign that this phase of the correction may not have much further to go. The weekly chart of the BSE provides a helpful roadmap of where we are from a medium term perspective. Stochastics (48) are falling but still have a way to go before they reach the oversold level at 30. Similarly, the RSI (46) is falling and will test its recent lows from previous corrections. If it should fall to 40 or below, it would suggest that we could see a correction that is larger than April-May 2010. Support would appear to be around the 50 WMA at 18,300 — about 3% below its current level. This also matches the lower Bollinger band. ICICI Bank (IBN) is testing support at the 200 DMA thus suggesting a possible consolidation around these levels. Of course, the complicating factor is that this chart formed a clear H&S pattern which had a downside target of 42. If this pattern is fulfilled, then price would have to fall another 6-7%. Tata Motors (TTM) also lost ground last week although it is seeking support at the bottom Bollinger band. Since breaking below the 50 DMA, it may have to fall another 10% to the 200 DMA before more buyers can be enticed into the market. Overall, the technicals look weak with more downside possible although they are close to support levels and also oversold so that may produce a bounce.
 This week has a good chance for gains in the early week as the Sun aspects Uranus and Neptune. Monday is perhaps more bullish in the afternoon as the Moon enters Gemini and thus enters into a passive aspect with the Sun. Tuesday could also be positive, with the first half of the day looking more bullish than the close. If this pattern pans out as expected, it would mean that the Nifty could touch an intraday low Monday of 5600 or perhaps somewhat lower and then rise towards 5800-5900 by midweek. Admittedly, that is a fairly bullish outcome but it is conceivable. Bullish sentiment may begin to wane as we move from Tuesday to Wednesday. Wednesday features a close aspect between Sun and Jupiter which is often bullish but Mars and Ketu are also in aspect so that is usually bearish. It is possible they could offset each other and produce a more neutral outcome, although I would lean towards a more negative outcome. Thursday also appears to favour the bears as the Moon opposes Mars and the Sun. By contrast, Friday looks more bullish although it’s not quite a probable as the early week patterns. A bullish scenario could see the Nifty as high as 5800 by Tuesday and perhaps even Wednesday, with more bearishness after that and the week ending up around current levels or a little higher. A bearish scenario would see greater intraday weakness on Monday that makes it harder to produce a rally into Tuesday or Wednesday. Perhaps the Nifty would top out at 5700. Then it would move lower into Thursday to 5500-5600, and then a modest gain Friday but still below current levels. I would tend to favour the bullish scenario since I think the market is a little oversold here, but I don’t expect any bounce to be too strong.
 Next week (Jan 24 – Jan 28) will feature the Saturn retrograde station on Wednesday the 26th, the same day the market will be closed for a holiday. With Mercury in square aspect to Saturn, I would expect mostly bearish moves to prevail through the week. The planets generally look more bearish on Monday and Tuesday, with Friday looking to be the most bullish day of the week. Thursday could go either way. The following week (Jan 31-Feb 4) also tilts bearish around Thursday’s Sun-Mars conjunction. We should nonetheless see an up day on the Mercury-Venus aspect, with Tuesday being the most likely candidate. The late week period looks very bearish indeed and we could see major declines as more support levels are broken. We could see another rally attempt that runs into mid to late February after that but it seems unlikely to retrace very far. Another move lower is likely to begin in late February and it should extend into March. There is a good chance that this will be a lower low with a possible interim bottom in late March or early April. After that, the market should rally significantly as Jupiter begins its aspect of Pluto. I would expect this spring rally to last into June at least, and perhaps into July. It seems unlikely that it will reach or exceed 2010 November highs. Then September’s Saturn-Ketu aspect will likely usher in much lower prices again as a new corrective phase begins. Generally Q4 looks quite bearish and it is possible we could even see Nifty test 4000 by that time.
5-day outlook — neutral-bullish NIFTY 5650-5700
30-day outlook — bearish NIFTY 5300-5500
90-day outlook — bearish NIFTY 5000-5300
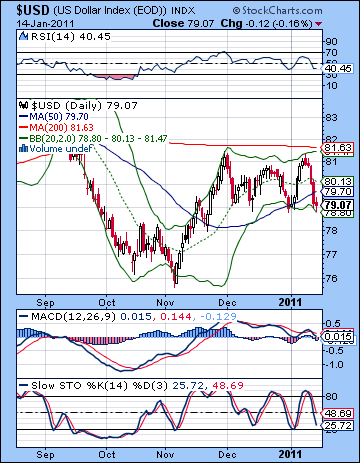 As expected, the Dollar fell sharply last week as European debt fears were neutralized by a successful bond auction in Portugal. The USDX closed down more than 2% just above 79 while the Euro finished the week at 1.337 and the Rupee at 45.44. It was nice to see the planets behaving themselves as the Mercury-Jupiter aspect added to risk appetite as I thought it would and sent investors back into the Euro. Even though I was expecting some midweek downside for the Dollar, I underestimated the extent of the decline as there was no upside at all here. As a result, Friday’s close was below the 50 DMA and at the bottom Bollinger band. The Dollar has been moving sideways for the past two months as it has traded between 79 and 81. Will it reverse here and climb higher once again as it did at the end of December? It’s quite possible since the 50 DMA is acting as a legitimate source of support. It’s not quite as oversold as it was then as Stochastics (26) still have some room to run on the downside. MACD is in a bearish crossover and is just nudging the zero line. This is a potential reversal point. RSI (40) is matching its previous lows so it is conceivable that it could reverse higher here. The Dollar’s current levels match its previous low so this 79 level should be seen as important support. If it breaks lower, then it may fall all the way to 76. That seems quite unlikely now. Resistance, as always, will be the 200 DMA around 81.6. A close above that line will be a game changer for sure, although we may still be a couple weeks away from that possibility. I’m guessing that early February might get us there.
This week looks bullish for the Dollar despite some early aspects that could correspond with a decrease in interest. The early week Sun-Uranus and then Sun-Jupiter aspects are usually correlated with gains for the Euro as risk appetite is increased. While I would not rule out a little more downside for the Dollar in the early going, there is a very positive Venus conjunction to the natal ascendant in the USDX horoscope that should entice investors back the Dollar. This is more likely to occur as the week progresses with Thursday and Friday looking more bullish. So there is a good chance the Dollar finished net positive for the week. Next week also looks good and we may test resistance at 81.6 — 1.29 on the Eurodollar. Early February could blow finally the lid off as the Sun-Mars conjunction has the potential to produce some violent market moves. This is likely to correspond with a safe haven play that pushes the Dollar over the 82 level and then some. It is possible that we could see the Dollar at or above current levels until early April. After mid-February, however, the rise may be muted and the Dollar may have a more difficult climb.
5-day outlook — bullish
30-day outlook — bullish
90-day outlook — bullish
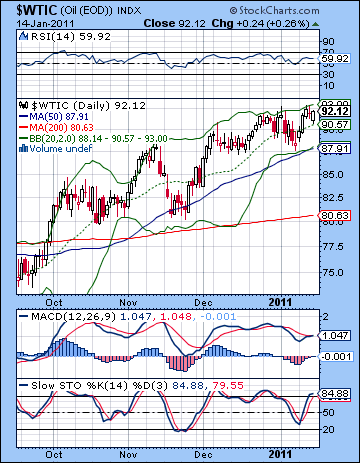 As the Dollar fell, crude enjoyed a corresponding bounce and pushed beyond recent highs closing above $92. While I expected some gains here, I underestimated the force of the Jupiter aspects as rose on four out of five trading sessions. Crude is a popular speculative asset and its price is also bolstered by its status as an inflation hedge. As more central banks around the world move to tighten rates and liquidity in an effort to choke off inflation, this is an important source of its buoyancy. While its gains have been impressive, crude is again back at its rising resistance channel and its upper Bollinger band. Lots of media are talking about $100 oil these days, but it seems unlikely to get there quickly as it is following this rising channel in a fairly orderly way. Support is likely around the $88 level and the 50 DMA. Below that, the $80 level is likely fairly strong support as we see both the 200 DMA and the previous low congregate there. Stochastics (88) have moved into the overbought area thus making long positions less appealing. MACD is showing a fairly pronounced divergence with respect to its previous high and RSI (61) is also diverging from recent price action suggesting a slackening of momentum and increasing the chances for a pullback.
With no commodity trading in the US due to Monday’s holiday, the week will begin on Tuesday and the approach of the Sun-Jupiter aspect. This is normally a positive influence so I would expect some positive follow through from Monday’s positive sentiment. However, this is not at all a certainty since Mars will be in aspect with Ketu. Wednesday is somewhat more negative given the Moon-Mars opposition, although there is still a chance for a positive close. Thursday looks more clearly bearish, however, and Friday could see the bulls return. So the week as a whole could go either way, although I suspect it will finish near current levels or a bit below. For a larger pullback, we will likely have to wait until next week and the Saturn retrograde station. The Mercury-Saturn square may begin to influence the proceedings as early as Monday, although Tuesday may be a more reliable negative day. Wednesday may also tilt bearish, with some consolidation possible on Thursday. Friday may well be higher as the Moon joins Venus in Scorpio. Next week may well see further downside as the Sun conjoins Mars on Thursday. An interim bottom is possible in the second week of February ($80?), although it is also possible that a rally attempt in the third week of February will fail and prices will again fall into the first week of March. So it is possible the late February or early March period could produce a lower low. A protracted bottoming process would then begin in March and continue into April.
5-day outlook — bearish-neutral
30-day outlook — bearish
90-day outlook — bearish
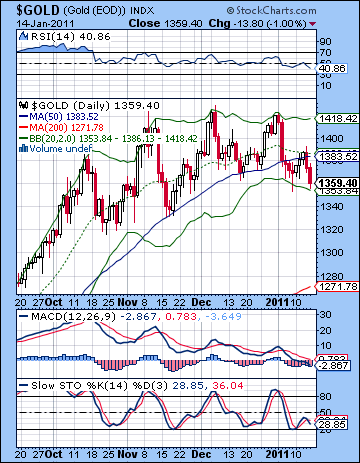 With economic prospects seemingly on the rise, demand for gold as a safe haven fell as bullion slipped again and closed below $1360. This bearish result was largely in keeping with expectations as I wondered if gold could hang onto early week gains on the Mercury-Jupiter aspect. Actually, the early week ended up more bullish than expected as gold put in three winning days in a row, although the gains were modest. The end of the week saw gold selloff more sharply in line with the Mars-Jupiter aspect. So the great gold dumping continues here, with no end in sight. One look at the chart is enough to make bulls cower in fear as gold could not hold onto its 50 DMA at midweek. Its now sitting at the bottom Bollinger band but that should offer little comfort to gold bulls as 20 DMA is now falling and is about to crossover the 50 DMA if the decline is not arrested soon. Perhaps the bulls will insist that the selloff is overdone and that it will reverse higher but there isn’t that much evidence to support that notion. MACD is sliding into the negative area and is still in a bearish crossover. Stochastics (28) only have a bit further to go before being oversold, and RSI (40) is looking quite weak as a downward series of peaks and troughs dominates the chart. Until the 50 DMA at $1383 is taken out to the upside, the bears will be stalking gold in force. Support may kick in near the 200 DMA at $1271 which is also the approximate level of the September breakout.
This week looks mixed with early week gains likely on the Sun-Jupiter aspect. After Monday’s holiday closing, Tuesday is perhaps the best candidate in this regard. Wednesday could also eke out another gain although time will be wearing thin as the bearish Mars-Ketu aspect will be undermining the bullish influence from Jupiter. I think an intraday reversal is possible Wednesday with late day weakness erasing any prior bullishness. The late week therefore looks more negative and may well contribute to another losing week. I would not rule out a winning week here but gold may only climb to $1380 or so and then reverse lower again. If gold is higher, it likely will be somewhere in that air pocket between $1360 and $1383. Gold’s woes are likely to continue as the Sun prepares to conjoin Mars on February 3. Next week’s Mercury-Saturn aspect is likely to push gold down further, and then the first week of February could see an interim bottom, perhaps somewhere around $1270-1300. We should see some rally attempt in mid-February, but late February and early March also contains some difficult-looking aspects.
5-day outlook — bearish-neutral
30-day outlook — bearish
90-day outlook — bearish

