- Stocks likely to stay strong until midweek
- Dollar may further weaken toward 50 DMA before rebounding
- Gold to rally to $1150
- Crude likely to bounce back from recent declines
- Stocks likely to stay strong until midweek
- Dollar may further weaken toward 50 DMA before rebounding
- Gold to rally to $1150
- Crude likely to bounce back from recent declines
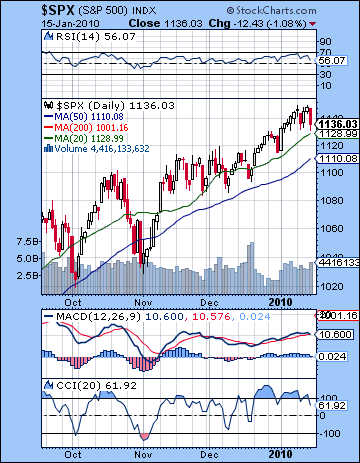 With offsetting earnings reports from Alcoa and Intel, stocks in New York were mostly unchanged last week. After a couple of rally attempts towards 1150, the SPX closed less than 1% lower overall at 1136 while the Dow finished flat at 10,609. This outcome was not entirely unexpected as I had been fairly equivocal in last week’s newsletter. Monday was something of a disappointment, however, as the gain on the Sun-Venus-Rahu conjunction never really materialized. This was perhaps an indication of the alternate scenario I mentioned whereby the conjunction’s completion coincides with the peak of prices followed by profit taking. Tuesday’s sell-off was perhaps further evidence of this, although the bearish Saturn retrograde station likely had a hand in the proceedings also. The market rose modestly into Wednesday and Thursday as the upward pull of the Venus-Neptune aspect took precedence over any lingering Saturn effect. Friday’s decline was not surprising given the Solar Eclipse and the Mercury Direct station. While I missed some of the intraweek trends, I was mostly correct in noting the choppy, up-and-down quality to the week. I had wondered if the twin stations of Saturn and Mercury might constitute a significant turning point in the overall direction of the market. With Friday’s decline, that possibility is still in play as any gains we may see this week need not exceed last week’s highs. It’s still too early to say conclusively if the market has peaked for the year here but the next move in the short term does seem to be down.
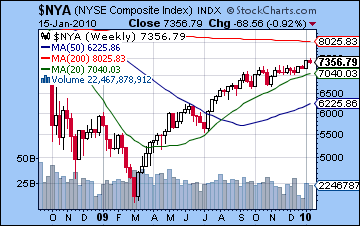
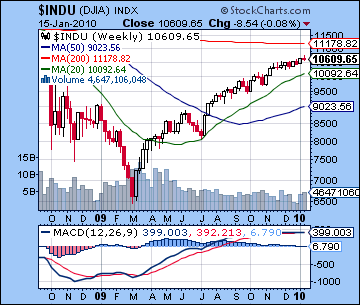
The market’s technical position has not changed significantly from last week. The volatility index ($VIX) continued to drift lower to 17 last week, its lowest since the all-time highs of 2007. While a reflection of optimism in the current market, it should be seen as a contrarian indicator as it signals high levels of complacency. Daily MACD on the SPX remains in a bullish crossover, although just barely. On the other hand, however, the positive histograms are shrinking in size in this most recent up leg, a sign perhaps of diminishing conviction. RSI at 56 is still bullish although falling. It also remains at a level at least as high or higher than previous lows, a sign of continued strength. Only a close below 50 would seriously interrupt the recent pattern in RSI and would likely coincide with a more significant correction of greater than 5%. Perhaps more negatively, CCI at 61 may be poised to decisively break below the critical 50 level after spending a fair number of days above 100. The series of ever-diminishing peaks over 100 are further evidence of the erosion of momentum. Despite the new year return to normal after the holiday break, volume continues to be only middling, another sign that last week’s highs are not exactly ringing endorsements of the current rally. Nonetheless, even with Friday’s down day, the S&P closed at its 20 DMA, a sign of solid price momentum. And the weekly Dow chart shows the positive MACD still in place, despite the broader averages like the NYSE Composite ($NYA) still slightly in negative territory. It is hard to paint a rosy bullish picture of the technicals, but at the same time, the bears have little reason for boasting. Until we see the S&P break below the 50 DMA and a bearish crossover of the weekly Dow MACD, the market will remain in its current technical stalemate. Given last week’s highs around 1145-1150, these should be seen as immediate resistance levels, with 1160 representing a second resistance line coinciding with the upper channel. Support could be found in the 20 DMA at 1128 with 1100-1110 acting as a key second level of support around the 50 DMA.
 Bond yields took a break from their recent ascent last week as fresh doubts about the recovery saw more investors seeking the safety of treasuries. As noted last week, the Fed has to make sure yields do not climb too high or they could forestall the chance of a sustainable recovery. As a symptom of investor wariness over rising US deficits, there is a significant yield divergence between US treasuries and German government bonds. With debt levels now approach 90% of US GDP, investors are demanding ever higher returns to compensate them for their risk. 5% on the 30-year treasury would seem to be a significant line in the sand after which Bernanke may be compelled to take stronger action to drain liquidity from the system. A more tangible reduction in liquidity would likely spook the equity markets and force investors into bonds and the Dollar. The horoscope of the Bernanke’s current term comes under increased pressure in the second half of January so it is possible that he may be compelled to act here. At the same time, the approval for a second term by the Senate appears to have hit a snag, so one cannot rule out some further problems for him in that process. The stresses in the chart are perhaps not sufficient to spell the end of his tenure as Fed Chair, but neither do they rule out that possibility. It is clearly not smooth sailing for Bernanke at the moment.
 This week seems mixed with some positive aspects dominating the early part of the week and more selling likely towards the end. With the holiday closing on Monday, the US may miss out on some of the gains promised in the Venus-Jupiter aspect. Tuesday looks more positive as the Sun approaches its own minor aspect with Jupiter. On Wednesday, the Sun-Jupiter aspect is near exact, although one caveat is that the Moon will move into opposition aspect with Saturn, so this might cause some weakness at the close. Nonetheless, there is still a good chance for net gains here across Tuesday and Wednesday. Thursday looks more difficult as Venus is in trine aspect with Saturn while the Moon aspects Mars right near the close of trading. I would interpret this to mean that sentiment could worsen as the day progresses. Friday seems harder to call, although with the Sun approaching an aspect with Saturn, I would lean towards a negative day here. Depending on the scale of Tuesday’s likely gain, we could see the market repeat last week’s flat performance. I would still err towards the negative here because I believe the overall direction of the market is down in the short term. That’s not to say that a gain isn’t possible this week as we could very well hit 1160 by Wednesday and close Friday around 1140-1150. But that still seems a bit optimistic in light of the iffy technicals and the prospect of several negative Mars aspects coming down the pipe next week.
Next week (Jan 25-29) looks more solidly negative as Mars aspects Mercury on Monday, Venus on Tuesday and the Sun on Friday. Mars is generally not a happy planet given to growth and optimism so it seems most prudent to expect some kind of noteworthy decline here. Friday looks like the worst day of the week. A test of support of the rising wedge channel around 1080 could be possible here. The following week (Feb 1-5) features a three planet alignment of Jupiter, Saturn, and Pluto which could see a rally attempt, especially early in the week. The Mercury-Rahu conjunction midweek could also see buyers dominate the market. After that, the planetary picture becomes harder to interpret. The second Saturn-Pluto square aspect in early February could mark a significant high, but a lot will depend on how low we go before then. If we get a sizable correction, then the market may only attempt another rally in February towards current levels. February could well see a sideways market before more trouble emerges in March and April. The spring period still looks quite bearish but the largest percentage decline may be likely to occur in July and August when Mars conjoins Saturn opposite Jupiter and Uranus and square Pluto. This is a classic pattern for a major bear market down leg: Mars conjunct a slow moving planet (i.e. Saturn) in hard aspect with another outer planet (i.e. Uranus and Pluto). A retesting of the March 2009 lows is definitely a possibility.
5-day outlook — bearish-neutral SPX 1120-1150
30-day outlook — bearish-neutral SPX 1080-1140
90-day outlook — bearish-neutral SPX 1050-1160
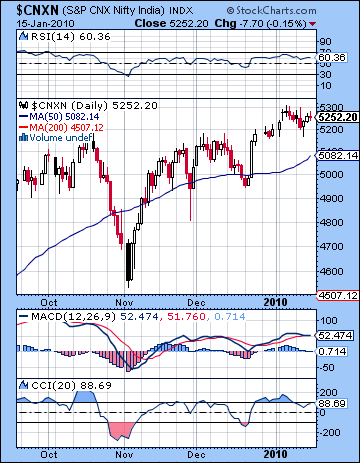 Stocks traded in a narrow range and ended mostly flat in Mumbai last week as investors grew cautious ahead of the central bank policy review at the end of the month. Despite several rally attempts to 5300, the Nifty ended Friday at 5252 while the Sensex closed at 17,554. I had expected more in the way of gains on the early week Sun-Venus-Rahu conjunction. Monday did see some modest intraday strength but the rally never got much traction. The inability for stocks to move higher here was a possible clue that the week would be less bullish overall. Tuesday saw a pullback to 5200 as the market retrenched with the approach of the Saturn retrograde station. This decline occurred a day earlier than expected and further upset the likelihood of any early week advance. The day of Saturn’s reversal did coincide with lower lows initially but the market reversed by the close as the Sun-Venus-Neptune pattern began to assert itself. As expected, Thursday saw a modest rise as the positive Neptune influence became stronger. The Solar Eclipse hit Friday but while stocks did have the anticipated bearish bias, the decline very minimal, as deeper declines only occurred later on in the day in Europe and the US. Overall, the week was a disappointing one for bulls as several apparently positive aspects failed to deliver any upside movement. By the same token, the simultaneous reversals in the direction of Saturn and then Mercury did not provide much comfort for bears as the market traded in an increasingly narrow range. It remains to be seen if last week’s planetary reversals and Solar Eclipse will prove significant in marking a meaningful top to the market. All we can say at the moment is that it is still possible and will depend on how strong the rally attempts are this week ahead of the bearish Mars-dominated period at the end of January.
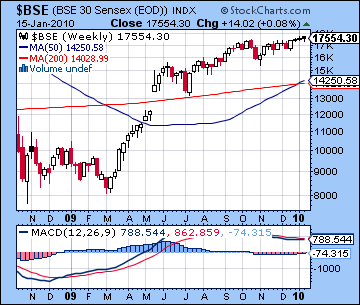
After the new year bullishness, last week showed the market backing off and consolidating its gains as it continued to trade within the rising wedge pattern. Support levels have moved steadily higher and now stands around 5100, which also closely mirrors the 50 DMA. Trades below this level would signal a possible breakdown in the wedge pattern and could spark further declines down to the next support level around 4800. The rising upper channel trend line stands at 5350 or so, as the inability to break above 5300 last week would suggest that resistance is quite significant. RSI at 60 on the daily Nifty chart is still bullish and offers plausible evidence for a continuation of the rally. Daily MACD is now on the verge of a bearish crossover although I would note that recent highs around 60 did not form a negative divergence with December highs and therefore should also be seen to given limited support to the bulls and the extension of the rally. Leading issues like Tata (see TTM chart) also continue to be strong and offer good justification for current levels. On the other hand, the shrinking size of the positive histograms in this latest bullish crossover is clearly a bearish indicator and may well presage a more significant correction. More importantly, the weekly BSE-Sensex chart still exhibits a bearish MACD crossover. This is key sign of the precariousness of this rally, although we should note that the negative histograms were slightly smaller this week, a possible sign of some kind of bounce. Nonetheless, until there is a bullish crossover in this indicator, it will be hard to fully believe that the rally can have staying power and move significantly higher. If it does happen to crossover, then another run up to 6000 becomes more possible. I do not think this is the most likely scenario, however, but it is something to watch. CCI on the Nifty stands at 88 and while bullish it is caught in a vulnerable spot where new rallies will try to take back above 100 but this could well become resistance and spark another major move down shortly thereafter.
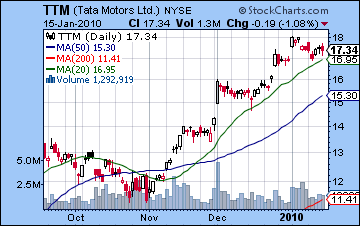 This week is likely to be mixed as some positive early week aspects are likely to be offset by more difficulty later on. There will be a positive alignment of Moon, Venus and Jupiter on Monday which could see prices rise. One caveat, however, is that the Moon-Jupiter conjunction will occur midday so there is a chance of weakness in the afternoon. Monday actually presents something of a puzzle since there ought to be a bearish bias given the sell-off in New York on Friday. Nonetheless, the planets indicate that Monday may be less bearish than it otherwise would be. Tuesday also offers a plausible case for the bulls as the Sun forms a minor aspect with Jupiter. This aspect only comes exact on Wednesday, but given the proximity of Venus, there is some reason to expect prices to have a bullish bias. Wednesday could also start positively as the Sun perfects its aspect with Jupiter and the Moon conjoins Uranus by midday. After that the Moon enters Pisces opposite Saturn so some selling is more likely in the afternoon. Thursday and Friday look more clearly negative as Venus forms a trine aspect (120 degrees) with malefic Saturn and could therefore trigger the Saturn-Pluto square. The theme here is one of caution and preservation of wealth and we could see profit taking and a movement out of equities into safer asset classes. While the aspect is more exact on Friday, Thursday could well be more negative since the Moon will closely oppose Saturn. At the same time, we should note that multi-planet alignments can be bullish, even when malefics outnumber benefics as they do here. I don’t think that will be the case in this instance, but downside expectations should be tempered. If Monday’s Venus-Jupiter manages to push prices higher, then stocks may end the week near current levels and could even eke out another small gain. If Monday ends lower, however, the chances increase for a decline back below 5200.
 Next week (Jan 25-29) looks more persuasively negative as a series of Mars aspects are likely to make investors uncomfortable and compel more of them to head for the exits. Tuesday will see a minor aspect between Mercury and Mars which will be closely followed on Wednesday by a Venus-Mars opposition. These are negative influences that have the potential to move the market out of their current narrow trading range. We should also note that Friday may see some fallout from the Sun-Mars opposition aspect although that will become exact after the close of trading hence its bearish effects will be less reliable. The following week (Feb 1-5) looks more positive on the Jupiter-Saturn-Pluto alignment and the midweek conjunction of Mercury and Rahu. If we see a significant correction the previous week, early February has a chance for a rebound rally that could continue into mid-February. Another significant high is possible Feb 14 or 17 near the Venus-Jupiter conjunction. Whether or not it is a higher high depends on the extent of late-January pullback. Given the overall bullish bias of this market, it seems prudent not to rule anything out here. Nonetheless, if we break support at 5000 in the near term, then the bulls would be harder pressed to take prices above 5350. The mid-February period looks quite volatile, however, owing to the Mars-Saturn aspect which also happens to occur around the 17th, so any highs made near that date are unlikely to last long. My best guess is that after the late-January pullback there will be another rally attempt in February that will fail to match previous highs and that will spark another round of selling. The spring period looks mixed at best with the possibility of declines increasing as time goes on with late April and May looking to be the most bearish period there. Summer still looks most bearish of all as the Mars-Saturn conjunction in late July could well coincide with sharp declines that could revisit the lows of last March. While the Mars-Saturn conjunction isn’t sufficient to drive down prices to this extent by itself, the key here is that the Mars-Saturn conjunction will be part of a larger alignment with Jupiter, Uranus and Pluto.
5-day outlook — neutral NIFTY 5200-5300
30-day outlook — bearish-neutral NIFTY 5000-5300
90-day outlook — bearish-neutral NIFTY 4800-5200
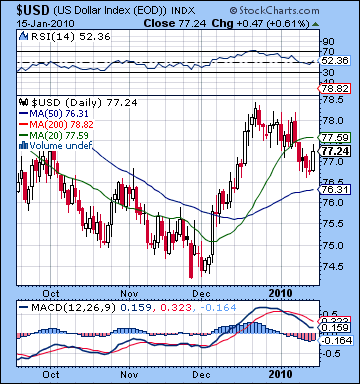 The Dollar slipped for the second week in a row as recovery prospects dimmed on spotty corporate earnings. After trading below 77, the Dollar index closed at 77.24. This was largely in keeping with our forecast as the Mars aspect to the USDX ascendant took the Dollar down early in the week with stability returning only on Thursday ahead of Friday’s significant advance that coincided with the Solar Eclipse. Despite this down trend, the Dollar remains in a fairly stable technical position. While daily MACD is still caught in a bearish crossover, we have yet to see a negative divergence form with respect to November highs. If current lows stay above November highs both in terms of actual price and MACD levels, then the rally will be on firmer ground as previous resistance levels will become support. Friday’s gain had the effect of turning RSI bullish again at 52. This is potentially significant since a bounce off the 50 level would constitute a re-affirmation of the medium term bullish trend. On the weekly chart, MACD has yet to form a bearish crossover so this is an even more reliable indicator that the rally is still intact. This does not preclude another temporary bearish crossover here but we should note that the trend appears to be turning and there is a good chance a bottom has been put in around 74. Support is likely found around the 50 DMA at 76-76.5 and we could well test that this week on the Sun-Jupiter aspect. This would represent at 50% retracement from the recent December highs and would set the stage for another leg up. There could be a significant amount of resistance around 78.5-79 and the 200 DMA so it may require more than one attempt to push above that level before the Dollar moves above 80.
This week is likely to start with more declines as both Sun and Venus fall under the aspect of natal Saturn. Tuesday and Wednesday could see closes below 77, and possibly down to 76.5. A recovery is possible later on in the week as the Venus-Saturn aspect could draw investors towards the Dollar as safe haven. Overall, the week could still be negative although not by much. Next week looks more positive on the heavy Mars action, with a possible decline to start the week followed by more bullishness as the week progresses. I would not be surprised to see the Dollar test its 200 DMA at this time. Early February looks more bearish again, so some retracement is likely then. Another rally is likely for the second half of February and into March so that may be the most likely time to expect the Dollar to break above 80.
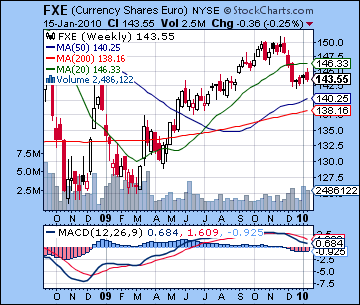 The Euro ended the week slightly lower closing Friday just under 1.44. I had been bullish on the early week period and indeed Monday’s gain set the tone for the early week with Tuesday and Wednesday more or less treading water. The late week also conformed with expectations as Venus fell under the influence of natal Saturn in the natal chart as the Euro declined a full cent on Friday. The overall outcome was a little more bearish than expected, but it did not significantly change the vulnerable technical position for the Euro. While it currently sits above its 200 DMA at 1.42, last week’s rally did not push it to its 50 DMA at 1.47. This failure to test it last week increases the significance of that resistance in the future. Moreover, weekly MACD is still in a bearish crossover and trending down towards the zero line. Given the greater pullback that is in the offing here, that weekly MACD is likely to stay looking bad well into February. Even a significant two week rally then may not be enough to alter its orientation. That failure to generate a bullish crossover on the weekly chart may well precipitate further losses in late February and March. This week is likely to begin positively the Sun and Venus will form trine aspects with the natal ascendant. This will likely move it up at least one cent and perhaps more. The late week period looks less clearly positive so it may close the week near current levels, perhaps slightly above. The Rupee gave back a little of its recent gains as it closed near 45.8. While another move up is in the cards next week, watch for more weakness through the second half of January.
Dollar
5-day outlook — bearish-neutral
30-day outlook — neutral
90-day outlook — bullish
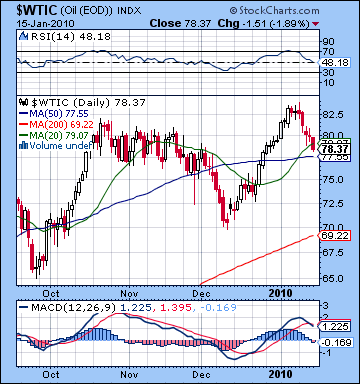 With demand falling on warmer weather in the US, crude oil saw some profit taking as it closed near $78. This outcome was somewhat surprising as I had expected more upside on the Sun-Venus-Rahu conjunction. And while I voiced some ambivalence about these aspects and did forecast some down days for the end of the week, I did not expect we would see a string of five losing sessions. In hindsight, the fact that the triple conjunction occurred on the 8th house cusp proved to be the deal breaker. Prices now sit just below the 20 DMA and are perilously close to the 50 DMA at 77. Friday’s loss produced a bearish crossover in the daily MACD chart while the weekly MACD remains fairly flat. While the decline was fairly sizable, it is worth noting that volume on the USO ETF was still near the average, suggesting that this may not necessarily be the beginning of a larger move down. We should see some support at 75-77 which may be tested as soon as this week. Below that, we could see resistance around $70 which coincides with both the previous low and the 200 DMA.
This week could see crude bounce back in the early going with the danger of more declines later on. The early week period will be dominated by the influence of Jupiter through the triggering aspects of Venus and then the Sun. While this does not set up near any significant point in the Futures chart, I still believe the most likely outcome is for crude to rise through Wednesday. With that caveat in mind, the late week looks more turbulent as transiting Venus will come under the aspect of natal Saturn. A push back up to $80 is therefore possible here although I suspect it won’t match its previous high of $83. The late week declines are likely to be fairly steep, so I would not be surprised to see crude around current levels or even lower. More losses are likely for next week as Mars will rule the roost. Gains are likely in early February as Jupiter will aspect the natal Moon-Saturn conjunction so we could well see crude again trading in this range of $75-85 at that time. We could well see the high for the year put in then since the second half of February and into March looks quite bearish.
5-day outlook — neutral-bullish
30-day outlook — neutral-bullish
90-day outlook — bearish
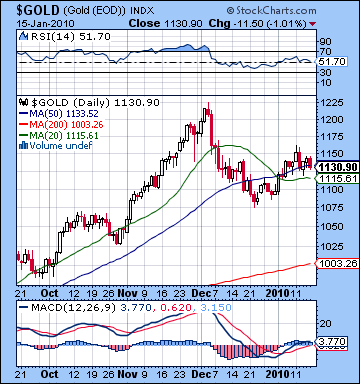 Gold failed to extend its rebound rally last week as it closed slightly lower at $1130 on the continuous contract. This outcome was surprising as I had expected more upside from the three different Sun-based aspects . While Monday was higher as forecast on the Sun-Venus-Rahu conjunction, the gain was very modest and signaled a possible weakening in this incipient rally off the December lows. Tuesday’s big decline was likely partially due to the oncoming Saturn retrograde station. Gold posted mild rises on both Wednesday and Thursday as the Sun-Neptune aspect provided the necessary upward lift. Friday’s decline was disappointing given the apparently positive hits to Venus ETF chart. Overall, this was a missed opportunity of sorts for gold as some good aspects went to waste and prices drifted lower. The technical picture confirms our suspicions that the near future is not so bright for gold. On the plus side, Friday’s close was near the 50 DMA, a possible level of support going forward. And daily MACD is still in a bullish crossover and has now crossed above the zero line. But the signs of vulnerability are also present. Volume on the GLD ETF is higher on recent down days than on up days. RSI has been tumbling recently on the continuous contract and now stands at 51 — barely in bullish territory. More troubling is the weekly MACD which is now put in its third straight week of negative bearish crossover. While levels are much higher (44) than a previous peak in March 2009, a bearish crossover in the midst of a rally does not bode well. I had expected more upside in this rebound rally with at least a 50% retracement to $1170 in range, but so far we have only seen intraday trading approach $1155 on a couple of days. Support may be around current levels and below that the bottom rising channel around $1090-1100 is another key level of support.
This week should see gold try to rally again in the early going as the Sun forms a positive aspect with Jupiter on Tuesday and Wednesday. Tuesday may be the better of the two days since the Sun will be exactly sextile the ascendant in the ETF chart. We could see a large rise here, perhaps 2%. Later in the week, transiting Venus will fall under the aspect of the natal Mars so some of that gain may be lost. It is difficult to determine if prices will be higher or lower by Friday, although I would lean towards a higher outcome overall. Next week presents a conundrum of sorts as the parade of Mars aspects ought to be negative for both stocks and gold. And yet, it is conceivable that gold may be the exception to the trend. Declines are likely on Monday the 25th and Friday the 29th, but between those dates some gains are possible. I still think the probable direction is down, but I wanted to note here that the GLD ETF contained some favourable Jupiter aspects that may nonetheless manifest in gains. The first week of February may start positively but selling will resume by Friday. I would not rule out some multi-day rallies in early February, but the best-case scenario appears to be a sideways market since the second half of February looks more negative on the Mars-Saturn aspect.
5-day outlook — neutral-bullish
30-day outlook — neutral
90-day outlook — bearish-neutral

