Summary for week of January 23 – 27
Summary for week of January 23 – 27
- Stocks more prone to declines as Mars turns retrograde Monday; late week rebound likely
- Euro vulnerable to early declines but could rally in second half of the week
- Crude oil may decline early but another rest of resistance is possible by Friday
- Gold could be negatively affected by Mars retrograde early but rebound is possible later
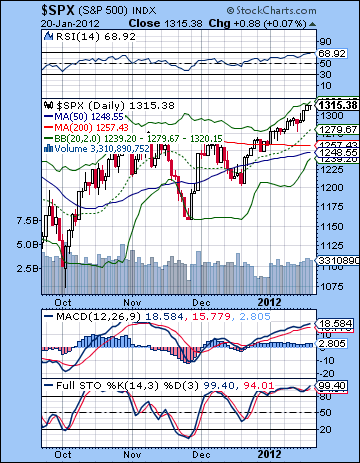 Stocks stayed on their January winning streak as positive earnings and renewed hopes for a favourable EU resolution kept the bulls in charge. Rising in all four sessions, the Dow climbed more than 2% closing at 12,720 while the S&P 500 finished at 1315. While I thought we might have seen more downside early in the week, the overall outcome was not all that shocking. The proximity of the bullish Jupiter-Uranus aspect allowed for the possibility of a break out above 1300 which I noted in last week’s newsletter. Clearly, I have underestimated the power of this Jupiter-Uranus in January even though it has been the closest aspect. I expected less of a direct path higher and more choppiness as bearish Saturn battled it out with Jupiter and its bullish ally Uranus. Not so. The market continues to push higher on diminishing volume, a possible sign of approaching weakness but without any obvious technical sell signal. Saturn’s caution and unease are lurking in the background here not too far from the field of action as we watch for the outcome of the Greek default talks. No news is good news it seems as stocks have marched higher without interruption.
As I have mentioned previously, this rally is getting close to a top, especially as Jupiter is now moving out of its exact aspect with Uranus. In retrospect, this pairing has been a key reason for the January rally. Now that these two planets are separating, there is more reason to be skeptical about any further highs. Highs are still possible, of course, but their likelihood would seem to decline now over time. The IMF fulfilled another Jupiterian promise last week as it pledged another $600 Billion to the Eurozone in order to back stop any trouble. In addition, key EU bond auctions went well as yields fell across the board. Just who was buying the bonds isn’t yet clear, although one suspects the ECB’s Draghi was filling up his shopping cart. While a Greek default may well have been discounted by the market, its implications are another matter. A disorderly Greek default would threaten some private European banks as losses on loans may exceed the 70% figure that is currently being quoted in debt talks . It is possible that this could trigger a domino effect where insolvent banks such as Paribas or Soc Gen have to cover losses by selling liquid assets such as gold and US Treasuries. This could set up a chain reaction that quickly undermines equity markets around the globe. Admittedly, this is the bear fantasy scenario and we aren’t there yet. I tend to think we won’t see such a downward spiral until April at the earliest, although I still expect some kind of correction in the near term. This is more likely to be countered by yet another central bank intervention or other stalling tactic by the Greek government. As Jupiter gently moves into the background here, Saturn is preparing to take a larger role as it approaches its retrograde station on 7 February.
 Well, if the market looked overbought last week, I guess it looks even more overbought this week. As we know, a strongly trending market can defy the usual technical indicators for a long time, just as the market did in 2009 and 2010. Without the artificial boost of QE3, however, stocks look less likely to defy gravity for that long. Some observers have noted that the Fed’s lending of cheap Dollars to the ECB basically amounted to QE3 by stealth so perhaps one should take that notion more seriously. And Fed Chair Bernanke is due to speak on Wednesday at the FOMC meeting so there is a possibility that he could announce something along the lines of QE3. But with US economic data strengthening lately, it seems fairly unlikely that he would announce anything major. With the indexes pushing up against resistance here, the market seems primed for some kind of correction. So far, the SPX has broken above the first trend line resistance and 200 DMA at 1270 and is now venturing for the next one at 1310-1330. This is arguably the more important falling trend line off the May 2011 high. And the market is getting overbought. Stochastics have moved up to 99 no less while RSI are one or two days from getting to the 70 line. Obviously, it could continue past 70, but there needs to be that much more in terms of enticement to get bulls to commit money on the long side. And the SPX is now right up against the upper Bollinger band at 1320. MACD is maintaining its bullish crossover here but is forming a negative divergence with respect to the previous high. While the Dow has broken above its falling trend line, the broader indexes are still under performing the blue chips. On the NYSE Composite, Friday’s close only just matched October’s high.
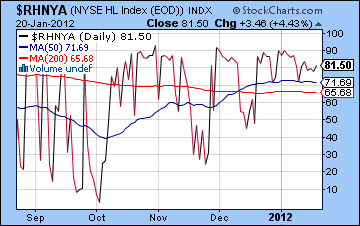
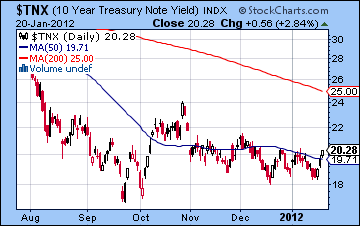
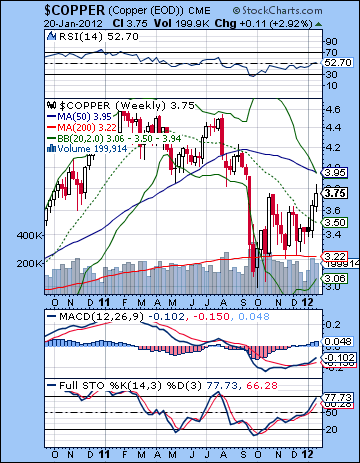 The High-Low index ($RHNYA) failed to keep pace with the indexes and is thus showing a negative divergence. It peaked in the first week of January and has been trending lower since then. This is an important indicator that some kind of correction is imminent. It could come next week or perhaps the week after but certainly soon. Meanwhile, copper has reached an important resistance level of the 200 DMA and its previous horizontal support level dating back to August. It posted a decline Friday so this another important indicator that an interim top of some kind may be bear. On the other hand, treasury yields did rise back above 2% on the 10-year last week, suggesting that the rise in equities was fueled by liquidity seeking higher return. This is neither bullish nor bearish for stocks although it somewhat legitimizes the bull case for stocks in the near term. Without any substantial amount of fear in the markets here, yields may simply be too low here to attract enough buyers. That money has moved into stocks. So we could see stocks reverse near current levels. A final run-up to 1330 is therefore still possible, although it may not last long. An initial corrective move may be quite small, perhaps only back to 1290-1300 before bulls move in to buy the dip once again. It is only when they fail to make a new high that things will get interesting. 1280 could be an important level of support on either the first or second move lower, which coincides with the 20 DMA and the previous low. I would also expect the 200 DMA to offer some support at 1257. The 50 DMA at 1248 is near enough that we could see some buyers there. Such a shallow correction (-6%) would be the more bullish scenario and I suspect we will get something deeper, perhaps back to 1180-1200. 1200 will be very important for the bulls to defend.
This week offers another shot at a reversal due to the Mars retrograde cycle that begins late on Monday. When Mars turns retrograde, it is said to intensify negative energy. This is by no means a sure thing, however, as other planetary influences have to be taken into account. Jupiter-Uranus is still close at hand so I would be surprised if the market turned on a dime here and just did a swan dive. That said, Monday’s Mercury-Mars aspect has the potential to move markets significantly, with the negative outcome more likely. I would also note that a positive outcome is also possible here because the aspect is 120 degrees rather than, say, 90 degrees. Tuesday has a better chance for a rise due to Mercury’s entry into Capricorn. This is not a huge factor but it is something which could temper any possible down move. It’s another reason why I am keeping my bearish expectations fairly low this week. Then the Moon conjoins Venus on Wednesday and Thursday, another potentially bullish energy. This is another weaker influence but it could offset some of the negative Mars energy that is out there. Bernanke speaks on Wednesday afternoon so that may suggest the usual bullish bias at least heading into the statement at 2:15. Late Thursday and Friday seem more negative as Mercury is in aspect with Saturn. Two possible scenarios here might be an early week sell-off back to 1290 followed by that lower high to 1310 on Thursday perhaps. This would set up Friday’s second sell off and would clear the path for a larger move down into early February. That would be quite welcome but it may also be overly compressed. A more conservative scenario would see this topping pattern formed throughout the week with a possible high put in as late as Thursday somewhere above 1315. I can’t quite bring myself to believe that stocks could stay that high for that long, but then again I’ve underestimated this rally so far. On the other hand, we should take the Mars retrograde seriously as a potential turning point.
 Next week (Jan 30-Feb 3) is another candidate for a down week. The Mars retrograde will establish itself on more solid ground, Jupiter will have moved a bit further off Uranus and Saturn will be one step closer to its station. The Venus-Mars opposition aspect is likely to figure prominently here and should be a bearish influence. The aspect is exact on Wednesday February 1 so that is perhaps a more likely time when it would manifest. This is perhaps a more likely down week. The following week (Feb 6-10) Saturn turns retrograde on Tuesday the 7th. This is also a strongly bearish factor that is likely extend the down move into a full-fledged correction. The early week looks somewhat more bearish and could generate some significant downside. It is possible the corrective move could last into the next week although I am unsure about that. If the bears are lucky, we could see 1200 tested on the downside. The bears haven’t been lucky lately, however, so we will have to see. Gains look more likely in the second half of February, although the market may be choppy. There are some clearly bearish short term aspects in the mix at that time that could keep markets fairly weak. (e.g. Feb 22-23 Mercury opposite Mars = very bearish!). And yet because Jupiter will be approaching its bullish aspect with Pluto in mid-March, there is a good chance that stocks will recover. But I acknowledge the possibility that stocks could sag through much of February and we get a lower high in mid-March. That is my more bearish scenario perhaps: a high of 1315-1330 in late January, followed by a correction to perhaps 1180 (?) into February and then a lower high of 1240-1280 in March. Then the market rolls over for real in April. If the market behaves more bullishly, then February’s pullback will be shallower and set the stage for a rally up to 1370 by March. Both are possible, but let’s see what effect the upcoming Mars and Saturn stations will be. I still expect Q2 2012 to be more bearish with a critical time in June and July. A retest of the October low of 1074 is quite possible by that time.
5-day outlook — bearish-neutral SPX 1300-1320
30-day outlook — bearish SPX 1250-1300
90-day outlook — bearish-neutral SPX 1220-1320
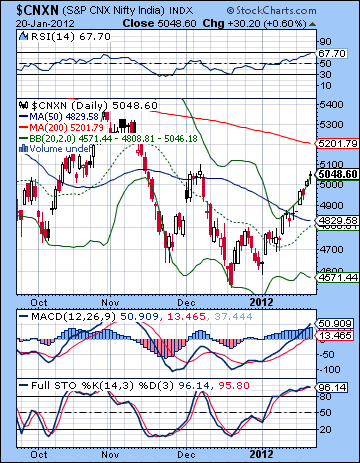 Stocks rose for the third week in a row on better news coming out of Europe and several positive earnings reports. The BSE-Sensex gained almost 4% closing at 16,739 while the Nifty finished the week at 5048. While I thought we might have seen more downside, this bullish outcome was also not hugely surprising. I noted how the exact Jupiter-Uranus aspect had the potential to prevent any significant pullback from occurring. I expected the second half of the week to be more bullish as the Sun entered into alignment with both Jupiter and Saturn. Stocks rose on both Thursday and Friday but without any significant prior decline, the Nifty finished above my upper target of 5000. Tuesday’s 2% gain was therefore the most unexpected development here coming as it did on the Mercury-Rahu aspect. Unfortunately, not all aspects play out as planned.
Jupiter is therefore continuing to support the market through its aspect with Uranus. The IMF has pledged another $600 Billion to support the EU in the event of further trouble. Last week’s bond auctions generally went well as yields fell across the board. Even if the ECB was stepping up its purchases, it nonetheless reflects a Jupiterian optimism that expansionary central bank policy can solve this crisis no matter what the cost. Saturn is close at hand here but apparently not yet ready to assert its more cautious ways. While the January stock rally has been significant, there remains a significant amount of skepticism about its durability. That caution is perhaps a sign that Saturn is lurking in the shadows, perhaps readying itself to emerge once again into the forefront. Greek debt talks are ongoing and have yet to resolve the key question of just how big a haircut bond holders will take. While it is true that markets have largely discounted a Greek default (it’s only a matter of time), markets have not discounted the consequences of a default on European banks. Those private banks are on the hook for that unpaid debt and if the haircut is larger than expected, there could be solvency issues. This is all to suggest that Saturn has yet to play its cards here. We are likely to see some more of these typically Saturnian developments quite soon once Jupiter loses strength. This may happen quite soon, although I am not expecting a huge meltdown just yet. While February is likely to begin bearishly around the Saturn retrograde station on 7 February, March looks bullish enough that the central banks will likely find a way to kick the can down the road a little further. As before, I think Q2 2012 is the more likely time for a larger correction.
 The Nifty’s march upward has been noteworthy but not exactly unexpected. After finding support at 4500-4600, we are witnessing another bear market rally. Unless important resistance levels are broken to the upside, there is little reason to expect these rallies can go far. Last week’s rally pushed towards the previous high near 5100. There is a ton of overheard resistance above 5100 that goes back to August and September. We need to watch the market carefully as it approaches 5100. Bears will likely take short positions here with tight stops in the event of a blow off rally. Even if the Nifty reaches beyond 5100, the 200 DMA lies just above at 5200. This is all roughly around the falling trend line from the 2011 highs. A close above this trend line would be important, although the rally would have to continue a while longer before the previous high was taken out. But how likely is a close above 5100-5200? The technicals suggest it is too soon to hope for such a move given how close to overbought the market is. RSI is very close to the 70 line. Notice how the market sold off whenever it approaches similar levels. Stochastics is also overbought although it has yet to turn lower. MACD is still in a bullish crossover.
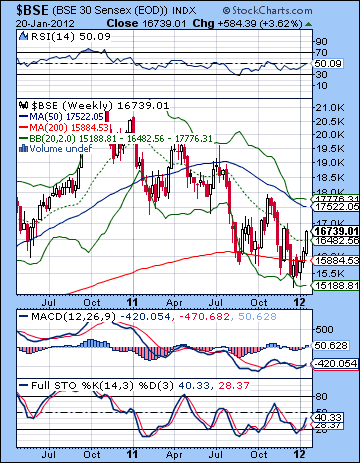
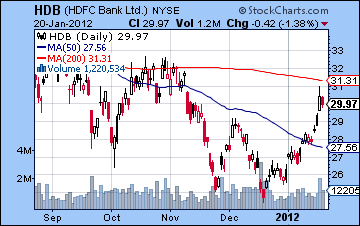
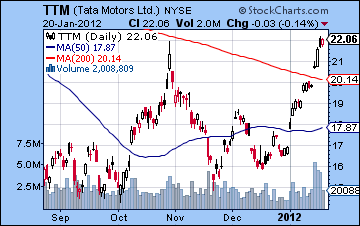
If 5100 looks iffy and 5200 looks more unlikely, then we should wonder where support lies. In the event of a correction that starts at 5100, bulls will try to halt the decline at the 50 DMA around 4829. This also roughly corresponds to the 20 DMA. It would also represent a 50% retracement from the recent low. While that level could well hold initially, there is a risk of another retest of the low at 4550. While I don’t expect that level to fall soon, we should be aware that a breach of 4500 opens the door to 4000. Despite the recent gains, the weekly BSE chart still looks quite bearish. The 13 week EMA is below the 34 week EMA. MACD has started a bullish crossover after forming a positive divergence from the recent bottoms. The histograms are lengthening here but we need to see this week’s to see if the bullish trend continues. RSI (50) is not looking encouraging. Previous rally attempts have all failed around this level. Actually, we can spot a series of falling peaks in the RSI suggesting that the bear market rallies are getting weaker. So stocks have managed a limited rally here under the conditions of a bear market. HDFC Bank (HDB) shows how vulnerable to profit taking this rally is. It ran up towards its 200 DMA last week only to fall short on Thursday. Friday’s red candle does not look promising at all. Another down day and there could be a rush to the exits in this stock. Similarly, another run up to 31 would likely bring out the bears once again. On the other hand, a close above $33 would be significant as it would be a close above the 200 DMA and the previous high. Until that happens, however, it does not look like a good long candidate. Tata Motors (TTM) had an impressive rally last week and matched its previous high. It also broke well above its 200 DMA and falling trend line. This rally occurred on good volume so perhaps it will have some staying power. A close above the July high of $24 would be quite bullish.
 This week increases the chances of a decline owing to the start of the Mars retrograde cycle early on Tuesday. Interestingly, the RBI will issue its latest rate policy update on Tuesday. With Mercury in close aspect to this stationary Mars, the chances would seem to be greater for some kind of decline. It is possible that this may also involve some disappointment over the RBI decision. It therefore seems somewhat less likely that it will cut rates, which would be bullish. There is nonetheless a good chance for a net negative result across the first two days of the week. If the negativity has been expressed at that time, then Wednesday would tend to see more bullish energy, especially in the first half of the trading day as the Moon conjoins Neptune. After Thursday’s holiday closing, Friday looks more bearish as Mercury is in square aspect with Saturn. Friday morning in particular would seem to be more bearish since the Moon lines up opposite Mars at that time. While the Mars retrograde has the capacity to alter the basic mood of the market, it is important to recognize that it may not operate like clockwork. This week definitely looks like it has greater bearish potential than last week, but it is perhaps not as bearish looking as next week. With that in mind, the bearish scenario here would be a retreat below 5000 by midweek, with an outside chance of a retest of the 50 DMA. I wouldn’t bet on that, however. If Thursday is higher as expected, then Friday would likely retest the lows of the week, wherever they may be. If the Nifty has managed to rise up above 5100 by Wednesday, then that would set up a shorting opportunity for Friday.
 Next week (Jan 30-Feb 3) looks more bearish. Mars will be picking up its backward speed, while Venus forms a bearish aspect with Mars in the middle of the week. With Jupiter presumably weakening here as it drifts away from Uranus, we could see the bears come back with a vengeance. A gain is possible on Monday, but the mood should darken by Wednesday 1 February when the aspect is exact. A rebound is possible by the end of the week but the market should fall more than 3% during this week. The following week (Feb 6-10) Saturn turns retrograde on Tuesday. This is another bearish energy that will likely burden the markets. The first half of the week looks worse with gains more likely in the second half of the week as Venus conjoins Uranus and aspects Jupiter. As Saturn gradually begins to separate from its aspect with Neptune, we could see some improvement in the second half of February. I say "could" because it is not a sure thing. There will remain a number of difficult short term aspects that could render this period of late February and early March somewhat choppy. Nonetheless, I tend to think that we should form a bottom in mid-February and then trade higher into mid-March and the Jupiter-Pluto aspect. There is a reasonable chance that this March high will be higher than the January high. That is my current thinking at least, although a lot will depend on what the effects will be of the preceding Mars and Saturn retrogrades. Q2 2012 looks like more downside to come, although there will continue to be significant rallies. Nifty 4000 looks quite doable by June or July, if not before.
5-day outlook — bearish-neutral NIFTY 4900-5000
30-day outlook — bearish NIFTY 4400-4700
90-day outlook — bearish-neutral NIFTY 4400-4800
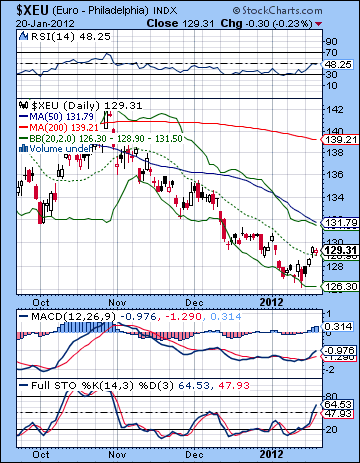 The Euro enjoyed a nice bounce last week as the IMF offered more liquidity to the beleaguered single currency region. The Euro finished above 1.29 while the Dollar Index closed above 80. The Rupee ended the week above 50. While I thought we would see a bullish bias to the Euro last week, I did not quite expect the size of this rally. Mostly because I thought we might get some early week downside. However, this never materialized so the late week Sun aspects added to previous gains and took the Euro back near resistance and the 20 DMA. It has now rallied back to a modest level from which aggressive bears will attempt to short once again. This is a somewhat risky strategy now because the Euro has broken out of its falling trend line that began in November. While we can’t preclude another collapse here, it does seem more likely that it will try to extend the rally to the upper Bollinger band and perhaps the 50 DMA at 1.32. Stochastics are on the rise but have yet to be overbought thus suggesting the real possibility of more upside. MACD is in a bullish crossover while the RSI is approaching the 50 line. The Euro short trade is very crowded at the moment, so there may be more upside here, especially in the event of some positive developments coming out of Greece in the coming days. This would create a massive short squeeze, if only temporarily. The next major resistance level would be near the 200 DMA near 1.39. This would be a possible upside target in the event of some major announcement out of Europe. But that is anything but certain now.
This week might see a bit more upside, especially in the early part of the week. However, the Mars retrograde makes this week a bit difficult to call. This should be a negative for risk currencies such as the Euro, and yet there is a fairly bullish looking aspect on Tuesday in the Euro horoscope that suggests the downside may be reversed quickly. For this reason, I wonder if we will have to wait until the second half of the week — after Bernanke’s pontifications on Wednesday — before we get much in the way of downside. Next week looks more reliably bearish as Venus opposes Mars exactly on 1 February. The Euro looks likely to make another move lower until February 8ish after Saturn turns retrograde. It could well remain weak after that, but I suspect that there will be some kind of bottom formed by mid-February. It is possible this could be as low as 1.20, although it probably won’t get down that low. Some bounce is quite likely at the end of February and early March lasting into the Jupiter-Pluto aspect on March 14. This is likely to be a significant rebound back above 1.30 and perhaps higher. Another big swoon looks likely after mid-March and we could easily see lower lows in the spring.
Euro
5-day outlook — bearish-neutral
30-day outlook — bearish
90-day outlook — bearish-neutral
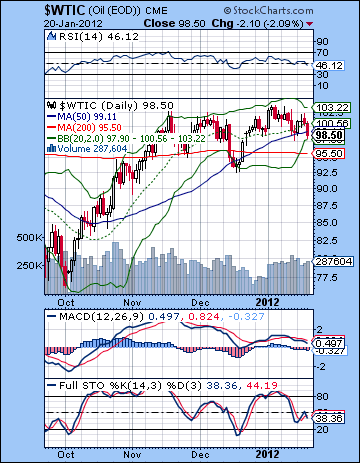 Crude oil slipped as warm winter weather in the US lowered demand prospects in the near term. WTI crude finished below $99. While I thought we would be fairly neutral, the week did not unfold as expected. Instead of declines in the early part of the week, oil rallied back over $100 while the late week was more bearish than forecast. Nonetheless, the overall down trend remains in place for crude as it did not break above recent highs. We have therefore seen a series of lower highs this month. This is a possible indication of further downside to come, especially if new lows are made soon below $98. The technicals look weak here as MACD is in a bearish crossover and appears to be headed to the zero line. RSI is falling also while stochastics is now in a fresh bearish crossover after failing to rise to the 80 line. From a longer term perspective, the 200 DMA is now flat and on the verge of turning lower. The 50 DMA may be preparing for another death cross of the 200 DMA in the event of another correction. In terms of support, I tend to think the 200 DMA won’t act as solid support. More important will be the previous low at $93. If this is broken, then look out below. Until that time, crude may continue to stay fairly high as it benefits from the endless saber rattling in the Middle East.
This week opens up the possibility of more serious downside given the Mars retrograde cycle that begins on Tuesday. Monday’s Mercury-Mars aspect is also not a positive looking influence, although I admit it could go either way. But this Mars retrograde station exactly squares the ascendant in the Futures horoscope so that increases the likelihood of declines this week. That said, I can’t quite bring myself to forecast major downside here. The Mercury-Mars aspect could fail to push crude lower, and there is some midweek upside on the Moon-Venus conjunction that also has some bullish potential. Friday’s Moon-Uranus aspect also looks bullish, although there, too, there is a cluster of planets that make things hard to call. If pressed, I would lean towards some fallout at least from the Mars retrograde Monday or Tuesday, but we could well finish close to current prices. Next week looks more inviting in terms of downside. Venus opposes Mars while the Sun is in aspect with Ketu. Then the week after Saturn turns retrograde so that boosts the probability for more declines. The corrective phase could last into the third week of February. In terms of possible targets, I think $93 will fall away fairly quickly, and we could even approach $80. A rally will likely begin in late February and continue into mid-March. But this is likely to produce a lower high (<$100). Another move lower is likely going into April.
5-day outlook — bearish-neutral
30-day outlook — bearish
90-day outlook — bearish-neutral
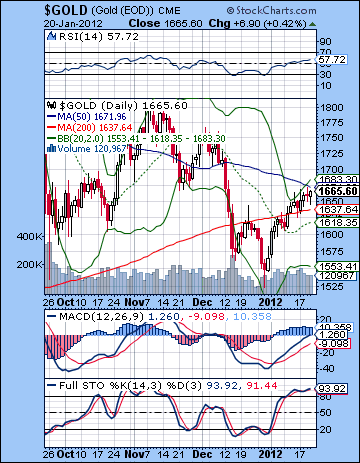 Gold moved higher as the IMF pledge to further backstop the EU added to inflationary concerns. Gold finished the week near $1665. While I was mistaken in expecting some early week downside, my overall sense that we could test the 50 DMA proved correct as gold closed within $6 of that line. Gold is approaching some fairly important resistance here so it is unclear from a technical standpoint just how much higher it can advance in the current rally. It’s not only resting just underneath the 50 DMA, but it’s right at the upper Bollinger band. Most importantly, it is also at the falling trend line from the August high. That is a lot of resistance to climb over. Given how far gold has fallen recently, I think it may be too soon for it to rally beyond that level. MACD is in a bullish crossover and is just approaching the zero line. This may be a good time for it to reverse lower once again. Also note that a correction here would likely hasten a death cross of the 50 and 200 DMA and could solidify the bear market that much more. Gold may find some support at the 200 DMA but it may not hold for long. I would expect bulls to defend the previous low more enthusiastically at $1550 or so. Longer term, however, gold’s current rally may simply be a back test of the rising trend line from 2009. That would suggest that it has some serious downside in the medium term.
This week’s Mars retrograde may be an important influence. It is possible that we could see some early week upside on the Mercury-Mars aspect, especially on Monday. But there is a greater chance that this will spell trouble for gold after that. Some gains are likely around the Moon-Venus conjunction, probably on Wednesday. Thursday is perhaps more bearish, as is Friday. I would lean bearish here, but allow for the possibility of some upside surprises too. Probably gold finishes somewhere below its 50 DMA but maybe not by much. Next week looks more bearish as Venus opposes Mars on Wednesday February 1. This could be a larger decline than anything we might see this week. I would expect the 200 DMA to be broken on the downside. Gold looks fairly bearish into mid-February, and perhaps for most of the month. I expect gold to fall below $1600 in February and I would not be surprised to see it retest its previous lows at $1550. Some recovery is likely in early March but another move lower is likely in April. I am expecting a lower low by June at the latest. A rally is likely in August which could last into October perhaps but the end of the year looks very bearish. Gold looks like it will remain out of favour until 2013 or later. It is conceivable it could end up falling below $1200.
5-day outlook — bearish-neutral
30-day outlook — bearish
90-day outlook — bearish

